


Abstract
Breast cancer comprises several molecular subtypes with distinct clinical features and treatment responses, and a substantial portion of each subtype remains incurable. A comprehensive analysis of multi-omics data and clinical profiles is required in order to better understand the biological complexity of this cancer type and to identify new prognostic and therapeutic markers. Thus, there arises a need for useful analytical tools to assist in the investigation and clinical management of the disease. We developed Cancer Target Gene Screening (CTGS), a web application that provides rapid and user-friendly analysis of multi-omics data sets from a large number of primary breast tumors. It allows the investigation of genomic and epigenomic aberrations, evaluation of transcriptomic profiles and performance of survival analyses and of bivariate correlations between layers of omics data. Notably, the genome-wide screening function of CTGS prioritizes candidate genes of clinical and biological significance among genes with copy number alteration, DNA methylation and dysregulated expression by the integrative analysis of different types of omics data in customized subgroups of breast cancer patients. These features may help in the identification of druggable cancer driver genes in a specific subtype or the clinical condition of human breast cancer. CTGS is available at http://ctgs.biohackers.net.
Introduction
Breast cancer is the leading cause of cancer death among females worldwide. It is a highly heterogeneous disease comprising different subtypes [1]. Clinically, it is categorized into three basic subtypes according to the expression status of estrogen receptor (ER) and progesterone receptor (PR) and of human epidermal growth factor receptor 2 (HER2). The subtypes are further divided into more detailed molecular categories based on gene expression profiles [2–4]. Each subtype has distinct histopathologic features and biological behaviors with different risk factors, clinical outcomes and responses to systemic therapies [1–4]. However, even within the same subtype, there is a high variability of responses and resistance mechanisms to conventional drug therapies [5–7]. Hence, to better understand the biological complexity and heterogeneity of breast cancer, several efforts have been made over the past years on the characterization of breast cancer genome [8]. Importantly, large-scale studies by our and other research groups, employing whole-genome and whole-exome sequencing, have identified numerous genetic aberrations in various subtypes of breast cancer, including copy number alterations (CNAs), mutations and chromosomal translocations [9–13], providing valuable information to further refine the molecular subtypes of breast cancer and to help identify new drug targets for breast cancer.
Recent advances in next-generation omics technologies have led to the development of breast cancer research across diverse omics, including transcriptomics, epigenomics and proteomics, in addition to genomics [8, 14–19]. These multiple layers of omics information offer the opportunity to comprehensively investigate the functional consequences and interactions between different types of molecular alterations that may occur in the disease, thereby providing effective treatment targets [18, 19]. There are numerous publicly available data sets that can be used for the integrative analysis of multi-omics data from a vast number of breast cancer patients [14–18]. The Molecular Taxonomy of Breast Cancer International Consortium (METABRIC) data set provides information on CNAs, gene expression profiles and genetic mutations for 1980 cases of breast cancer [14, 15]. Likewise, The Cancer Genome Atlas (TCGA) provides a wide variety of omics data from over 800 breast cancer patients, including DNA methylome and proteomic analysis of protein phosphorylation, besides genomics and transcriptomics [16, 17]. In addition, many types of omics data sets for breast cancer are available at the Gene Expression Omnibus (GEO) [18, 20]. Using these multi-omics data sets, accumulating studies aimed at discovering novel therapeutic targets in breast cancer subtypes have investigated the association of clinical implications with genomic and epigenomic aberrations and with the dysregulation of gene expression [21–23]. For instance, therapeutically relevant oncogenes acting as a target for gene amplification have been identified at the genome-wide scale in luminal breast cancer by the integrative analysis of omics data sets (i.e. genomics and transcriptomics) and pharmacological data [22].
Given the importance of integrating multiple layers of omics data to interpret the clinical significance of various genomic and epigenomic alterations in human cancer [8, 24, 25], several web-based tools developed for clinicians and researchers are intended to facilitate the analysis of single- or multi-omics data from cancer patients, including cBioPortal [26], Breast Cancer Integrated Platform (BCIP) [27], MOBCdb [28], Oncomine [29], Kaplan–Meier (KM) plotter [30] and TCGA4U [31]. Of these, cBioPortal and BCIP are the most advanced web applications allowing integrative analyses of multiple layers of omics data. For instance, cBioPortal (http://cbioportal.org) gives access to major multi-omics data sets, including TCGA, and provides various analysis functions, such as graphical summaries of gene-level data from multiple omics layers, network visualization, survival analysis and patient-centric queries. BCIP (http://www.omicsnet.org/bcancer/), which collects multi-omics breast cancer data sets, provides subgroup-specific integrated analysis functions for differential expression, survival, co-expression, microRNA-target interactions and gene functional networks. However, these web-based tools have a limitation as they do not comprehensively examine the association between patient survival outcome and molecular alterations at multiple levels. In the cBioPortal survival analysis, patients are simply divided into either a normal group or a group with genetic alteration status, without distinguishing alteration types or gene expression levels. Although the BCIP provides a function for survival analysis according to either gene expression levels or CNAs, this function is restricted to single genes and does not consider other layers of omics data. In particular, currently available web applications only allow to examine user-selected gene queries and do not provide the possibility to screen candidate gene targets at the genome-wide scale in customized subgroups with specific clinical features of interest.
In this study, we developed a web-based analytical tool that facilitates the integration of multi-omics data, provides improved survival and functional analyses, is a genome-wide screening system for the detection of dominantly acting cancer genes with genetic/epigenetic aberrations, and allows to organize them in customized breast cancer subgroups. This platform can provide useful information on breast cancer for translational research and clinical practices, and it allows users to rapidly discover druggable cancer driver genes for specific breast cancer subtypes or for customized subgroups.
Materials and methods
Data collection
The METABRIC and TCGA breast cancer multi-omics data sets were downloaded from cBioPortal (http://cbioportal.org), which provides preprocessed data for these data sets. Linear CNAs from the METABRIC data set were supplemented with data obtained from the Synapse website (https://www.synapse.org/#!Synapse:syn1688369/wiki/27311). The purpose of using these data was approved by the institutional review board of Hanyang University (HYI-14-158-1) in accordance with the guideline of the Synapse website. A total of 38 gene expression data sets of breast cancer including clinical features were obtained from the GEO (https://www.ncbi.nlm.nih.gov/geo/) using the GEOparse package (https://github.com/guma44/GEOparse). All data sets used in this study are described in Supplementary Data Table S1. National Center for Biotechnology Information (NCBI) Entrez Gene [32], gene sets in the Molecular Signature Database (MSigDB) [33], pharmacological characterization of genes in the Therapeutic Target Database (TTD) [34] and dGene and drug–gene interaction database (DGIdb) [35, 36], synthetic lethality networks in data mining synthetic lethality identification pipeline (DAISY) [37] and gene-cancer relatedness Concept Signature Analysis (ConSig) [38] were used as additional resources. We used the mygene package (https://pypi.org/project/mygene/), which uses the NCBI gene ID; the MSigDB, TTD, dGene, DAISY and ConSig were directly downloaded from their corresponding web sites. dGene data were obtained from DGIdb (http://www.dgidb.org/downloads) [35, 36].
Data preprocessing
The breast cancer multi-omics data sets downloaded from cBioPortal (METABRIC and TCGA) and GEO (38 different gene-expression data sets) were transformed to Python objects for efficiency and reusability of functions by polymorphism in object-oriented programming (OOP). Each layer of omics was assigned an object in the Pandas DataFrame format (https://pandas.pydata.org), which is a tabular data structure with labeled axes. Clinical information of patients from the METABRIC and TCGA data sets was integrated, and genetic aberrations of various layers of omics were transformed to data tables of linear CNAs, CNAs, expressions and methylations. Quality check was performed using Pandas DataFrame to filter redundant records and to convert raw data into consistent data types. The GEO Series from the GEOparse package was converted to the common data structure of Cancer Target Gene Screening (CTGS). Clinical information of patients, such as tumor grade, histology and times of follow-up and events (death and/or recurrence) were manually parsed from the ‘Characteristics’ field of the GEO sample records. We checked whether the quantitative data, including expressions, were implemented log2 conversion. For log2 unconverted data, each expression value was converted to log2 of the value and quantile normalization was performed using the quantile_transform function of the Python library scikit-learn (https://scikit-learn.org/). Although each GEO Series had different gene annotation information, we maintained basic gene annotation data including probe ID, NCBI Entrez Gene ID and gene symbol using the mygene package. These were used for gene query in the analysis of CTGS. All missing and inconsistent data were converted to the ‘nan’ object of the Pandas program. Patients’ information on ER, PR and HER2 status in each data set was used to designate basic subtypes of breast cancer, namely ER+, HER2+ and TNBC (triple-negative breast cancer; ER-/PR-/HER2-) (SUBTYPE: ER+ excludes ER+/HER2+; SUBTYPE2: ER+ includes ER+/HER2+; SUBTYPE3: separate HER2+ to ER+/HER2+ and ER-/HER2+). We used SUBTYPE for this study.
Implementation of web application
For the rapid data set operations and web responses, we implemented a web application to store data sets of cached objects. In the memory cached structure, each data set object was first loaded into the memory and resided. Using these objects, we developed four main functions of CTGS; the 1st being the function of ‘Data tables’, which displays DataFrames of each omics layer in table format. Next, the function ‘Plots’ allows to query gene quantities in the DataFrame and to represent them as box and scatter plots. The ‘Survival analysis’ integrates clinical information with gene aberrations of query genes and allows to display a KM plot along with additional tables for survival and statistical analyses. Last, the ‘Target gene screening’ function estimates the target possibility of all genes by analyzing inter-omics correlations.
For the stratification of patients in the ‘Survival analysis’ and the ‘Target gene screening’, we provide the option to calculate the most significant cutoff value for predicting differences in gene expression [39] in CTGS. The latter function was named ‘max-sig cutoff’. It calculates log-rank P-values of cases between quantiles 0.2 and 0.8 by a two-step method. In the 1st step, the significant regions are identified sparsely among 15 splits between the 0.2 and 0.8 quantiles, and, in the 2nd step, the most significant cutoff point in a region is determined.
We developed the back-end and front-end of the web application using various Python libraries. The framework flask (http://flask.pocoo.org) was used to assist in the management of web requests and responses, data retrievals and numeric calculations. A web front-end was built with Boostrap (https://getbootstrap.com), which provides basic web templates and styles. Numeric data were visualized using Matplotlib (https://matplotlib.org), a tool that allows to display charts such as box and scatter plots and KM curves.
Implementation of the ‘Target gene screening’ platform
The ‘Target gene screening’ application of CTGS was designed to prioritize clinically and biologically significant genes with genetic/epigenetic aberrations or dysregulation by considering the results of survival analyses and genome-wide calculations of ConSig-Amp (amplification), -Homdel (homozygous deletion), and -Met (methylation) scores, in specific subtypes or clinical features. ConSig-Amp (ConSig-Homdel) and ConSig-Met scores for target gene screening were obtained. The former was calculated by multiplying ConSig by the Spearman correlation between the linear CNAs and expressions, while the latter was calculated by multiplying ConSig by the correlation between DNA methylation and expressions. For rapid screening of candidate target genes in the website, parallel programming method was used. The list of predicted target genes is displayed as a sortable table. In the table list, each gene was linked with information on drugs and on synthetic lethal (SL)/synthetic dosage lethal (SDL) partners of specific genes, respectively retrieved from the TTD [34], dGene [36] and DAISY [37] databases.
Statistical analysis
All statistical analyses in CTGS were designed to use statistical libraries, SciPy (https://www.scipy.org), StatsModels (http://statsmodels.org) and Lifelines (https://github.com/CamDavidsonPilon/lifelines) in the Python programming platform. Statistical tests for comparing two groups were performed using the SciPy package, and multiple group comparison was carried out using both SciPy and StatsModels. Pearson, Spearman and Kendall correlation coefficients were calculated using SciPy. The genes with absolute Pearson correlation coefficient >0.3 were considered as co-expressed. Lifelines, an implementation of survival analysis in Python, was used to perform the survival analyses of KM with log-rank test and Cox proportional hazard regression models.
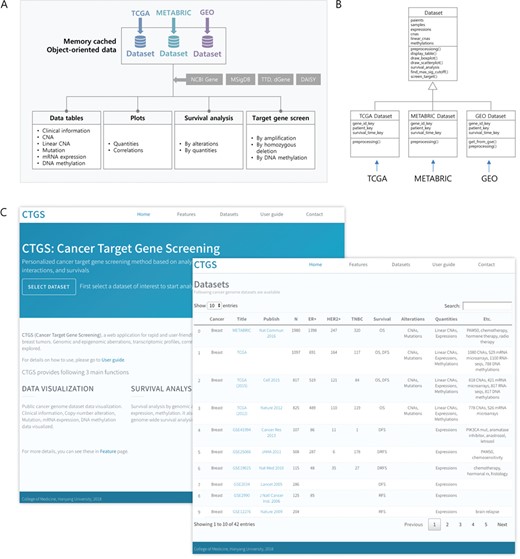
Overview of the CTGS web application. (A) Schematic diagram showing the architecture of CTGS. (B) Class diagram for object-oriented data management and classes used data sets. (C) Front page of CTGS web application (left) and display of information on each data set in the panel of ‘Datasets’ (right).
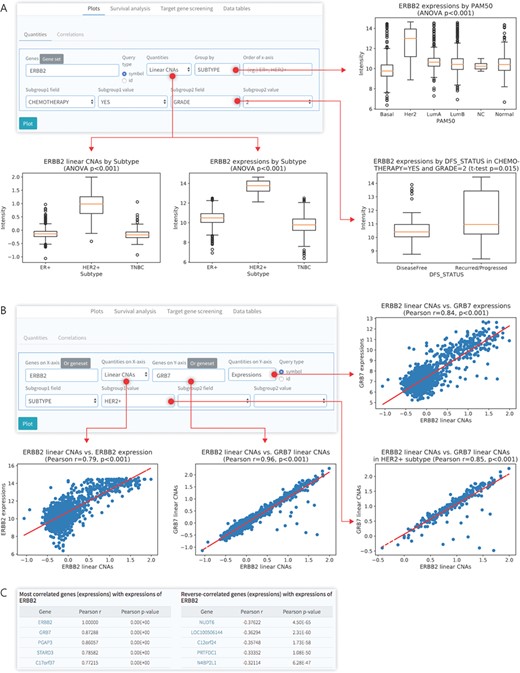
Data visualization for gene quantities. (A) Box plots for differential quantities. Several input queries, such as genes, type of quantities (linear CNAs, expression and DNA methylation) and grouping condition by specific subgroup, were used. (B) Correlation analysis for the different input queries, such as gene expression and linear CNAs, in a specific subgroup. (C) Lists of positively (r < 0.3) or reversely (r < −0.3) correlated genes with a specific gene (ERBB2) screened using CTGS.
Results
Overview of the CTGS web application
To support the analysis of breast cancer multi-omics data and target gene screening in the web environment, the CTGS portal (available at http://ctgs.biohackers.net) provides a user-friendly interface comprising four main functions: ‘Data tables’, ‘Plots’, ‘Survival analysis’ and ‘Target gene screening’ (Figure 1A). All omics layers are displayed as tables in the ‘Data tables’ panel; differential quantities are visualized, statistically tested and analyzed for correlations in the ‘Plots’ panel; survival analysis by various genetic aberrations can be performed in the ‘Survival analysis’ module; and genome-wide real-time target gene screening is carried out in the ‘Target gene screening’ panel. The CTGS database is composed of a collection of public multi-omics data sets, including TCGA, METABRIC and GEO, which are organized to the memory cached data structure by polymorphism of OOP (Figure 1B). This allows the extension of the data structure for the various formats of multi-omics data sets and a real-time rapid calculation of the large matrix. An analysis data set can be run in the front and ‘Datasets’ page of the portal, and researchers can easily perform analyses of multi-omics data as well as target gene screening through a simple and intuitive user interface (Figure 1C). All data sets, databases, software and algorithms used in this study are listed in Supplementary Data Tables S1 and S2.
Data visualization and statistical analysis for differential gene quantities
Multi-omics data consists of patient-specific qualitative and quantitative information contained in various omics layers. CTGS provides the ability to visualize, compare and correlate gene quantitative information at various levels in order to understand the association between clinical characteristics and differential gene quantities, such as copy number values and gene expression levels. A putative discrete copy number for each gene is called from relatively linear copy number values obtained from a copy number variation (CNV) array by the GISTIC algorithm [40]. For the quantification of DNA copy numbers of a single gene, CTGS provides both linear and discrete copy number values. In the ‘Plots’ panel, users can analyze the differential expression or CNA levels of a gene of interest in customized subgroups by visualizing the result as a box plot and calculating its statistical significance determined either by a Student’s t-test for comparison between two groups or by analysis of variance (ANOVA) with post-hoc Tukey honestly significant difference (HSD) test for multiple comparisons. Using this interface, we confirmed higher levels of gene expression and linear CNAs of ERBB2 (also designated HER2) in the HER2-enriched subgroup compared to all other breast cancer subtypes in the METABRIC (P < 0.001, ANOVA; Figure 2A, left and top right). In addition, CTGS allows users to analyze the gene expression levels and the copy numbers of interest in combination with clinical features by selecting up to two subgroup fields. ERBB2 expression was significantly higher in the tumor-relapsed group than in patients with no recurrence, among patients with histological grade 2 breast tumor who received chemotherapy (P = 0.015, Student’s t-test; Figure 2A, bottom right).
CTGS also provides a correlation analysis function that is useful to find co-expressed or exclusively expressed gene pairs, and to quantify the association between gene expression and CNAs. In the ‘Correlations’ function, which is found within the ‘Plots’ panel, CTGS allows to visualize the correlation between two genes of interest in a customized subgroup by displaying a scatter plot and calculating a correlation coefficient value and its statistical significance. Through this analysis of the METABRIC data set, we confirmed the strong correlation between ERBB2 copy numbers and its gene expression levels (Pearson R = 0.79) or the copy numbers of GRB7 (R = 0.96), which is co-amplified with ERBB2 [41], as shown in Figure 2B. Users are also allowed to query a single gene of interest to discover the positively or negatively genes co-expressed with the input gene (Figure 2B, bottom). Thus, through the visualization of gene quantities and differential and correlation analyses, it is easy to determine how gene quantities change and correlate under certain conditions, such as in the presence of specific clinical features.
Survival analysis based on multi-omics data
Although the clinical outcome of genetic aberrations for a particular gene can be determined by survival analysis, current web-based survival analysis tools for cancer genomics do not provide this function, but only provide gene expression level-based survival analysis results. CTGS permits to define the clinical implications of gene expressions and of various genetic aberrations in human breast cancer. In the ‘Survival analysis’ panel, patients can be stratified into two groups according to the status of CNAs (amplification, homozygous deletion, gain and loss), single-nucleotide variations, gene expression levels and DNA methylations (Figure 3A). For instance, we confirmed that the gene amplification of ERBB2, the mutation of TP53 and the overexpression of ESR1 are associated with worse overall survival (OS) (P < 0.001 in the METABRIC log-rank test) and that hypermethylation of CDH1 is associated with poor disease-free survival (DFS) rates in breast cancer (P = 0.012 in TCGA log-rank test; Figure 3B). Furthermore, the survival outcome in relation to the genetic aberrations of a gene of interest can be determined in a specific subtype or in association with a certain clinical feature. As an example, we found that the amplification of MYC is a significant prognostic marker in the ER+ subtype (OS, P < 0.001, log-rank test), but not in the HER+ subtype (OS, P = 0.098, log-rank test) and TNBC (OS, P = 0.5, log-rank test) in the METABRIC (Figure 3C). These data were consistent with a previous report showing that amplification of MYC has no clinical significance in the TNBC subtype [42].
We also implemented a function in CTGS that enables survival analyses in combined groups of two genetic alterations. This function is useful for predicting links between biological functions of two related genes, such as interaction or synthetic lethality. Using this tool, we confirmed the usefulness of the co-amplification of ERBB2 and GATA3 and of the co-mutation of TP53 and PIK3CA for predicting a worse prognosis of breast cancer (OS, P < 0.001 in METABRIC, log-rank test; Figure 3D), which is consistent with a previous study [43].
When performing survival analyses according to gene expression levels, it is important to determine the optimal cutoff point of gene expression for stratifying patients into two groups (‘high’ and ‘low’) in order to make better clinical decisions. CTGS provides the option to group patients according to the most significant (log-rank test) split, by means of a method of cutoff determination based on the significance of correlation with survival variables [39]. This function was named ‘max-sig cutoff’ for survival analysis in relation to gene expression levels. For the rapid determination of the most significant cutoff point, the most significant region is first found sparsely and the cutoff value with the lowest P-value in the region is then determined (Figure 3E). This enables the application of the optimal cutoff for the expression levels of each gene in the survival analysis. Taken together, CTGS allows users to identify clinically significant genetic aberrations or dysregulation of gene expression by providing diverse options for survival analysis.
Multiple analysis of functional gene sets
Many biological processes involved in cancer progression, such as cell proliferation, angiogenesis, invasion and metastasis, are regulated by multiple genes. A list of genes associated with a particular biological function or signaling pathway is called a gene set. A gene set can be used for differential quantitative comparisons, correlation analyses and survival analyses of multi-omics data to confirm associations with specific functions. While the current tools for the gene-level survival analysis tools permit only single-gene queries, CTGS supports the diverse analysis of multiple genes or of a gene set of interest. Researchers can select a single gene set of interest from a variety of gene sets registered in MSigDB [33] and can also add or delete genes from the list of automatically filled genes (Figure 4A). We inferred that these biological functions are related with specific subtypes. For the selected gene set, various analytical methods, such as measurements of differential expression levels in specific subgroups, correlation and survival analyses, are available in CTGS. For instance, the box plots displayed in Figure 4B show that the expression of the G2M checkpoint gene set (200 genes) was the highest in the basal subtype (P < 0.001 in the METABRIC, ANOVA), and that expression of the PI3K–Akt–mTOR signaling gene set (105 genes) was the highest in the HER2+ subtype (P < 0.001 in the METABRIC, ANOVA). In the correlation analysis of two gene sets, the expression of the angiogenesis-related gene set (36 genes) was significantly associated with the expression of the epithelial-mesenchymal transition-related 200-gene set (R = 0.9 in the METABRIC; R = 0.88 in TCGA). The apoptosis gene set (161 genes) and the p53 pathway gene set (200 genes) were also significantly correlated (R = 0.74 in the METABRIC; R = 0.79 in TCGA; Figure 4C). Furthermore, according to the survival analysis, the G2M checkpoint gene set (200 genes) and the PI3K–Akt–mTOR signaling gene set (105 genes) were strongly associated with lower OS rates in breast cancer (P < 0.001 in METABRIC, log-rank test; Figure 4D).
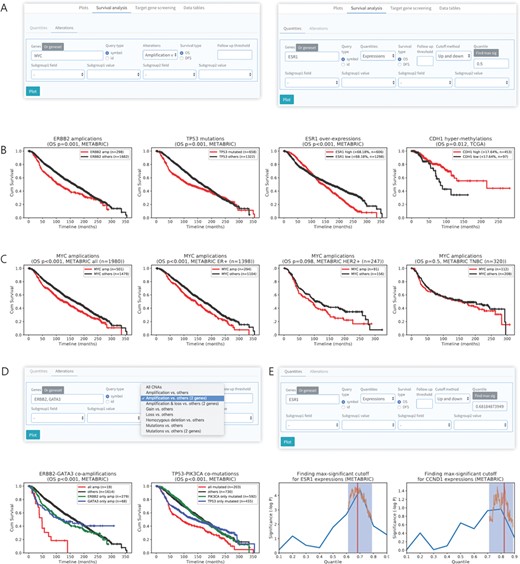
Survival analysis based on multi-omics data analysis. (A) User interface for survival analysis by genetic alterations (left) and quantities (right). (B) Survival analysis on METABRIC or TCGA data set of breast cancer patients by various genetic aberrations including gene amplification (ERBB2), mutation (TP53), overexpression (ESR1) and DNA hypermethylation (CDH1). (C) Survival analysis curves for different subtypes of breast cancers according to MYC amplification. (D) Survival analysis of breast cancer patients in combined groups of two genes with genetic alterations. An example of co-amplification (left) and co-mutations (right) that exhibit synergistic effect on survival outcome is shown. (E) Method for finding max-significant cutoff for survival analysis by gene expression. The blue boxes and orange lines indicate significant regions found sparsely and cutoff point in the region, respectively.

Gene set-based analysis. (A) User interface for selection of gene set by function of ‘Gene set’. (B) Box plots for differential quantities by gene set. (C) Scatter plots for correlation between two gene sets. (D) Survival analysis on METABRIC data set of breast cancer patients by a specific gene set.
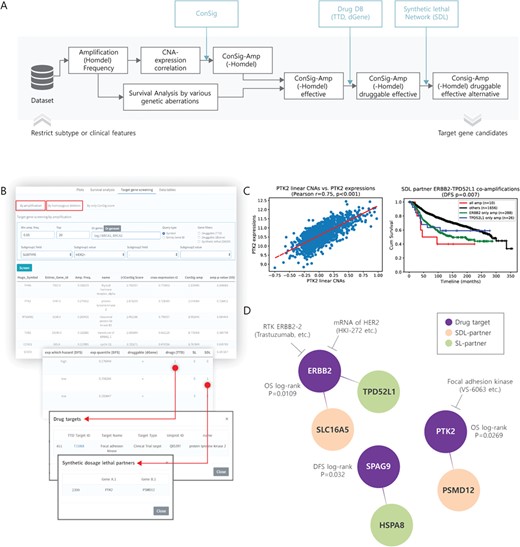
Target gene screening for amplification. (A) A pipeline diagram for screening of cancer target genes with amplification or homozygous deletion. (B) User interface (minimum amplification frequency, >5%; top 20 genes; HER2+ subtype) and the result of finding amplification target candidates in METABRIC. (C) Correlation between CNAs and expressions of nominated target PTK2 (left) and the effect of SDL partner ERBB2–TPD52L1 co-amplification on the OS of HER2+ breast cancer patients (right). (D) Drugs and SDL partners are presented for nominated target genes with amplification.
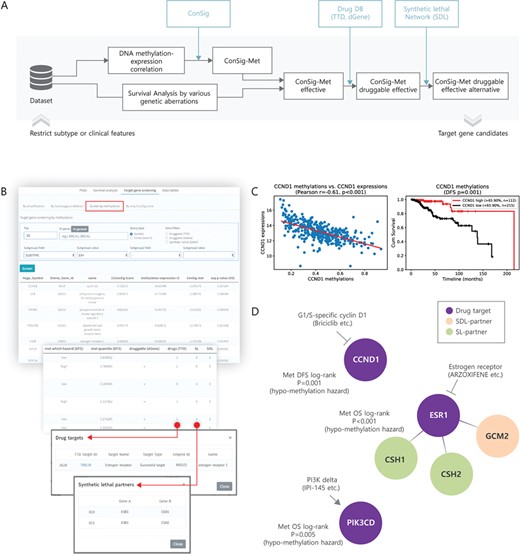
Target gene screening for DNA methylation. (A) A pipeline diagram for screening of cancer target genes with DNA methylation. (B) User interface (top 20 genes; ER+ subtype) and the result of finding DNA methylation target candidates in TCGA. (C) Correlation between methylation and expression of nominated target CCND1 (left) and the effect of CCND1 methylation on the DFS of ER+ breast cancer patients (right). (D) Drugs and SL/SDL partners are presented for the nominated target genes with DNA methylation.
Apart from identifying single-gene effects provided by similar tools, the gene set-based differential quantity, correlation and survival analysis in CTGS facilitates the confirmation of biological functions and the complex effects of genes associated with a certain genetic aberration in specific subtypes or clinical features.
Target gene screening based on CNAs
To determine cancer driver genes dominantly acting in a specific subtype or the clinical condition of human breast cancer, it is necessary to screen the clinically and biologically significant genes at the genome-wide scale in the customized subgroups. However, current web-based tools do not support this function. We therefore implemented the user-friendly genome-wide target gene screening system to CTGS, based on the status of gene expression, amplification and DNA methylation. Furthermore, to sort the cancer-related genetic alterations with biologically significant functions among the candidates, the ConSig score was linked to the target screening system. The ConSig score prioritizes genes of biological importance according to the strength of association with those cancer-related features [38]. ConSig-Amp, which is calculated by multiplying ConSig by the correlation between gene expression and copy number [22], has been recently reported to be an indicator for determining the biological significance of gene amplification in human cancer. However, this concept does not reflect the clinical significance of each gene. For the comprehensive discovery of cancer target genes of both clinical and biological significance, CTGS ranks candidate genes according to their significance in the patient survival analysis and the Consig scores using genome-wide screening (Figure 5A). In addition, two drug databases, TTD and dGene [34, 36], and the DAISY synthetic lethality network [37] were connected to CTGS with the aim of informing users of existing drugs and partners of SL or SDL for candidate target genes. Researchers can explore breast cancer target genes within the boundaries of a customized setting and rank them according to several factors of interest, including amplification frequency, ConSig-Amp score and P-values of survival analyses (Figure 5B). When screening the putative amplified target genes for HER2+ breast cancer in the METABRIC using this interface, PTK2 (ConSig-Amp 2.074, OS P = 0.027, log-rank test) and ERBB2 (ConSig-Amp 1.725, OS P = 0.011, log-rank test) were among the top ranked genes, with an amplification frequency >5% (Supplementary Data Table S3), and their alternative SL partners were identified. In the page of ‘Correlations’ and ‘Survival analysis’ of CTGS, we also confirmed the positive correlation between PTK2 expression and its copy numbers (R = 0.75) and determined that the co-amplification of ERBB2 and its SDL partner, TPD52L1, indicated poor prognosis in breast cancer (DFS P = 0.007, log-rank test; Figure 5C). The identified target genes with high levels of amplification in the HER2+ subtype, along with information on their potential drugs and alternative targets, are schematically illustrated in Figure 5D. In addition to amplified target genes for HER2+ subtype, other subtype-specific amplification target candidates based on ConSig-Amp, such as CCND1, TLK2 and PAK1 genes in ER+ subtype and EGFR, IKBKB and STK3 genes in TNBC, are presented in Supplementary Data Table S3. Consistent with the results from a previous report [22], TLK2 was nominated as a druggable target gene for ER+ breast cancer in the CTGS (Supplementary Data Table S3). The collective data indicate that this screening method can contribute to the identification of potential amplification therapeutic targets for specific subtypes or clinical features. In a similar way, CTGS also supplies a function of target gene screening system based on homozygous deletions (Figure 5A).
Target gene screening based on DNA methylation
Aberrant DNA methylation, such as the hypomethylation of oncogenes or the hypermethylation of tumor suppressors, is one of the important epigenetic changes that affect cancer progression [44]. Since there are many therapeutic agents for targeting DNA methylation, a gene altered by DNA methylation could be a potential target for epigenetic therapy in human cancer [45]. Considering the significance of aberrations in the process of DNA methylation in human cancer, we designed the ConSig-Met score, which combines cancer relatedness (ConSig) with DNA methylation–gene expression correlation, with a concept similar to ConSig-Amp, in order to detect target genes associated with DNA methylation, using the DNA methylation data from TCGA (Figure 6A). In the TCGA ER+ subtype, CCND1 (ConSig-Met −2.354, Met DFS P = 0.001, log-rank test), ESR1 (ConSig-Met −2.137, Met OS P < 0.001, log-rank test), and STAT5A (ConSig-Met −2.043, Met DFS P = 0.002, log-rank test) were identified as DNA methylation targets (Figure 6B). STAT5A was inferred to be a tumor suppressor because the low expression group was found to be a high-risk group, while CCND1 was inferred to be an oncogene because of its overexpression and since the hypomethylation group was a high-risk group. Expression of CCND1 was reverse-correlated with DNA methylation (R = −0.61), and the hypomethylation of CCND1 was significantly associated with poor prognosis in terms of DFS (P = 0.001, log-rank test; Figure 6C). Examples of identified DNA methylation targets, drugs and alternative targets in the ER+ subtype are illustrated in Figure 6D. Subtype-specific DNA methylation target candidates based on ConSig-Met are presented in Supplementary Data Table S4. Potential therapeutic targets based on aberrant DNA methylation for specific subtypes can also be identified by this method.
Cross-validation of a screening method to predict target genes
Using the target gene screening tool in CTGS, we discovered subtype-specific, target-amplified or DNA-methylated genes from the multi-omics data sets (Supplementary Data Tables S3 and S4). To verify whether the results of the target gene screening are similar between multi-omics data sets, we identified candidate target genes for amplification by subtypes in the TCGA and METABRIC (amplification frequency >5%; ConSig-Amp top 20 genes) and compared the results of these two data sets. Among the amplification target candidates in the TCGA, ~40% of the genes were also included in the METABRIC (Supplementary Data Table S5–S7). The PTK2 gene was identified as a significant candidate in both the ER+ and HER2+ subtypes. The clinical significance of the amplification of YWHAZ was particularly striking in the ER+ subtype. This result was consistent with previous reports showing that the amplification of YWHAZ is associated with chemotherapy resistance and recurrence [46] (Supplementary Data Table S5). PTK2 and TOB1 were predicted as therapeutic targets for the HER2+ subtype (Supplementary Data Table S6). In TNBC, WHSC1L1 is a histone methyltransferase that is associated with a poor prognosis in the basal subtype [47]. WHSC1L1 was also identified as a potential amplification target for TNBC (Supplementary Data Table S7).
The collective data indicate that CTGS can be effectively utilized for identifying common target candidates among breast cancer multi-omics data sets, in the search of promising therapeutic targets or prognostic markers in human breast cancer.
Discussion
CTGS comprises systematized breast cancer multi-omics data that facilitate target gene screening for a particular subtype or clinical features by estimating differential quantities, correlations and survival and functional outcomes. Through CTGS, cancer genomic researchers can identify target gene candidates for specific subtypes and validate therapeutic effects. Clinicians can resort to CTGS for the development of therapeutic strategies based on genetic aberrations in patients.
The multi-omics data set architecture of CTGS provides a flexible and dynamic computational environment. The easy-to-use extension of the CTGS allows the new publicly available data sets to be easily updated in the platform. Furthermore, the memory cached data structure on the CTGS makes it possible to analyze on a genome-wide level and to generate results in real-time. The advantage of CTGS compared with other existing tools is its ease of access to further improved data analysis. Most integrated analytical tools for cancer genomics, such as cBioPortal and BCIP, only provide results for queried genes [26, 27], whereas the efficient data structure of CTGS makes it possible to screen genes at the genome-wide level in real-time. Currently available survival analysis tools, such as KM plotter [30], SurvExpress [48], PrognoScan [49], bc-GenExMiner [50] and GeneSurv [51], provide results only by differential gene expression levels. In contrast, CTGS has a survival analysis function based on single or combined genetic aberrations, such as gene amplifications, deletions, mutations and hypermethylations, for customized subgroups with several clinical features of interest, enabling the interpretation of the clinical implications of the genetic alterations exhibited by a specific subgroup of breast cancer patients. In addition, most current tools allow the query of a single gene, while CTGS is able to input multiple genes into all analysis functions, including differential quantities, and correlation and survival analysis, thus allowing the simultaneous confirmation of the effect of multiple genes. Furthermore, query for gene sets makes it possible to analyze specific biological functions. These benefits of the multi-omics data structure will support the broad understanding of clinical features and biological functions.
The ConSig cancer-gene relatedness score provides a weight for cancer progression and can be combined with other layers of multi-omics, such as ConSig-Amp. Presently, ConSig-Amp was changed by subgrouping and nominated different targets for the subgroup. SL and SDL partners can also provide alternative and combinational treatment targets. One of the important features of CTGS is the ability to perform genome-wide target gene screening in real time, which allows researchers to easily screen cancer-related target genes. Furthermore, by linking ConSig score to the survival outcome of patients, the existing limitation of ConSig-Amp (i.e. clinical implications not considered) was improved. This function could be performed by specifying subtypes or clinical features. The correlation of CNAs–expressions may not be high in the entire group of patients, but rather only in a specific subgroup. Thus, by correlating CNAs–expressions with subgroups, the ranking of candidates can be changed, and new subgroup-specific targets can be suggested. We also provided a ConSig-Met score, which combines the ConSig score and the DNA methylation status of each gene to screen for clinically and biologically important cancer-related epigenetic silencing. Aberrant DNA methylation of tumor suppressors or oncogenes is one of the most important epigenetic features causing cancer progression. In breast cancer, promoter hypermethylation has been reported for genes involved in cell-cycle regulation, DNA repair, apoptosis and cell adhesion. In addition, genome-wide hypomethylation is a common feature of breast tumors and it frequently occurs in regions of segmental duplications. The intense interest of epigenetics in the identification of therapeutic targets stems from the fact that, unlike gene alterations, aberrant hypermethylation is reversible [44]. Genes that are strongly reverse-correlated with DNA methylation and expression can be expected to contribute to cancer progression [52]. Therefore, ConSig-Met could be an effective method for the screening of cancer target genes. Drug data and SL partners can be displayed for all target candidate genes, and researchers can use them as reference information to confirm the applicability of each candidate.
Many cancer genomic researchers seek to identify a target gene for a particular subtype. This target gene may be either a direct therapeutic target or a prognostic marker. Depending on the nature of heterogeneous cancer, the target gene may be different for each subtype or more detailed classification. Multi-omics data, including clinical information, can be an important resource in the identification of novel therapeutic targets and can narrow the list of candidates through various data analyses. Based on the multi-omics data analysis, CTGS represents a useful tool in the identification of candidates for target genes involved in different breast cancer subtypes.
CTGS is a user-friendly web application that allows researchers and clinicians to interpret the clinical implications of genomic/epigenomic alterations and to find novel therapeutic targets from the analysis of breast cancer multi-omics data.
Compared with other currently available web tools, CTGS provides a wider variety of advanced functions for the analysis of genomic aberrations, differential gene expression profiles, gene–gene correlations and survival outcomes.
CTGS supports genome-wide screening of cancer target genes in a customized subgroup of breast cancer patients that identifies potential druggable candidates based on clinical and biological parameters by integrating cancer-relatedness scores, information from the TTD, dGene and synthetic lethality from DAISY.
Funding
National Research Foundation of Korea (2015R1A2A1A10052578).
Hyung-Yong Kim is a PhD candidate at the Department of Pathology, College of Medicine, Hanyang University. He has been working in the field of bioinformatics.
Hee-Joo Choi is a postdoctoral researcher at the Department of Pathology, College of Medicine, Hanyang University. She has been working in the field of functional genomics.
Jeong-Yeon Lee is an associate professor at the Department of Medicine, College of Medicine, Hanyang University. Her research focuses on discovering new therapeutics and diagnostics of breast cancer.
Gu Kong is a professor at the Department of Pathology, College of Medicine, Hanyang University. His main areas of research include cancer genomics, oncology, molecular pathology and bioinformatics.
References
