


Abstract
Synthetic viability, which is defined as the combination of gene alterations that can rescue the lethal effects of a single gene alteration, may represent a mechanism by which cancer cells resist targeted drugs. Approaches to detect synthetic viable (SV) interactions in cancer genome to investigate drug resistance are still scarce. Here, we present a computational method to detect synthetic viability-induced drug resistance (SVDR) by integrating the multidimensional data sets, including copy number alteration, whole-exome mutation, expression profile and clinical data. SVDR comprehensively characterized the landscape of SV interactions across 8580 tumors in 32 cancer types by integrating The Cancer Genome Atlas data, small hairpin RNA-based functional experimental data and yeast genetic interaction data. We revealed that the SV interactions are favorable to cells and can predict clinical prognosis for cancer patients, which were robustly observed in an independent data set. By integrating the cancer pharmacogenomics data sets from Cancer Cell Line Encyclopedia (CCLE) and Broad Cancer Therapeutics Response Portal, we have demonstrated that SVDR enables drug resistance prediction and exhibits high reliability between two databases. To our knowledge, SVDR is the first genome-scale data-driven approach for the identification of SV interactions related to drug resistance in cancer cells. This data-driven approach lays the foundation for identifying the genomic markers to predict drug resistance and successfully infers the potential drug combination for anti-cancer therapy.
Introduction
Cancer is a genetic disease caused by gene alterations. Accumulating evidence has revealed that the cancer can be better decoded in the context of interactions among those genetic lesions [1]. According to the consequences of the combinational gene alterations, the genetic interactions can be defined as synthetic lethal (SL) interactions and synthetic viable (SV) interactions, suggesting the co-occurrence of the genetic alterations has greater or lesser impact than their individual effects [2]. SL interactions refer to a gene interaction in which single-gene defects are compatible with cell viability but the combination of gene effects results in cell death, and these interactions have been applied to the discovery of targeted drugs for cancer [3, 4]. A well-known example is that ovarian cancer patients with a mutation of BRCA1 (BRCA2) have priority to use PARP inhibitors because of the SL interaction between BRCA1 (BRCA2) and PARP [5].
On the other hand, SV interactions have recently been documented to play an important role in caner progression and therapy [6]. SV interactions are defined as a combination of alterations in two genes that can rescue the lethal effects of the individual gene alterations [2] (Figure 1A). For example, a loss of VHL function normally causes cellular senescence; however, the inactivation of the second tumor suppressor RB can reverse this process. A loss of BRCA1 or BRCA2 tumor suppressor gene triggers cell-cycle arrest at the G2/M checkpoint, which can be reversed by the inactivation of TP53. In these scenarios, the second gene alteration functionally buffers and reduces the deleterious effects of VHL loss or BRCA dysfunction, thereby allowing the cell to survive, although with a modified phenotype.

Schematic diagram of the SV gene pairs related to drug resistance and the workflow. (A) SV interactions occur when a combination of gene alterations induces greater cell viability than a single gene alteration. (B) SV between gene pairs induces drug resistance. There is an SV interaction between genes G1 and G2. When treated with drugs targeting the gene G1, the cancer cells without alterations in gene G2 are sensitive to the targeted drug, whereas the cancer cells with alterations in gene G2 are resistant to the targeted drug because of the activated SV effect. (C) Workflow of this work. SV, synthetic viable; SCNA, somatic copy number alteration. A colour version of this figure is available online at BIB online: https://dbpia.nl.go.kr/bib.
Besides providing insights in tumorigenesis, the SV interaction can play an important role in tumor treatment. In many cases, the occurrence of additional genetic alterations in the cancer cell will render the cancer cell drug resistance by either activating the compensatory/downstream pathways [7] or suppressing inhibitory pathways [8]. It is well-documented that the increased expression of MAP3K8, a MAPK pathway agonist, drives resistance to the BRAF inhibitor PLX4720 in melanoma cells by activating extracellular signal-regulated kinases, primarily through MEK-dependent mechanisms that do not require BRAF signals [7]. Cancer cells obtain resistance to PARP inhibitors because of the correction of defective homologous recombination repair, through either a loss of 53BP1 [9, 10] or a loss of REV7 pathways [8]. Here, the loss of 53BP1 exerts an SV effect with the inhibition of PARP on BRCA mutant cancer cells [6]. Ding et al. demonstrated that loss of BRCA2 after the inhibition of PARP contributed to the synthetic viability of cancer cells [11]. Thus, comprehensively characterizing the SV interactions in cancer cells is critical to elucidate the molecular mechanisms underlying the resistance of cancer cells to therapy. However, computational approaches developed to systematically study SV interactions in cancer genome are currently not available.
The Cancer Genome Atlas (TCGA) data, small hairpin RNA (shRNA)-based functional examination data sets, model organism genetic interaction data, as well as large-scale pharmacogenomic profiles provide an unprecedented opportunity to investigate the SV interactions related to drug resistance across cancers. In this study, we hypothesized that if a cancer cell bears a gene alteration that exhibits an SV interaction with a cancer drug target gene, this gene alteration can functionally buffer the anti-cancer effects of the targeted drug (Figure 1B). In this regard, we integrated the genomic data (somatic mutations and copy number alterations) of 32 cancer types from TCGA data, shRNA data and yeast genetic interactions to identify candidate SV interactions in cancer genome. We showed that genome-wide SV interactions in cancer cells can successfully predict the drug response by using the drug response data from the cell lines and clinical prognosis in the independent tissue sample data set.
Materials and methods
Identification of SV interactions
We identified candidate SV interactions by applying three separate statistical inference procedures. Each procedure has its own input and subsequently generates a set of candidate SV pairs. The three inference procedures are described below.
(i) TCGA co-alteration procedure
Somatic mutations of 32 cancer types were obtained from TCGA (http://cancergenome.nih.gov/tcga; Supplementary Table S1; Supplementary Figure S1). Significant somatic mutations were identified via the MutSig algorithm [12]. Copy number alterations were downloaded from TCGA Firehose (http://gdac.broadinstitute.org/) and processed by Genomic Identification of Significant Targets in Cancer (GISTIC) [13]. Pearson's correlation test was used to select genes with a positive correlation coefficient between the copy number and expression level. The P values were subjected to a Benjamini and Hochberg (BH) correction for multiple tests, and the false discovery rate (FDR) was controlled with <0.05. The log2 ratio cutoff values > 0.25 and <−0.25 were used to detect the amplifications or deletions (somatic copy number alteration, SCNA) for each gene in each sample, respectively [13].
An alteration profile of 32 cancer types was constructed. The columns of the alteration profile represent the samples, and the rows represent the altered genes. If a gene was detected with alterations (non-synonymous somatic mutation or SCNA) in a sample, we set the profile to 1. Otherwise, the profile was set to 0. The alteration profile included 14 284 genes and 8580 samples. The samples were simultaneously screened to detect somatic mutations, copy number alterations and mRNA expression. Only gene pairs that were distributed in different SCNA regions were tested the probability of co-occurring alterations in cancer patients.
The ‘hypergeometric test’ P-value (TCGAP-value) was subjected to a BH correction for multiple tests. The gene pairs with FDR < 0.05 were selected for the following analysis.
Then, we applied a permutation strategy to control for the alteration heterogeneity within and across tumor samples to filter co-alteration pairs. We used the permatswap function in the R package vegan (http://vegan.r-forge.r-project.org/) to produce permutated genomic alteration matrices that maintain the total number of alterations for each gene across samples as well as the total number of alterations per sample. A total of 10 000 permutations were performed, and the proportion of permutations in which the observed co-occurrence was higher than in the real data was taken as an empirical P value. The empirical P value was subjected to a BH correction for multiple tests and the gene pairs with FDR < 0.05 were selected as co-alteration pairs.
(ii) shRNA-based examination procedure
shRNA data were obtained from The Project Achilles database, which consists of shRNA depletion scores from a pooled genomic library tests across 165 cancer cell lines (http://www.broadinstitute.org/achilles/datasets/all; Supplementary Table S1; Supplementary Figure S2A). Copy number data and mutation data of the cell lines were obtained from the Cancer Cell Line Encyclopedia [14]. Genomic alterations of the cell lines were processed as described for the first procedure.
For each pair of genes G1 and G2 within the cells with knock-down of G1, a one-sided Wilcoxon rank sum test was conducted to examine whether the samples with alterations of G2 had significantly higher shRNA scores than those of the samples without alterations of G2. Higher shRNA scores indicated enhanced cell survival. The P-value (shRNAP-value) was subjected to a BH correction for multiple tests, and gene pairs with FDR < 0.05 were included for the following analysis.
(iii) Comparative genomic procedure
Costanzo et al. have reported a large-scale data set of yeast genetic interactions [15]. Several SL interactions related to cancer cells have been mapped by Deshpande et al. [16]. We used the cutoff of ɛ > 0.08 with P < 0.05 (yeastP-value) to select yeast SV interactions. Here, ɛ is a measure of genetic interaction strength [15]. A negative ɛ indicates a decrease in cell fitness, whereas a positive ɛ indicates an increase in cell fitness. InParanoid 7 was used to map the yeast genes to human genes [17]. Only 1:1 orthologs were used in our study.
Identifying SV interactions related to drug resistance
To identify the SV interactions that could predict the response of cancer cell lines to various drugs, we used data from the CCLE [14] and Broad Cancer Therapeutics Response Portal (CTRP, http://www.broadinstitute.org/ctrp/) pharmacological screens.
The CCLE data set used in this study includes the half maximal inhibitory concentration values (IC50) of 24 anti-cancer compounds across 446 cancer cell lines derived from 23 cancer types (Supplementary Figure S2B). The Broad CTRP data contained the area under the curve (AUC; the AUC in a plot of drug concentration in blood plasma against time) for 203 small molecules in 229 cancer cell lines representing 19 cancer types (Supplementary Figure S2C).
For each drug targeting G1and the corresponding partner gene G2, we tested the difference of IC50 or AUC between the cell lines with or without alterations in G2 by using a one-sided Wilcoxon rank sum test according to the hypothesis presented in Figure 1B. The Wilcoxon rank sum P-value was subjected to a BH correction for multiple tests.
Network visualization and analysis
The SV interactions related to drug resistance were assembled into a network in which nodes represented genes, and edges represented their SV interactions. Cytoscape software was used to visualize the network [18]. A hypergeometric distribution model was used to test whether biological pathways from the Kyoto Encyclopedia of Genes and Genomes (KEGG) database [19] were significantly enriched in the network genes by controlling the FDR < 0.05. We then examined the distribution of the genomic location of SV interaction genes by using Circos [20]. We downloaded the protein interaction network version released in March 2015 from the Pathway Commons database [21] (http://www.pathwaycommons.org/pc2/). The protein interaction network used in our work consisted of 18 851 genes and 2 400 467 interactions. The biological processes of Gene Ontology (GO) were downloaded from http://geneontology.org/page/downloads.
Prognosis analysis
We analyzed the SCNA profiles of 1993 breast cancer samples from Molecular Taxonomy of Breast Cancer International Consortium (METABRIC) [22] to examine the prognostic value embedded in the SV network. We selected samples without treatment after surgery and disregarded samples that presented ambiguous or unknown survival statuses. In total, 266 breast cancer samples were included in the following analysis. For each patient, we counted the number of activated SV pairs that the patient carried. Here, the activated SV pair refers to the co-alteration of two genes with an SV interaction relationship. Thus, patients with a greater number of activated SV pairs would present a poorer prognosis. The log-rank test was used to assess whether disease-specific survival was significantly different between the two groups of patients with and without activated SV pairs, and Kaplan–Meier plots were used to represent the results. Cox proportional hazard models were used for univariate and multivariate survival analyses. An analysis of variance (ANOVA) was used to analyze relationship between SV interactions and the cancer grade as well as cancer subtype.
Results
Characterization of SV interactions landscape in the cancer genome
Synthetic viability-induced drug resistance (SVDR) is an approach to statistically infer drug resistance-relevant SV interactions from cancer genomic data obtained from clinical samples and cell lines. The SVDR method included three statistical inference procedures, each of which was tailored to specific data sets (Figure 1C). The first inference strategy was based on the observation that co-alteration between genes is a comprehensive phenomenon in the cancer genome. We hypothesized that certain co-occurring alterations provide selective advantages for cancer cells under selective pressure during tumor evolution, similarly to the principle of synthetic viability of genetic interactions [2]. Thus, we identified candidate SV interactions by detecting gene pairs with co-alterations that occur significantly more than expected. The second inference strategy, shRNA examination, was based on the notion that the knock-down of one gene is favorable for cancer cells with alterations in another gene. The SV pairs of a given knocked-down gene were detected by searching for genes whose alterations might be beneficial for cancer cells. This search was conducted via an analysis of the data sets of shRNA screens in cancer cell lines accompanied by their SCNA and mutation profiles. The third procedure was based on the strategy that putative SV interactions in human might be inferred on the basis of yeast positive genetic interactions between conserved genes in yeast and humans [15]. By applying SVDR to the genomic alterations (SCNA and somatic mutation) of 8580 samples of 32 cancers from TCGA, the shRNA data for 165 cancer cell lines from Achilles and a yeast data set (Supplementary Table S1; Supplementary Figures S1 and S2), a total of 22 084 946 co-alteration pairs and 429 495 and 25 209 candidate SV pairs were separately identified in the three procedures. Of these, 55 726 pairs were predicted to be SV pairs (Figure 2A). The results of Figure 2A are available on http://210.46.80.146/SVInteraction/. Here, the SV pairs for cancer cells were defined as gene pairs that were identified in at least two inference procedures with a significant combined P-value (FDR < 0.05) (see ‘Methods’ section).
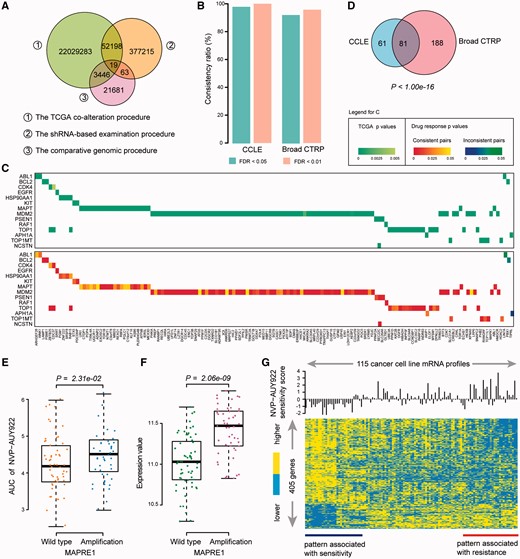
Statistics of SV interactions related to drug resistance. (A) Overlap of the SV interactions detected from three different procedures. (B) Consistency ratio of SV interactions related to drug resistance. At FDR < 0.05 or FDR < 0.01, the consistency ratio is presented for the CCLE (left) and Broad CTRP (right) data sets. (C) The significance of co-occurrence (top) and drug response (bottom) of SV pairs identified in CCLE. Rows of the heatmaps denote drug target genes, and columns denote partner genes. (D) Overlap of SV interactions-related drug resistance between the CCLE and Broad CTRP. The P value was calculated by hypergeometric test. (E) Cell lines with MAPRE1 alteration are resistant to the HSP90AA1-targeted NVP-AUY922. The difference of AUC between the cell lines with or without alterations in MAPRE1 was tested by one-sided Wilcoxon rank sum test. (F) Amplifications of MAPRE1 showed significantly higher expression level than cell lines with wild type of MAPRE1. The difference between two groups was tested by Student’s t-test. (G) The heatmap of cell cycle gene expression to the sensitivity to NVP-AUY922 inhibition in cancer cell lines, consisting of 405 genes derived by Student’s t-test with P < 0.05. Sensitivity score was defined as that AUC value minus the median value. A colour version of this figure is available online at BIB online: https://dbpia.nl.go.kr/bib.
SV interactions induce drug resistance
To determine whether the SV interactions can lead to drug resistance in cancer treatment, we further integrated the drug response data of the targeted drugs recorded in the CCLE and Broad CTRP databases. Only SV pairs whose partner genes with unique copy number alteration status, either amplification or deletion, were tested here. In total, 12 and 110 drugs in the CCLE and Broad CTRP, respectively, had specific targets in SV pairs based on the drug–target information in the CCLE and DrugBank [23]. For each gene targeted by a particular drug, we tested whether the drug response measures (IC50 or AUC) were significantly different between the cell lines with and without alterations of the partner gene in the SV pair. The SV pairs that were associated with significantly ‘higher’ IC50 (or AUC) values in the cell lines compared with those without the partner genes alteration were defined as consistent pairs. In this way, we can calculate a consistency ratio, which is the percentage of consistent pairs relative to all SV pairs with significant drug response differences. With a cutoff of FDR < 0.05, 159 and 376 significant SV pairs were obtained from the CCLE and Broad CTRP databases, respectively (Supplementary Tables S2 and S3). The consistency ratio was 98.11% and 92.29% for the CCLE and Broad CTRP, respectively (Figure 2B). With a cutoff of FDR < 0.01, the consistency ratio was as high as 100% and 95.73% for the CCLE and Broad CTRP, respectively (Figure 2B). The 159 significant SV pairs derived from CCLE contains 14 drug targets (rows in Figure 2C) and 141 partner genes (columns in Figure 2C). The upper part of Figure 2C shows the significance of co-occurring alterations between genes in cancer samples from TCGA, and the lower part of Figure 2C displays the significance of drug response of the SV pairs in the CCLE database. In the lower part of Figure 2C, the heatmap shows the P value of consistent and inconsistent SV pairs. These observations suggest that SV pairs could be used to detect the genomic alterations that induce drug resistance and the high reliability of the SVDR. We observed similar results using the Broad CTRP database (Supplementary Figures S3 and S4).
In total, 81 SV pairs related to drug resistance overlapped between the CCLE and Broad CTRP, which could not have occurred by chance (P < 1.0 × 10⁻¹⁶, Hypergeometric test, Figure 2D). By integrating the results from the CCLE and Broad CTRP, 330 SV interactions were significantly associated with drug resistance. Certain SV interactions related to drug resistance have been demonstrated in other studies. An example is SV pair between HSP90AA1 and MAPRE1. The cell lines with amplifications of MAPRE1 showed significantly higher AUC than those without amplifications of MAPRE1 (P = 2.31 × 10⁻², one-sided Wilcoxon rank sum test, Figure 2E) and the cell lines with amplification of MAPRE1 showed significantly higher expression level than those with MAPRE1 wild type (P = 2.06 × 10⁻⁹, Student’s t-test, Figure 2F) in the database of Broad CTRP. We inferred that amplification (upregulation) of MAPRE1 could induce resistance of HSP90AA1-targeted NVP-AUY922. The possible mechanism maybe that those partner genes are potential oncogenes and the amplification of those partner genes could confer growth advantages for tumor cells. Liu et al. reported that MAPRE1 acts as an oncogene to promote cellular growth and inhibit apoptosis of cells on cisplatin [24]. Focusing on the pathways that the MAPRE1 participates in, we found that 405 genes in cell cycle pathway (GO: 0007049) showed distinct expression levels among the 115 cancer cell lines with patterns of resistance and sensitivity to the drug NVP-AUY922 (Figure 2G). Moreover, the genes CHMP4B and CDK5RAP1 participating in cell cycle process were significantly upregulated in the MAPRE1 amplified cell lines and have been reported to associate with resistance to drug doxorubicin and platinum, respectively (see Supplementary Results, Supplementary Figure S5).
Drug resistance-related SV network shows biological characteristics
By integrating the SV pairs that were significantly related to drug resistance according to the CCLE and Broad CTRP databases, we constructed an SV interaction network (Figure 3A) that consisted of 337 genes and 330 target–partner gene interactions. In Figure 3A, for each SV pair, alterations of the partner genes (oval nodes) induce cancer cell resistance to the drug that targets the target genes (rectangle nodes). The SV network showed the scale-free property (R2 = 0.9993, Figure 3B). By examining the genomic location of the target and partner gene within each SV pair, we found that 87.88% of SV pairs resided on different chromosomes (Figure 3C). The SV interactions tended to closely associated with each other in the network and participate in similar biological processes. We randomly selected the same number of gene pairs from the alteration profile of 32 cancer types as a random SV network and counted the number of one- or two-step interactions overlapped with the human gene interaction network. This process was performed 1000 times, and the empirical P value was calculated. We found that 79.09% (261 pairs) of the 330 SV pairs had either one- or two-step interactions in the human gene interaction network, a result that could not be observed by chance (P < 1.0 × 10⁻³, 111 pairs expected). We next sought to determine whether the partner genes (oval nodes) in the network can promote cancer cell proliferation. Briefly, the cancer proliferation index for each gene was quantified by calculating the association between the gene expression levels and growth rates across 60 cancer cell lines [25]. Interestingly, partner genes of drug targets were more closely associated with cancer cell proliferation than genes that were not in the network (P = 6.60 × 10⁻³, Student’s t-test, Figure 3D). Moreover, we found that interference of partner genes influenced many important phenotype changes or diseases in mouse, such as growth, aging, immune and neoplasm (Supplementary Figure S6).
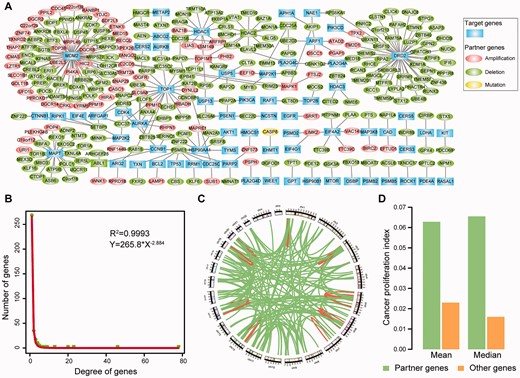
(A) SV network related to drug resistance. Each node denotes a gene: a drug target (rectangle nodes) or an SV partner gene (oval nodes) of a drug target. The detail information of alteration state of the partner genes in TCGA are recorded in the Supplementary Tables S2 and S3. (B) Distribution of the degree of genes in the SV network. (C) Genomic distance between SV pairs. Each region along the circle represents one of the 24 chromosomes. Each edge denotes an SV interaction. (D) Cancer proliferation index of partner genes and other genes. Here, other genes denote the genes that are not in the SV network. A colour version of this figure is available online at BIB online: https://dbpia.nl.go.kr/bib.
With FDR < 0.05, 35 KEGG pathways were significantly enriched with genes in the SV pairs (Figure 4A), including many cancer-related signal pathways, such as the cell cycle (P = 7.15 × 10⁻⁶, hypergeometric test), mTOR signaling (P = 1.07 × 10⁻⁵, hypergeometric test), PI3K-Akt signaling (P = 1.59 × 10⁻⁴, hypergeometric test), apoptosis (P = 9.15 × 10⁻⁴, hypergeometric test) and TNF signaling pathways (P = 1.22 × 10⁻³, hypergeometric test).
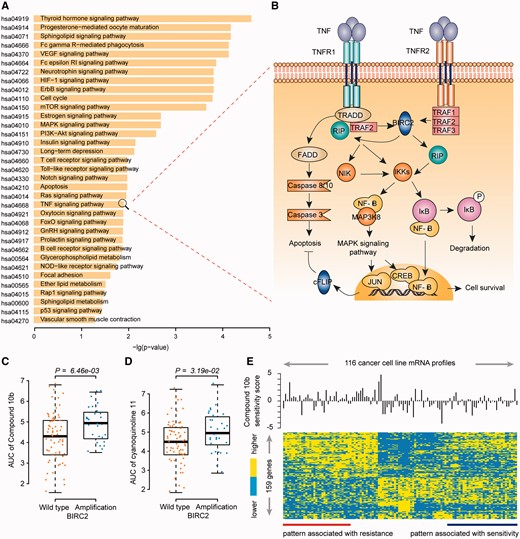
Functional analysis of drug resistance-related SV interaction genes. (A) KEGG pathways enriched with genes in the SV network. Functional enrichment analysis was performed using hypergeometric test. (B) SV pair of MAP3K8 and BIRC2 participates in the TNF signaling pathway. A detailed description of this pathway is available in the Supplementary materials. (C) and (D) Cell lines with BIRC2 alteration are resistant to the MAP3K8-targeted Compound 10b (C) and cyanoquinoline 11 (D). The difference of AUC between the cell lines with or without alterations in BIRC2 was tested by one-sided Wilcoxon rank sum test. (E) The heatmap of programmed cell death gene expression to the sensitivity to compound 10b in cancer cell lines, consisting of 159 genes derived by Student’s t-test with P < 0.05. Sensitivity score was defined as that AUC value minus the median value. A colour version of this figure is available online at BIB online: https://dbpia.nl.go.kr/bib.
SV interactions involved in drug resistance are functionally buffering
The above results showed that genes with SV interactions tended to interact with each other in the protein–protein interaction network, thus indicating that two genes with an SV effect might be functionally related and SV interactions might buffer the lethal effects of a target drug through a compensatory change in the related signal transduction pathways. For example, the deletion of MAP3K8 and amplification of BIRC2 exhibited a significant SV relationship (AllP-value = 7.62 × 10⁻⁴, Fisher's combined probability test). Both of MAP3K8 and BIRC2 participated in the TNF signaling pathway (Figure 4B). MAP3K8 has been suggested to enhance tumor growth and metastatic progression via the activation of MAP kinases and NF-κB signaling pathways, and the inhibition of MAP3K8 is deleterious to tumor cells [26]. BIRC2 not only inhibits apoptosis but also modulates mitogenic kinase signaling and participates in cell proliferation, cell invasion and metastasis [27]. Here, we found that amplification of BIRC2 induced resistance to two drugs that target MAP3K8 (P = 6.46 × 10⁻³ for compound 10b, one-sided Wilcoxon rank sum test, Figure 4C;P = 3.19 × 10⁻² for cyanoquinoline 11, one-sided Wilcoxon rank sum test, Figure 4D). The over-expression of BIRC2 has been documented to be associated with resistance to cis-platinum and camptothecin in esophageal squamous cell carcinoma [28]. By investigating the expression levels of the genes involving in the regulation of programmed cell death (GO:0043067), totally 159 genes showed distinct expression levels among the 116 cancer cell lines with patterns of resistance and sensitivity to the drug of compound 10b (Figure 4E). This suggests the amplification of BIRC2 may activate another way of inhibiting apoptosis and buffer the detrimental effects of MAP3K8 inactivation.
Patient’s survival deteriorates when multiple SV interactions present
Using an independent data set from METABRIC, we sought to determine whether cancer patients with activated SV interactions (two genes with co-occurring alterations) might have a poorer prognosis than patients without SV interactions because SV interactions confer growth advantage to cancer cells. To role out the impact of chemotherapy, we analyzed the SCNA profiles and survival information for a cohort of 266 breast cancer patients without treatment after surgery (see ‘Methods’ section). In Figure 5A, rows are the 266 breast cancer samples and columns are the 330 SV pairs, where dot denotes the patient carried the activated SV pair. The 226 breast cancer patients were divided into two groups according to the number of activated SV pairs within each patient: none and at least one pair. We found that patients with at least one activated SV gene pair had significantly poorer survival than patients without activated SV pairs (P = 1.47 × 10⁻⁴, log-rank test, Figure 5B). We further hypothesized that patients with a greater number of activated SV gene pairs would present a poorer prognosis and tested the cumulative effect of SV gene pairs in the breast cancer patients. The breast cancer patients were divided into three groups according to tertiles of the number of activated SV pairs within each sample. As expected, the samples with a larger number of activated SV pairs had significantly poorer prognosis than those with a smaller number of SV pairs (P = 7.19 × 10⁻⁵, log-rank test, Figure 5C). After adjusting for other clinical factors, such as age, grade, stage and PAM50 subtypes, the number of SV pairs remained significantly associated with patient disease-specific survival (P = 6.58 × 10⁻³, hazard ratio = 2.44, 95% confidence interval = 1.28–4.66, Supplementary Table S4). Moreover, we also performed prognosis analysis on the TCGA clinical data and acquired the similar results (see Supplementary Results, Supplementary Figure S7 and Supplementary Figure S8).
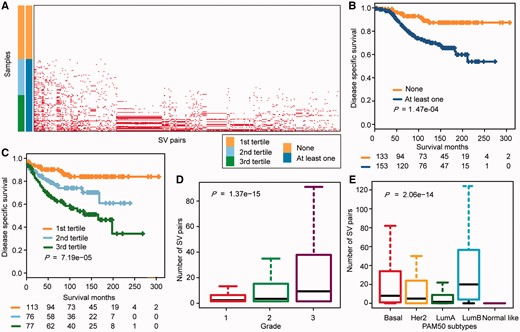
Analysis of the prognosis and clinical factors on the basis of the SV network. (A) Distribution of each activated SV interaction (column) in each breast cancer sample (row). Dot denotes the patient carried the activated SV pair. Samples were separated into two groups based on the number of activated SV interactions that the patient carried: none and at least one pair. Samples were further separated into three groups: the first tertile, the second tertile and the third tertile. (B) Kaplan–Meier plots of the disease-specific survival of breast cancer patients without or with at least one activated SV pair. The differences between the two curves were tested by log-rank test. (C) Kaplan–Meier plots for the disease-specific survival of breast cancer patients among the three breast cancer patient groups. The patients were divided into three groups according to tertiles of the number of activated SV pairs in each patient. The differences between the three curves were tested by log-rank test. (D) and (E) Distribution of the number of SV pairs in each grade (D) and PAM50 subtypes (E). The relationship between SV interactions and the cancer grade as well as PAM50 subtypes were analyzed by ANOVA. A colour version of this figure is available online at BIB online: https://dbpia.nl.go.kr/bib.
Tumor malignancy increases when multiple SV interactions present
To investigate whether tumor malignancy would increase with the number of activated SV pairs in the patient, we analyzed SCNA profiles, tumor grade information and PAM50-subtype data of 1993 breast cancer patients from the METABRIC data set [22]. As expected, the number of SV pairs was positively correlated with the tumor grade (P = 1.37 × 10⁻¹⁵, ANOVA, Figure 5D). Grade-3 tumors had the largest number of SV pairs, whereas grade-1 tumors had the smallest number of SV pairs. In addition, the number of SV pairs was significantly associated with the tumor subtype (P = 2.06 × 10⁻¹⁴, ANOVA, Figure 5E). The number of activated SV pairs was increased in confirmed poorly differentiated subtypes with poor outcomes, such as Basal-like, HER2-enriched and Luminal B tumors [29].
SV interactions suggest potential combinational anti-cancer therapies
Combinational anti-cancer therapy provides a new method for improving therapeutic efficacy. Many partner genes involved in the SV network are related to cancer cell proliferation (Figure 3D) and also act as drug targets, thus indicating that these genes are the best candidates for a combinational target strategy. In total, the partner genes in 22 SV pairs have specific targeted drugs in DrugBank (Supplementary Table S5). Network of potential combinational anti-cancer therapies was constructed in the Figure 6A. Drug capsules targeting partner genes (oval nodes) were predicted to be combinatorially used to anti-cancer with the drug capsules targeting the targets (rectangle nodes). For example, our results showed alteration of ABL1 is a marker of resistance to paclitaxel targeting MAPT (P = 4.86 × 10⁻³, one-sided Wilcoxon rank sum test, Figure 6B). Notably, the combination of nilotinib, which targets ABL1, with paclitaxel exhibited synergistic effects on ovarian cancer cell proliferation and led to the inhibition of cell migration [30] (Figure 6C). Another known combination predicted by our data was HDAC1 (HDAC2) and TOP1MT. TOP1MT alterations induced resistance to HDAC inhibitors (P = 6.57 × 10⁻⁵ for vorinostat, one-sided Wilcoxon rank sum test, Figure 6D;P = 9.51 × 10⁻⁴ for Merck60, one-sided Wilcoxon rank sum test, Figure 6E). It has been reported that HDAC inhibitors synergistically enhance the inhibitory effect of topoisomerase inhibitors suppressing proliferation and inducing apoptosis of tumor cells [31] (Figure 6F). Moreover, He et al. have developed a triple inhibitor that inhibits TOP1, TOP2 and HDAC [32]. Other potential combinations of drugs are presented in Figure 6A and Supplementary Table S5.
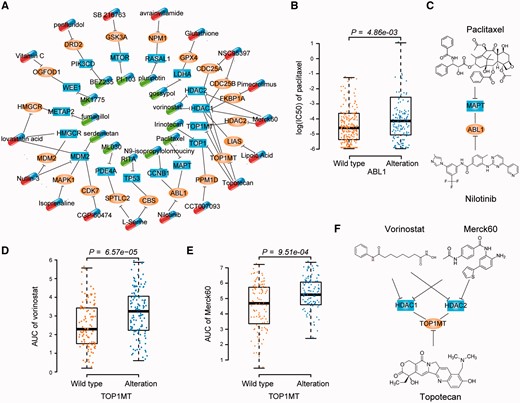
Combinational anti-cancer therapies. (A) Network of potential combinational anti-cancer therapies. Each node denotes a gene. Capsules denote drugs targeting partner genes (oval nodes) and target genes (rectangle nodes), respectively. Each edge without direction represents an SV interaction. Each T line denotes a targeting relationship between a drug and target gene. For clarity, partner genes with one targeted drug are presented. Additional details are presented in Supplementary Table S5. (B) Cell lines with ABL1 alteration are resistant to the MAPT-targeted paclitaxel. The difference of IC50 between the cell lines with or without alterations in ABL1 was tested by one-sided Wilcoxon rank sum test. (C) Combination of paclitaxel targeting MAPT with nilotinib targeting ABL1. (D) and (E) Cell lines with TOP1MT alteration are resistant to the HDAC inhibitors vorinostat (D) and Merck60 (E). The difference of AUC between the cell lines with or without alterations in TOP1MT was tested by one-sided Wilcoxon rank sum test. (F) Combination of HDAC inhibitors with topotecan. A colour version of this figure is available online at BIB online: https://dbpia.nl.go.kr/bib.
Discussion
Numerous studies have focused on identifying gene pairs with significant mutual exclusivity to detect potential targets for cancer therapy [4, 33, 34]. The hypothesis of these studies is that gene pairs exhibiting mutually exclusive alterations may have SL effects in cancer cells. However, the research on the SV interactions and their effect in cancer progression and chemotherapy response is still in its infancy. Our previous studies have revealed that co-occurring alterations in two genes are comprehensive in cancer cells [35, 36]. Certain co-occurring alterations provide a selective advantage for cancer cells under selective pressure during tumor evolution [37]. One scenario for gene co-alterations in cancer genome is that a single alteration might be disadvantageous for the cell, whereas the occurrence of a second alteration may provide a permissive survival environment [37, 38]. Thus, the co-alterations between genes in cancer genome deliver a rational way to detect the SV interactions with a high potential to preempt the emergence of drug resistance. To our knowledge, SVDR is the first genome-scale data-driven approach for the identification of SV interactions related to drug resistance in cancer cells. SVDR successfully captures SV interactions that are favorable to cells and enables drug resistance prediction and clinical prognosis prediction for cancer patients, which could be validated in the independent data set. SVDR exhibits high reliability based on a highly consistent ratio and significant overlap between the CCLE and Broad CTRP databases.
Systematic studies of cancer genomes to reveal the mechanisms of drug resistance/response and guide the application of therapies for cancer is challenging [39]. Currently, the reproducibility between the pharmacogenomic data set CCLE and Genomics of Drug Sensitivity in Cancer is still in debate [40–42]. To ensure the high reliability of our conclusions, we only focused on analyzing the CCLE and Broad CTRP, which show high consistence ratios in this study. Although the Broad CTRP and CCLE data sets have shared cancer cell lines and genomic information, the experimental protocols and drug sensitivity measures differ between the two data sets. Moreover, few drugs overlap between the Broad CTRP and CCLE. The significant overlap among SV pairs between the CCLE and Broad CTRP may be attributed to different drugs with the same targets, which suggests the robustness of our SVDR method.
Owing to the advantages of single cells, genetic interactions, especially the SL interactions, have been well studied in yeast. Currently, many studies used the data of yeast to infer the genetic interactions in the human cancer genome [16, 43]. Because two species are distant, many of the human genes cannot be mapped to the yeast and thus may introduce some noises. In our work, only yeast SV interactions supported by TCGA or shRNA could be used for following drug response analysis. In total, 3446 and 63 SV interaction from yeast were supported by TCGA co-alteration pairs and shRNA data, respectively. And, 19 yeast SV interactions are supported by both TCGA and shRNA data, which could reduce the potential noise from yeast data set.
Our study demonstrates how published high-throughput cancer genomic information and pharmacogenomic data can be effectively integrated to identify potential SV pairs related to drug resistance. By investigating the SV interactions that induced drug resistance, we inferred a number of potential drug combinations for anti-cancer therapy, which deserves further detailed research. There is also room for SVDR to be improved in the near future. First, because the significantly altered chromosomal regions contain multiple genes, the partner genes of the same drug-targeting gene may be located in the same copy number altered region detected by the TCGA co-alteration procedure. Even though we used the criteria that gene pairs that were identified in at least two inference procedures with a significant combined P-value to select SV pairs, some genes located at the same region were predicted to be the partners of the same target gene, such as the partners of the target genes MDM2 and DRD2 (Figure 3A). For example, amplifications of eight genes on 12p12.1 were significantly related to resistance to the drugs targeting MDM2. Thus, it is urgent to develop a new approach to detect driver alterations within each SCNA region. A simple approach is to seek the known cancer genes within the SCNA region to define the driver genes. By overlapping the known cancer genes in the Census database (http://cancer.sanger.ac.uk/census/), ETNK1 emerged as a potential driver gene in the 12p12.1 to affect the drug response in tumor cells. Distinguishing the drivers in the SCNA region warrants our future detailed work. Second, excluding genomic alterations (mutations and SCNA), other mechanisms, such as hyper-methylation and deregulation of miRNA, also affect drug resistance and should be considered in subsequent studies. Third, our analysis is unable to identify the influence of the tissue origin, which contributes to the varied responses to many anti-cancer agents. Despite this limitation, our approach is expected to be able to identify SV pairs if a sufficient number of cancer cell lines with the same histology are available. Fourth, with the development of the genome editing technology CRISPR-CAS9, an increasing number of high-throughput functional data could be used in our SVDR method in the near future. Finally, although the results derived by SVDR are interesting and meaningful, experiments (cell and animal models) are required to unravel the mechanism of drug resistance induced by the alteration of partner genes. These studies will be the major focus in our future studies.
Key Points
This study presents a computational method to detect SVDR in cancer cells by integrating multidimensional high-throughput data sets.
This study demonstrates that SV interactions can render the cancer cell drug resistance using different pharmacogenomics data sets.
The SVDR successfully infers the potential drug combination for anti-cancer therapy.
Supplementary Data
Supplementary data are available online at http://bib.oxfordjournals.org/.
Funding
This work was supported by the National Natural Science Foundation of China (grant numbers 61673143, 81201822, 81572935 and 81372213), Natural Science Foundation of Heilongjiang Province (grant numbers QC2015100 and C2016037) and Special Financial Grant from China Postdoctoral Science Foundation (2016T90317).
Yuanyan Gu, PhD, is an associate professor of Bioinformatics at Harbin Medical University. She is the leader of cancer genome group at Training Center for Students Innovation and Entrepreneurship Education of Harbin Medical University. Her research focuses on identifying markers for drug response in cancer cell.
Ruiping Wang is a PhD candidate in Bioinformatics at Harbin Medical University. Her research is focused on investigating drug resistance.
Yue Han is a postgraduate student in Bioinformatics at Harbin Medical University. Her research is focused on analyzing cancer genome data.
Wenbin Zhou is a postgraduate student in Bioinformatics at Harbin Medical University. His research is focused on identifying drivers copy number alterations for cancer.
Zhangxiang Zhao is a postgraduate student in Bioinformatics at Harbin Medical University, China. He is also a member of cancer genome group at Training Center for Students Innovation and Entrepreneurship Education of Harbin Medical University. His research is focused on investigating epithelial–mesenchymal transition in cancer progression.
Tingting Chen is an undergraduate student in Bioinformatics at Harbin Medical University. She is also a member of cancer genome group at Training Center for Students Innovation and Entrepreneurship Education of Harbin Medical University. Her research is focused on analyzing drug response in cancer cell line.
Yuanyuan Zhang is an undergraduate student in Bioinformatics at Harbin Medical University. Her research is focused on the identification of driver mutations in cancer.
Fuduan Peng is a postgraduate student in Bioinformatics at Harbin Medical University. His research is focused on analyzing the differential expression of noncoding RNA in cancer.
Haihai Liang, PhD, is an associate professor of Pharmacology at Harbin Medical University. His research is focused on identifying markers of drug resistance in cancer.
Lishuang Qi, PhD, is a lecturer of Bioinformatics at Harbin Medical University. Her research is focused on analyzing pharmacogenomic data.
Wenyuan Zhao, PhD, is a lecturer of Bioinformatics at Harbin Medical University. Her research is focused on the functional enrichment analysis.
Da Yang, PhD, is an assistant professor at University of Pittsburgh. His research is focused on identifying mechanisms of cancer drug resistance.
Zheng Guo, PhD, is a professor of Bioinformatics at Harbin Medical University and Fujian Medical University. His research is focused on identifying prognostic markers for cancer.
References
Author notes
These authors Yunyan Gu and Ruiping Wang contributed equally to this work.
