


Abstract
Blood is a promising surrogate for solid tissue to investigate disease-associated molecular biomarkers. However, proportion changes of the constituent cells in the often-used peripheral whole blood (PWB) or peripheral blood mononuclear cell (PBMC) samples may influence the detection of cell-specific alterations under disease states. We propose a simple method, Ref-REO, to detect molecular alterations in leukocytes using the mixed-cell blood samples. The method is based on the predetermined within-sample relative expression orderings (REOs) of genes in purified leukocytes of healthy people. Both the simulated and real mixed-cell blood gene expression profiles were used to evaluate the method. Approximately 99% of the differentially expressed genes (DEGs) detected by Ref-REO in the simulated mixed-cell data are owing to the transcriptional alterations in leukocytes rather than the proportion changes of leukocytes. For the real mixed-cell data, the DEGs detected by Ref-REO in the PBMCs expression data for systemic lupus erythematosus (SLE) patients overlap significantly with the DEGs detected in the expression data of SLE CD4 + T cells and B cells and they are mainly enriched with mRNA editing and interferon-associated genes. The detected DEGs in the PWB data for lung carcinoma patients are significantly enriched with coagulation-associated functional categories that are closely associated with cancer progression. In conclusion, the proposed method is capable of detecting the disease-associated leukocyte-specific molecular alterations, using mixed-cell blood samples, which provides simple, transferable and easy-to-use candidates for disease biomarkers.
Background
As blood sampling is less invasive and easy to handle, many investigators have attempted to identify disease-associated biomarkers from peripheral whole blood (PWB) and peripheral blood mononuclear cells (PBMCs) [1–3]. It is well known that PWB and PBMCs comprise a heterogeneous population of cells, whose relative proportions may shift under disease states [4, 5]. For example, the proportions of T cells, NK cells and B cells decrease while the proportions of monocytes and neutrophils increase in PWB of head and neck carcinoma, ovarian cancer and rheumatoid arthritis patients [6, 7]. The use of peripheral blood cells to detect disease-associated molecular alterations relies on the natural role of these cells in their immune responses to physiologic and pathologic changes [8]. Unfortunately, the proportion change of leukocyte subtypes introduces additional signals in the expression data when using mixed-cell blood samples, which could influence and even disguise the disease-associated signals in leukocytes themselves [9, 10]. If the absolute measurement values of genes are compared directly between diseased and normal blood samples, some artificial differentially expressed genes (DEGs) will be detected, which have no expression change in any leukocyte subtypes and they are simply owing to the leukocyte proportion change. In our previous studies, we revealed that both the aberrant gene expressions [9] and DNA methylation alterations [10] in PWB of patients with cancer and inflammatory diseases were mainly attributed to the proportion changes of leukocyte subtypes. Therefore, it is necessary to avoid detecting the signals originating from leukocyte subtype proportion changes in the mixed-cell blood samples when detecting disease-associated cellular (leukocyte-specific) molecular alterations.
In developing methods to detect disease-associated cellular molecular changes, some researchers have already taken the influence of leukocyte subtype proportion changes on the overall signals of the mixed-cell blood sample into consideration [7, 11]. According to whether the purified leukocyte subtypes are required as reference data, these methods can be classified into reference-free and reference-dependent methods.
The reference-free methods, such as SVA-PLS (surrogate variable analysis using partial least squares) [12] and RefFreeEWAS (reference-free analysis epigenome-wide association studies) [13], are closely related with surrogate variable analysis, which is based on singular value decomposition [12]. However, on one hand, it is difficult for these methods to eliminate the influence of cell proportion changes that are indeed associated with disease progression. On the other hand, as the statistical models in the methods are population dependent, the detected biomarkers could be impractical for an individual sample in real clinical settings.
For the reference-dependent methods, it is needed to estimate and adjust the proportion of each leukocyte subtype in blood samples using deconvolution algorithms based on the profiles of the purified leukocyte subtypes [7]. These methods are intuitive and have been used to detect risk factors for rheumatoid arthritis [11], systemic lupus erythematosus (SLE) [14], ovarian cancer and head and neck carcinoma using mixed-cell blood samples [15]. However, this type of methods relies on the statistical calculation on the absolute measurement values of genes in the purified leukocyte subtypes, and the detected molecular changes are sensitive to the systematic biases in microarray measurements [16].
It has been reported recently that within-sample relative expression orderings (REOs) of genes are insensitive to the systematic biases in microarray measurements, invariant to monotonic data normalization and robust against inter-individual biological variation of gene expression levels [17, 18]. Here, we propose a new reference-dependent method, Ref-REO, which is based on within-sample REOs of genes in profiles of purified leukocyte subtypes, to detect the disease-associated leukocyte-specific alterations in mixed-cell blood samples. The usage of this method is illustrated through applications to simulated mixed-cell data and real data obtained from PBMCs for SLE patients and PWB for lung carcinoma patients.
Materials and methods
Data sources and data preprocessing
All the data analyzed in this study were downloaded from the Gene Expression Omnibus database (GEO, http://www.ncbi.nlm.nih.gov/geo/). Detailed information for each data set was described in Table 1. Set 1 and Set 2 examined expression profiles of purified leukocyte subtypes extracted from normal control cohorts and they were used as reference data. Set 1 examined 47 expression profiles of nine cell types, including CD16 + CD66b+ neutrophils, CD16-CD66b+ eosinophils, CD14 + monocytes, CD4+ T cells, CD8+ T cells, CD56+ NK cells, CD19+ B cells, CD123+ pDCs and CD11c+ mDCs, which were isolated from blood samples of healthy human and assessed for cell type purity by flow cytometry [19]. Set 2 examined 33 expression profiles for seven cell subsets, including CD16 + CD66b+ neutrophils, CD16 − CD66b+ eosinophils, CD14 + monocytes, CD4+ T cells, CD8+ T cells, CD56+ NK cells and CD19+ B cells, which were obtained from a separate panel of healthy donors at the University Hospital of Geneva [19]. Set 3 examined 61 expression profiles of PBMCs, which were collected from SLE patients in an observational study performed at the University of Michigan, and 20 expression profiles of PBMCs from normal controls [20]. Set 4 examined the expression profiles of CD4+ T cells and B cells collected from peripheral blood of SLE patients and normal controls. Set 5 examined expression profiles of PWB from 73 lung adenocarcinoma and 80 normal controls, which were collected from the Environment and Genetics in Lung Cancer Etiology study [21]. The normalized data were downloaded from GEO, and the original platform annotation file obtained from GEO for each data set was used to annotate the CloneIDs to GeneIDs. The number of genes measured in each data set was shown in Table 1. Totally, 7429 genes were commonly measured in all data sets, which were analyzed in the following study.
Data sets analyzed in this study
| Data set | Sample characteristic | #Gene | Platform | Accession ID | Reference |
|---|---|---|---|---|---|
| Purified normal leukocyte subtypes | |||||
| Set 1 | Sample No: 47 | 11 241 | GPL570 | GSE28490 | [19] |
| CD16+CD66b+ Neutrophils: 3, CD16-CD66b+ Eosinophils: 4, CD14+ Monocytes: 10, CD4+ T cells: 5, CD8+ T cells: 5, CD56+ NK cells: 5, CD19+ B cells: 5, CD123+ pDCs: 5, CD11c+ mDCs: 5 | |||||
| Set 2 | Sample No: 33 | 10 689 | GPL570 | GSE28491 | [19] |
| CD16+CD66b+ Neutrophils: 5, CD16−CD66b+ Eosinophils: 3, CD14+ Monocytes: 5, CD4+ T cells: 5, CD8+ T cells: 5, CD56+ NK cells: 5, CD19+ B cells: 5 | |||||
| SLE | |||||
| Set 3 | PBMCs Sample No: 81 | 20 283 | GPL570 | GSE50772 | [20] |
| SLE patients: 61, normal controls: 20 | |||||
| Set 4 | Sample No: 34 | 20 283 | GPL570 | GSE4588 | – |
| CD4 + T cells Sample No: 18 | |||||
| SLE patients: 10, Normal controls: 8 | |||||
| B cells: 16 | |||||
| SLE patients: 9, Normal controls: 7 | |||||
| Lung adenocarcinoma | |||||
| Set 5 | PWB Sample No: 153 | 12 753 | GPL571 | GSE20189 | [21] |
| Lung adenocarcinoma: 80, Controls: 73 | |||||
Detecting disease-associated cellular alterations from mixed-cell samples
Here, represents the proportions of the i-th leukocyte subtypes under the disease state, and , represent the expression levels of genes A and B in the i-th leukocyte subtypes under the disease state, respectively.
According to formula (4), if genes A and B have no expression changes in all leukocyte subtypes under the disease state, the REO of genes A and B should also be , no matter how the proportions of leukocyte subtypes change. Consequently, if the REO of genes A and B changed to under the disease state, the expression levels of genes A and/or B must be changed in at least one of the leukocyte subtypes.
According to the above deduction, we could detect disease-associated cellular alterations from such gene pairs in mixed-cell blood samples by determining which gene pairs have changed REOs under the disease state, taking the gene pairs with stable REOs in normal leukocyte subtypes as the reference. The flow chart is shown in Figure 1. First, the gene pairs with the identical REOs (e.g. ) in all normal leukocyte subtypes are extracted, defined as the reference gene pairs. Second, owing to the limited leukocyte subtypes collected, the mixed-cell normal control samples for studying a disease are used to filter the reference pairs. If the REO of a reference gene pair is maintained in >95% of the mixed-cell normal control samples, then this gene pair is kept for the following analysis. Third, Fisher’s exact test is used to evaluate whether the REOs of the filtered reference pairs are significantly reversal in the disease samples. At last, according to the filtered reference gene pairs and reversed gene pairs, we could identify the genes with altered expression levels in leukocyte subtypes under the disease state. The detailed procedure is described as below.
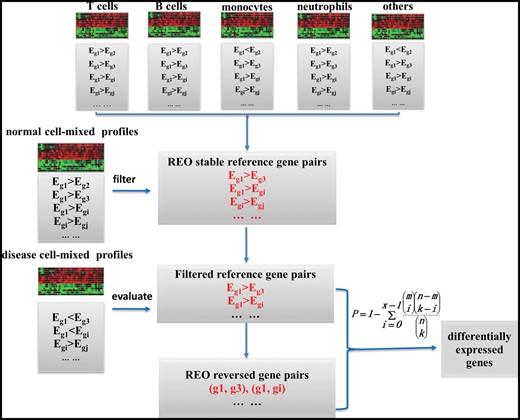
The flow chart of the Ref-REO method. The Ref-REO algorithm consists of the following four steps: (1) detection of gene pairs with stable REOs in normal leukocyte subtypes; (2) filtration of the stable gene pairs by mixed-cell normal blood samples; (3) extraction of the filtered stable gene pairs, which have reversal REOs in mixed-cell disease blood samples; (4) identification of the DEGs.
Here, M represents the number of the filtered reference gene pairs, N represents the number of the reversed pairs under disease state, n represents the number of gene pairs involving gene A with REOs in the filtered reference pairs, k represents the number of gene pairs involving gene A with REOs in the reversed pairs.
Otherwise, if this gene is up-regulated under the disease state, the gene pairs involving gene A with REOs in the filtered reference gene pairs should tend to change to be under the disease state. The significant level, , could be calculated similarly as . At last, the minimum value of and is used to determine the dysregulated direction of this gene under the disease state. The significant level is denoted as P. After multiple test correction [22], if the adjusted P-value is <0.05, then the gene is identified as DEG that occurred in leukocytes under the disease state.
Some genes with no changes under the disease state could be identified as DEGs owing to that they frequently appear to be the partners of true DEGs. To solve this problem, the following procedures are used: (1) Calculate the accumulated hypergeometric distribution P-value for each gene based on the filtered reference gene pairs and the reversed pairs, and adjust the P-values for multiple comparisons. (2) Sort all DEGs by the adjusted P-values in ascending order. (3) Select the first DEG (with the smallest adjusted P-value) from the sorted DEG list and remove the pairs involving this gene from the reversed pairs. (4) Repeat the above steps until no DEGs could be found. All the selected genes were the final DEGs.
Simulation experiment
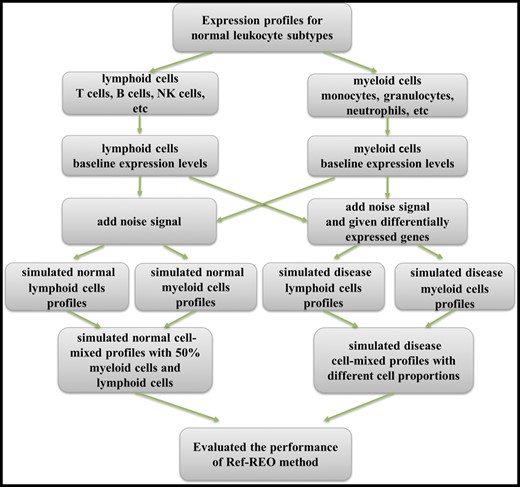
The flow chart of simulation experiment.
Here, represents the baseline expression value of Gene i in myeloid or lymphoid cells, and rand(0,1) represents a uniformly distributed random number between 0 and 1, and represents the simulated value for gene i in myeloid or lymphoid cells.
Here, represents the expression level of the i-th gene in the j-th simulated normal mixed-cell normal profile, represents the expression level of the i-th gene in the j-th simulated myeloid cell profiles and represents the expression level of the i-th gene in the j-th simulated lymphoid cell profiles.
Then, to simulate mixed-cell disease profiles that not only have cell proportion shifts but also have expression changes under the disease state, we randomly select and change the expression levels of 500 genes with 2∼3-fold increases or decreases in myeloid cells as the DEGs under the disease state. In the same way, we also randomly selected 500 genes as the DEGs for lymphoid cells. These two gene lists shared 30 genes. Then, we constructed mixed-cell disease profiles with different cell proportions by increasing the proportion of myeloid cells in mixed-cell samples from 50% to 80% and correspondingly decreasing the proportion of lymphoid cells from 50% to 20% with a step of 5%.
Functional pathway enrichment
To analyze the disease-associated genes identified from mixed-cell blood samples, 1330 canonical pathways collected in the C2 gene sets of MSigDB (The Molecular Signatures Database, http://software.broadinstitute.org/gsea/msigd) were downloaded. The hypergeometric distribution model was used to test whether the disease-associated genes observed in canonical pathways were significantly more than what was expected by random chance.
Results
Performance evaluation of Ref-REO using simulated data
As described in the ‘Material and Methods’ section, we generated simulation data for 50 normal myeloid cell profiles, 50 normal lymphoid cell profiles and 50 mixed-cell normal profiles with 50% myeloid cells and 50% lymphoid cells. To evaluate the influence of cell proportion changes on expression signals in mixed-cell samples, we constructed mixed-cell samples of which only cell proportions were changed, i.e. no changes in expression values in leukocytes, by increasing the proportion of myeloid cells in mixed-cell samples from 50% to 80% and decreasing the proportion of lymphoid cells from 50% to 20% correspondingly with a step of 5%. In each run of the simulation experiments, 50 mixed-cell expression profiles were constructed and DEGs were detected through the comparison with the mixed-cell normal samples using the Student’s t-test with false discovery rate (FDR) < 5%. The simulation result shows that the number of DEGs increases as the proportion of myeloid cells increases (Figure 3). For example, when the proportion of myeloid cells increased to 80% in the mixed-cell disease samples, 6180 DEGs were detected between the mixed-cell samples and the normal samples. These DEGs were all significantly differentially expressed between the simulated normal lymphoid cells and myeloid cells. This result indicates that cell proportion changes could distort the overall expression signals in mixed-cell samples [10]. In contrast, for the 15 361 780 gene pairs with stable REOs in both simulated normal myeloid cells and lymphoid cells, their relative ranks did not change in the mixed-cell samples, which indicates that the changes in cell proportions alone could not affect the stable REOs in all leukocyte subtypes in the mixed-cell samples.
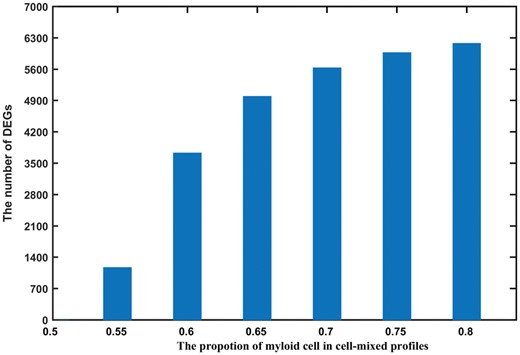
Number of DEGs detected from mixed-cell samples with different proportions of myeloid cells. The bars plot shows the number of DEGs (y-axis) detected from simulated mixed-cell samples with different proportions of myeloid cells (x-axis) by Student’s t-test.
Further simulation experiments were performed on the simulated mixed-cell disease profiles with changes in both the cell proportions and expression values. We selected 500 genes as true DEGs for myeloid and 500 genes for lymphoid cells (970 genes in total, because 30 genes were shared by the two cell types) and changed their values. In addition, we adjusted the cell proportions in the mixed-cell samples. Then, with FDR < 5%, DEGs between the mixed-cell disease samples and mixed-cell normal samples were detected using the Student’s t-test, the reference-free [13], the reference-dependent [7] and Ref-REO methods, respectively. The reference-free and reference-dependent methods developed by Houseman et al. were performed with the default parameter settings. For the reference-dependent method, the top 100 genes with the most varied expression levels between the simulated gene expression profiles of myeloid and lymphoid cells were used as the cell signatures to estimate the cell proportions. As shown in Table 2, when there is no cell proportion change under the disease state, the four methods all performed well with high rates of precision and recall (above 95%) for DEG detection. However, when the proportion of myeloid cells increased only slightly from 50% to 55%, though the recalls of detecting DEGs using the Student’s t-test and the reference-free method remained high, the precisions decreased sharply to below 50%. When the proportion of myeloid cells increased to 80%, the numbers of DEGs detected by the two methods were all >6000 but their precisions were only 14.72% and 14.71%, respectively. Although the reference-dependent method performed better than the Student’s t-test and reference-free methods, its precision also decreased sharply to 67.48% when the proportion of myeloid cells slightly increased from 50% to 55%, as shown in Table 2. In contrast, no matter how many the proportions of myeloid and lymphoid cells were changed, the precision of the Ref-REO method remained above 99%, with only a small sacrifice in recall as the proportion of myeloid cells increased.
Performance comparison of Ref-REO and other three methods
| Proportion of myeloid cells | Student’s t-test | Reference-free | Reference dependent | Ref-REO |
|---|---|---|---|---|
| 0.50 | 966 (100%, 99.59%)a | 966 (100%, 99.59%) | 966 (99.90%, 99.48%) | 927 (99.89%, 95.46%) |
| 0.55 | 2167 (44.62%, 99.69%) | 2249 (43.00%, 99.69%) | 1230 (67.48%, 85.57%) | 917 (99.78%, 94.33%) |
| 0.60 | 4307 (22.48%, 99.90%) | 4382 (22.11%, 99.90%) | 665 (54.74%, 37.53%) | 918 (99.56%, 94.23%) |
| 0.65 | 5330 (18.14%, 99.69%) | 5305 (18.23%, 99.69%) | 403 (40.94%, 17.01%) | 897 (99.67%, 92.16%) |
| 0.70 | 5874 (16.43%, 99.48%) | 5897 (16.36%, 99.48%) | 267 (34.83%, 9.59%) | 876 (99.89%, 90.21%) |
| 0.75 | 6157 (15.46%, 98.04%) | 6174 (15.40%, 98.04%) | 188 (27.66%, 5.36%) | 819 (99.88%, 84.33%) |
| 0.80 | 6324 (14.72%, 95.98%) | 6314 (14.71%, 95.98%) | 128 (25.78%, 3.40%) | 735 (100%, 75.77%) |
aThe number outside the brackets represents the number of detected DEGs, and the percentages inside the bracket represent the precision and recall rate respectively.
The results suggest that the Ref-REO method is able to detect cellular alterations in mixed-cell samples effectively while the DEGs introduced by the cell proportion changes can be excluded.
SLE associated cellular alterations in PBMCs
Using the purified leukocyte subtype profiles examined in Set 1 and Set 2, 8 037 062 gene pairs were identified, which have stable REOs in >95% samples and they were used as the reference pairs in the following analysis. Among them, 7 035 262 gene pairs were also stable in >95% of the normal control PBMC profiles examined in Set 3, which was unlikely to happen by chance (binomial distribution test, P-value = 2.2 × 10 − 16) and they were used as the filtered reference pairs for analyzing PBMC samples. Among these filtered reference pairs, 59 624 showed significantly reversal REOs in the SLE PBMC profiles examined in Set 3 (Fisher’s exact test, FDR < 5%). Using the filtered reference pairs and reversed pairs, 1301 DEGs were detected by Ref-REO with FDR <5% (Supplementary Table S1).
To validate whether the DEGs detected by Ref-REO were leukocyte cell-specific, we compared them with the DEGs detected for leukocyte subtypes. As gene expression data for SLE leukocyte subtypes were limited, we only analyzed the SLE CD4+ T cells and B cells (Set 4). By using the Student’s t-test with FDR <5%, 271 and 147 DEGs were detected, respectively, in the two type of cells. Among the 271 DEGs detected in SLE CD4+ T cells, 72 were also detected in SLE PBMCs by Ref-REO, which was unlikely to be observed by chance (hypergeometric distribution test, P-value = 9.76 × 10 − 5). Similarly, among the 147 DEGs detected in SLE B cells, 44 DEGs were also detected in SLE PBMCs by Ref-REO, which was unlikely to happen by chance (hypergeometric distribution test, P-value = 1.32 × 10 − 4). Notably, although the DEGs detected in both SLE PMBC and CD4 + T cells/B-cells accounted for only approximately 30% of the DEGs detected in SLE CD4 + T cells/B-cells, the former DEGs had greater expression alterations than those missed by Ref-REO from PBMCs. For the DEGs detected in CD4 + T cells, the median difference in expression levels between normal and SLE samples was 0.95, significantly greater than 0.67, which was calculated from the remaining DEGs (Wilcoxon rank sum test, P-value = 3.01 × 10 − 4). Similarly, for the DEGs detected in B cells, the median difference in expression levels of the 44 DEGs was 1.21, significantly higher than 0.70 for the remaining DEGs (Wilcoxon rank sum test, P-value = 1.32 × 10 − 4). The result indicates that the Ref-REO method tends to detect the cellular expression alterations with larger magnitude.
Furthermore, we performed functional enrichment analysis for the 1301 SLE PBMC cellular DEGs. It was found that they were mainly enriched in the interferon and mRNA-editing-associated functional modules (Table 3). The interferon associated genes have been reported to be significantly associated with SLE development and progression [23], and aberrant expressions of these genes have been found in CD19+ B cells, CD3 + CD4+ T cells and CD33+ myeloid cells [24]. Aberrant mRNA editing is also thought to be involved in the pathogenesis of SLE. For example, increased FAS mRNA editing mutation in T cells in the pathogenesis of SLE could defect the FAS/FASL system which plays a central role in maintaining peripheral immune tolerance [25], and 3ʹ-untranslated region splice variant with reduced mRNA stability has been reported to express in increased amounts in SLE T cells [26]. The application to SLE PBMC data further supports that Ref-REO is able to detect disease-associated cellar alterations using the mixed-cell blood samples.
Functional modules enriched by the DEGs detected from SLE PBMC
| Functional module | Gene numbera | Hits | P-value |
|---|---|---|---|
| Antiviral mechanism by interferon-stimulated genes | 50 | 18 | 6.64 × 10⁻⁴ |
| mRNA splicing | 77 | 25 | 4.08 × 10⁻⁴ |
| Interferon alpha/beta signaling | 38 | 17 | 4.03 × 10⁻⁵ |
| Interferon signaling | 99 | 31 | 1.80 × 10⁻⁴ |
| Processing of capped intron-containing pre-mRNA | 100 | 30 | 5.23 × 10⁻⁴ |
aRepresented the number of genes involved in functional modules.
Lung adenocarcinoma-associated cellular alterations in PWB
We applied the Ref-REO method to the lung adenocarcinoma PWB profiles examined in Set 5 to detect lung adenocarcinoma-associated cellular alterations. The 8 037 062 reference gene pairs extracted from the purified leukocyte subtype profiles were filtered by the normal control PWB profiles in Set 5. At last, 6 282 742 gene pairs were analyzed as filtered reference pairs for PWB, which had stable REOs in >95% of the normal control PWB profiles. Evaluating these filtered reference pairs in the lung adenocarcinoma PWB profiles, we found that the REOs of 256 gene pairs were significantly reversed in the lung adenocarcinoma PWB profiles. With FDR < 5%, 22 DEGs were detected (Table 4). Some of these DEGs have been reported to be closely associated with lung cancer development. For example, CLU, ITGA2B and SPARC are prognostic factors of overall survival for lung cancer [27–29]; SLEP has been considered as therapy target for lung cancer, as the promoter activities of this gene are increased in lung cancer cells as SF1 mutation [30]. TSTA3 (tissue-specific transplantation antigen P35B), which has been reported to have consistent change in lung cancer and blood samples, could be used as candidate lung cancer diagnostic biomarker [2]. We also found that among the detected 22 DEGs, 12 genes were significantly differentially expressed in lung tumor tissues (Table 3). The tissue data were collected from GEO (Accession No: GSE19804), which examined 60 lung tumor tissues and adjacent normal controls [31]. The result of functional enrichment analysis showed that these genes were enriched in the coagulation-associated functional modules, including ‘Homeostasis (P-value = 3.16 × 10 − 5)’, ‘Response to elevated platelet cytosolic Ca2+ (P-value = 2.08 × 10 − 5)’ and ‘Platelet activation, signaling and aggregation (P-value = 3.99 × 10 − 6)’. In the literature, more and more studies have reported that coagulation disorders are commonly the first sign of malignancy, which also take place in patients with lung cancer [32]. It has now been established that cancer development leads to an increased risk of thrombosis, and conversely, excessive activation of blood coagulation profoundly influences cancer progression. Coagulation could facilitate tumor progression through the release of platelet granule contents, inhibition of natural killer cells and recruitment of macrophages [32–34]. These results again show the capability of the Ref-REO method in detecting the disease-associated cellular alterations using the mixed-cell samples.
DEGs detected from lung adenocarcinoma PWB in cancer tissue
| Gene ID | Symbol | P-value* | Gene ID | Symbol | P-value* |
|---|---|---|---|---|---|
| Up-regulated in lung adenocarcinoma PWB | |||||
| DEGs in lung cancer tissue | Non-DEGs in lung cancer tissue | ||||
| 1191 | CLU | <2.20 × 10⁻¹⁶ | 6678 | SPARC | <2.20 × 10⁻¹⁶ |
| 3674 | ITGA2B | <2.20 × 10⁻¹⁶ | 7168 | TPM1 | <2.20 × 10⁻¹⁶ |
| 5577 | PRKAR2B | <2.20 × 10⁻¹⁶ | 6478 | SIAH2 | 2.13 × 10⁻⁹ |
| 6403 | SELP | <2.20 × 10⁻¹⁶ | 10 857 | PGRMC1 | 3.26 × 10⁻² |
| 6583 | SLC22A4 | <2.20 × 10⁻¹⁶ | 267 | AMFR | 5.54 × 10⁻⁷ |
| 7264 | TSTA3 | <2.20 × 10⁻¹⁶ | 5742 | PTGS1 | 8.36 × 10⁻⁷ |
| 2791 | GNG11 | 1.70 × 10⁻¹⁰ | 80 896 | NPL | 1.03 × 10⁻² |
| 5594 | MAPK1 | 1.01 × 10⁻⁵ | |||
| 29 780 | PARVB | ||||
| Down-regulated in lung adenocarcinoma PWB | |||||
| DEGs in lung cancer tissue | Non-DEGs in lung cancer tissue | ||||
| 11 214 | AKAP13 | 2.09 × 10⁻⁴ | 57 062 | DDX24 | 2.62 × 10⁻⁴ |
| 1108 | CHD4 | 2.00 × 10⁻⁴ | 7536 | SF1 | 2.70 × 10⁻⁴ |
| 23 215 | PRRC2C | 4.01 × 10⁻⁷ | 56 987 | BBX | 1.40 × 10⁻² |
The P-value is calculated by accumulated hypergeometric distribution.
Discussion
One important challenge in the development of blood-borne biomarkers is to discover the disease-associated signals as opposed to the signals introduced by the cell proportion changes [8]. A novel method, Ref-REO, based on the within-sample REOs of genes was proposed to detect the disease-associated cellular alterations using the mixed-cell blood samples. This method first specified the stable within-sample REOs obtained from the purified leukocyte subtypes as reference, then identified gene pairs that had reversal REOs in the mixed-cell blood samples compared with the reference and finally detected DEGs based on the stable and reversed gene pairs. Results suggested that this method could effectively detect the disease-associated cellular alterations in the simulated mixed-cell data, real SLE PBMC and lung adenocarcinoma PWB data.
However, some genes may be undetected with cellular alterations in leukocytes. (1) The differential signals of some genes may be covered in the mixed-cell samples, as the cell proportion changes are limited. In the simulated data, we found that the true DEGs detected in lymphoid cells decreased from 94% (470/500) to 51% (255/500) when the proportion of lymphoid was decreased from 50% to 20%. (2) The differential signals of some genes may be diluted in the mixed-cell samples if they have opposite dysregulated directions in different cell types under the disease state. (3) The genes with weak expression changes may be missed, as weak expression changes may not result in significant REO changes. This is especially the case for the lowly expressed genes, as the REO for a lowly expressed gene and a non-lowly expressed gene is mainly determined by the non-lowly expressed gene. For gene pairs comprising two lowly expressed genes, REOs are easily influenced by the systematic variations of microarray measurements, and thus, such gene pairs are unlikely to from stable gene pairs in all normal samples. As shown in Figure 4, lowly expressed genes did not tend to be detected as DEGs for SLE by Ref-REO. On the other extreme, high-expressed genes were also less likely to be detected as DEGs by Ref-REO, which could be explained by the possibility that the highly expressed genes are likely to be involved in some functionally conserved pathways [35] and thus their expression levels are relatively stable. Nevertheless, the DEGs detected by our method, which tend to have greater changes in cell types, are more reliable as the risk factor of diseases. As shown in the ‘Results’ section, the DEGs detected in SLE PBMCs have greater expression alterations in CD4+ T cells and B cells than those missed by our method.
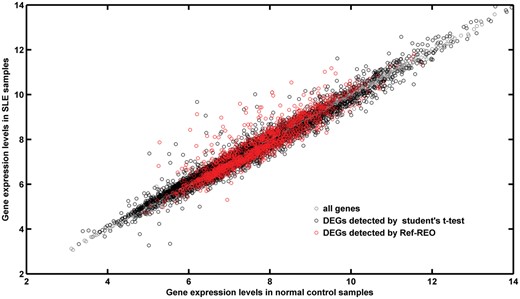
The expression level distribution of DEGs detected for SLE. The x-axis represents the gene expression levels in normal control samples. The Y-axis represents the gene expression levels in SLE samples. Gray circle represents all genes. Black circle represents the DEGs detected by the Student’s t-test. Red circle represents the DEGs detected by Ref-REO.
In another perspective, unlike other reference-based methods, there is no need for the Ref-REO method to make estimation and adjustment on the proportion of each cell type in the mixed-cell samples [12, 13], and neither are complex statistical models needed. The method is easy for clinic use and validation. Furthermore, like k-TSP [36] and RankComp [18], our method is based on the REOs of genes only, which makes it transferable to other studies to discover disease diagnostic biomarkers or individual analysis. In conclusion, our method provides a new way to detect the disease-associated leukocyte molecular alterations in mixed-cell blood samples.
Key Points
Cell proportion changes in mixed-cell samples may distort the expression signals.
Within-sample relative expression orderings of genes in profiles of purified leukocyte are used to detect the disease-associated cellular alterations in mixed-cell blood samples.
The Ref-REO method is effective, transferable and easy-to-use for the detection of candidate biomarkers from mixed-cell blood samples.
Supplementary Data
Supplementary data are available online at http://bib.oxfordjournals.org/.
Funding
National Natural Science Foundation of China (grant no. 81501215, 81501829, 81372213, 81572935; in part); the Natural Science Foundation of Fujian Province, China (grant no. 2016J01706; in part); and the Joint Fund for Program of Science and Technology Innovation of Fujian Province, China (grant no. 2016Y9102).
Guini Hong, PhD, is a lecturer of Bioinformatics at Fujian Medical University, China. Her research focuses on the functional enrichment analysis of omics data and the biomarker discovery for cancer.
Hongdong Li, PhD, is a lecturer of Bioinformatics at Fujian Medical University, China. His research focuses on investigating the relationship between aging and cancer.
Mengyao Li is a postgraduate student of Bioinformatics at Fujian Medical University, China. Her research focuses on the tumor metastasis.
Weicheng Zheng is a lecturer of Bioinformatics at Fujian Medical University, China. His research focuses on constructing databases of omics data and subtype identification for cancers.
Jing Li, PhD, is a lecturer of Bioinformatics at Fujian Medical University, China. Her research focuses on small RNAs and cancer-related pathway analysis.
Meirong Chi is a postgraduate student in Bioinformatics at Fujian Medical University, China. Her research focuses on investigating the relationship between inflammation and cancer.
Jun Cheng is a postgraduate of Bioinformatics at Fujian Medical University, China. His research focuses on investigating the influence of the proportion of tumor cells on cancer biomarker detection.
Zheng Guo, PhD, is a professor of Bioinformatics at Fujian Medical University. His research interests include investigating complex diseases at the functional module level and translational medicine.
References
Author notes
These authors Guini Hong and Hongdong Li contributed equally to this work.
