


Abstract
To meet the increasing demand in the field, numerous long noncoding RNA (lncRNA) databases are available. Given many lncRNAs are specifically expressed in certain cell types and/or time-dependent manners, most lncRNA databases fall short of providing such profiles. We developed a strategy using logic programming to handle the complex organization of organs, their tissues and cell types as well as gender and developmental time points. To showcase this strategy, we introduce ‘RenalDB’ (http://renaldb.uni-frankfurt.de), a database providing expression profiles of RNAs in major organs focusing on kidney tissues and cells. RenalDB uses logic programming to describe complex anatomy, sample metadata and logical relationships defining expression, enrichment or specificity. We validated the content of RenalDB with biological experiments and functionally characterized two long intergenic noncoding RNAs: LOC440173 is important for cell growth or cell survival, whereas PAXIP1-AS1 is a regulator of cell death. We anticipate RenalDB will be used as a first step toward functional studies of lncRNAs in the kidney.
Introduction
A noncoding RNA (ncRNA) is any expressed transcript that is not translated into a protein. ncRNAs largely outnumber protein-coding transcripts and contain many sub-classes, such as ribosomal RNAs, transfer RNAs and microRNAs. Long noncoding RNAs (lncRNAs) are defined as any ncRNA longer than 200 nt [1]. This interest stems from their high abundance, importance to many biological functions and relatively small number of characterized lncRNAs, indicating a wealth of discoveries waiting to be found [2–9]. RNA sequencing (RNA-seq) is an essential tool for studying lncRNAs and is widely used to screen for lncRNAs. Furthermore, the majority of RNA-seq data from published studies is publicly and freely available. Thus, collections of these data can be re-analyzed to test hypotheses outside of the studies they were published in.
Once a set of RNA-seq data sets has been assembled, there are a number of methods for describing the expression specificity of RNAs. Each method falls into one of two categories. The first category describes whether a sequence is tissue specific or ubiquitously expressed. The second one describes how specific a sequence is to a certain tissue (referred to as global and relative specificity, respectively, in this article) [10]. The basic requirement for many methods for describing specificity is that the samples must be on the similar level of anatomical hierarchy. This is concerning considering some lncRNA’s expression profiles are known to be much more complicated than simply expressed in one tissue [11].
To meet with the above needs, we propose to extend the current methods with logic programming by allowing much greater logical nuance to be used when processing data. Logic programming is a programming paradigm based on formal logic and is composed of facts, rules and queries [12]. Here, we created sets of logic programming facts describing the metadata of RNA-seq samples and the anatomical organization of kidneys. We then created logic programming rules describing what expression, enrichment and specificity mean in these contexts. These facts and rules were used to preform logic programming queries to find the hierarchical expression, enrichment and specificity of RNAs within various RNA-seq data sets. To this end, we introduce a new relational database and Datalog knowledge base for nephrology called ‘RenalDB’ (http://renaldb.uni-frankfurt.de) to facilitate the needs of researchers working with kidneys and serve as an example of the logic programming technique for bioinformaticians. Additionally, logic programming is used within RenalDB to extend the utility of our SQL-based advanced search and to determine the layout of the hierarchical tree structures showing as expression heat maps in RenalDB. Furthermore, given that most of the available lncRNA databases were released without biological validation, we provide biological experiments validating the expressions of lncRNAs included in RenalDB as well as functional data to gain confidence of potential users of RenalDB.
Methods
The RenalDB database
The primary data analysis for RenalDB was preformed using the Snakemake workflow engine [13]. The Snakemake pipelines used in this study are provided at https://bitbucket.org/tweirick/renaldb. In the pipeline, RNA-seq data sets were downloaded from the NCBI Sequence Read Archive (SRA) as SRA files [14, 15]. Fastq-dump (version 2.1.7) was used to convert the SRA files to fastq files (http://www.ncbi.nlm.nih.gov/sra). STAR [16] (version 2.5.1b) was used to align the reads using the genome annotation files from the Ensembl database (http://www.ensembl.org/info/data/ftp/index.html; version 83). HTSeq [17] (version 0.6.1.p2) was used to extract read counts. Conditions in which <25% of sequences were expressed were discarded. For paired-end reads, gene-level and transcript-level counts were obtained. For single-end reads, only the gene-level counts were measured to avoid problems assigning counts to similar isoforms. DESeq2 [18] (version 3.2) was used to perform between-sample normalization on the read counts. Finally, the sequences were divided by the sequence’s effective length and scaled by multiplying by 1e3 for sequence length normalization, which is similar to the calculation for Fragments Per Kilobase of transcript per Million mapped reads (FPKM) values. The calculation for FPKM values also includes the total library size in its denominator. However, this division was excluded owing to the previous between-sample normalization.
The information and analyzed RNA-seq data were stored in a MySQL database (Figure 1A). Datalog knowledge bases are shown in Figure 1B-D, which include examples of the codes describing kidney anatomy (Figure 1B), experiments and their corresponding accession IDs (Figure 1C) and relationships between anatomical objects and the corresponding information about their RNA expression patterns (Figure 1D). The web interface was built using the Django web framework and the Datalog processing handled by the pyDatalog package. Gene Ontology (GO) annotations were obtained from the GO annotations available via the BioMart Community Portal (www.biomart.org) [19]. For each GO term, a link to AmiGo 2 (http://amigo.geneontology.org/amigo) [20] is provided. In RenalDB, UGAHash accession system was used as primary IDs [9]. RenalDB will be updated twice a year to include the latest publicly available RNA-seq data sets.
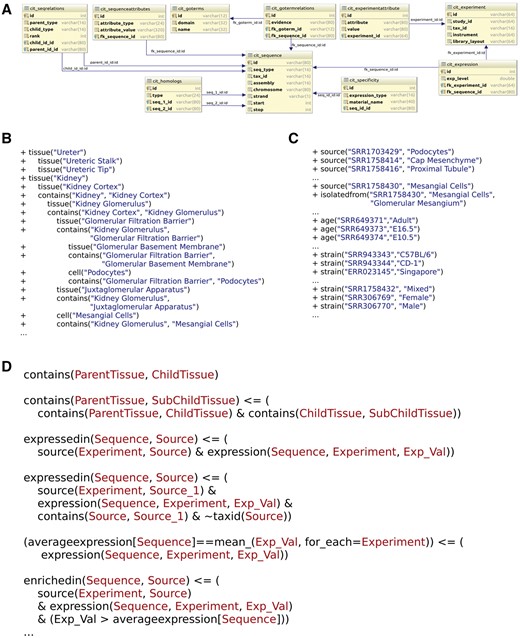
RenalDB. (A) The database schema for the relational database portion of RenalDB. (B–D) Examples of the knowledge bases used in RenalDB. Knowledge bases are separated based on the type of information they contain. (B) An example of the facts describing kidney anatomy. This series of facts describes the relationships (e.g. contains, develops from) among anatomical objects (e.g. organism, tissue, cell). (C) An example of the facts describing the experiments included in RenalDB. (D) An example of the rules describing how expression, enrichment and specificity are defined. These high-level logical statements then used as queries on the anatomical and experimental databases to determine whether the gene/transcript is expressed, enriched or specific to various anatomical objects.
Culturing of cells, quantitative reverse transcription polymerase chain reaction and siRNAs
‘Human Embryonic Kidney 293’ (HEK-293) cells were cultured in the growth medium consisting of DMEM with low glucose and pyruvate (Life Technologies) supplemented with 10% FBS (Life Technologies), antibiotics (100 units of penicillin and 100 μg of streptomycin per ml, Sigma-Aldrich) at 37 °C in a humidified atmosphere containing 5% CO2.
RNA was isolated with TRIzol reagent, purified and treated with TURBO DNase (Life Technologies) before reverse transcription. The primer pairs were designed using Primer3 (http://bioinfo.ut.ee/primer3-0.4.0/) [21] and in silico validated with UCSC insilico polymerase chain reaction (PCR; https://genome.ucsc.edu/cgi-bin/hgPcr) before extensive testing by experiments for the existence of a single band of the expected size for each primer pair. The list of primer pairs used in this study can be found in Supplementary Table S1.
For human tissues, purified RNA was purchased from commercial vendors as follows: Human Total RNA Master Panel II (Clonetech, #636643, Lot Number 1202050A); and human heart (Amsbio, #R1234122-50, Lot Number A804058).
Transient transfection of siRNA duplexes (MISSION, Sigma-Aldrich; 10 nM and 100 nM final concentration for LOC440173 and PAXIP1-AS1, respectively; Supplementary Table S1) was carried out using RNAiMax (Life Technologies) according to the manufacturer’s protocol. The corresponding amount of control siRNA (MISSION Negative control SIC002, confidential sequence; Sigma-Aldrich) was used. Forty-eight hours after the transfection of siRNAs, cells were exposed to TRIzol to extract RNA.
After the purification and treatment of RNA with TURBO DNase (Life Technologies), 1 μg of RNA was reverse transcribed with SuperScript VILO Master Mix (Life Technologies). The first-strand cDNA was diluted to the concentration of 5 ng/μl. For quantitative reverse transcription polymerase chain reaction (qRT-PCR), 1 μl (5 ng) of the cDNA template was used with Fast SYBR Green Master Mix (Life Technologies) via StepOne Plus Real-Time PCR System (Applied Biosystem) with the following thermal cycling condition: 95 °C for 20 s followed by 40 cycles of 95 °C for 3 s and 60 °C for 30 s. Relative fold expression was calculated by 2–ΔΔCt using Gapdh as an internal control.
Cell viability assay
A total of 200 000 HEK-293 cells were plated in each well of a six-well plate. On the following day, siRNAs were transfected. Twenty-four hours after the transfection, hydrogen peroxide (Sigma Aldrich, #H1009) was added at the final concentration of 50µM. The next day, cells were detached, stained with Trypan Blue (Sigma Aldrich, cat. T8154) and counted by Neubauer Chamber.
Microarray experiments and data analysis
GeneChip®Human Gene 1.0 ST Arrays (Affymetrix) were used according to the manufacturer's protocol and scanned. The CEL files were analyzed through the updated version of noncoder web interface (http://noncoder.mpi-bn.mpg.de) [22] using the pipeline setup for Gene Array Analyzer web interface (http://gaa.mpi-bn.mpg.de) [23]. After the normalization by Robust Multi-array Average [24] and the application of moderate t-statistics via the Limma package [25], Transcript Cluster IDs that do not match to a gene or that match to multiple genes were discarded. Then, a standard deviation is calculated across samples. For a gene that matches to multiple Transcript Cluster IDs, the Transcript Cluster ID with the highest standard deviation across samples was kept for further analysis.
All the microarray data in this study were deposited in the Gene Expression Omnibus (GSE74325). The analyzed data can be accessed via our noncoder web interface (http://noncoder.mpi-bn.mpg.de/) [22] using ‘Kidney’ as the user name and password.
GO analyses were performed using DAVID (https://david.ncifcrf.gov/home.jsp) [26].
Statistics
Data are presented as mean ± SEM. Two-sample, two-tailed, heteroscedastic Student’s t-test was performed to calculate a p-value via Microsoft Excel.
Results
Survey of public lncRNA databases with expression data
Increasing research interests in the field of lncRNAs have prompted the building of databases to cover the expression profiles of lncRNAs in various conditions and organisms. Currently, there are 19 public databases that contain the expressions of lncRNAs (Table 1). These are ALDB [27], ANGIOGENES [28], C-It-Loci [8], ChIPBase [29], Co-LncRNA [30], deepBase v2.0 [31], Expression Atlas [32], GEO Profiles [33], LncBase v.2 [34], Human Body Map long intergenic noncoding RNAs (lincRNAs) [35], lncRNA2function [36], lncRNAdb v2.0 [37], lncRNAMap [38], lncRNAtor [39], MTD [40], NONCODE 2016 [41], NRED [42], TANRIC [43] and TF2lncRNA [44]. Of note, some lncRNA-focused databases, such as LNCipedia [45], were not included in Table 1 because they do not contain expression profiles. The general trend of these public databases is to provide a comprehensive view of the expressions of lncRNAs in various conditions. In all databases except NRED, the expression profiles are based on RNA-seq data, as only few types of microarrays are designed for lncRNAs [22]. Most of the public databases (indicated by * in Table 1) are designed to provide the expression profiles of protein-coding genes as well. The availability of expression profiles of protein-coding genes is useful, as such expressions could be used as a validation for a certain expression pattern (e.g. guilt-by-association for tissue specificity). Furthermore, by the inclusion of protein-coding genes, GO terms can be used to infer the possible biological functions of lncRNA by its co-expression to protein-coding genes as in the case for Co-LncRNA, lncRNA2function and lncRNAtor.
List of public databases of lncRNAs with their expression profiles
| Database Name | Organism(s) | Samples | Technology | URL |
|---|---|---|---|---|
| ALDBa | Chicken, cow, pig | Tissues | RNA-seq | http://res.xaut.edu.cn/aldb/index.jsp |
| ANGIOGENESa | Human, mouse, zebrafish | Cell lines, tissues | RNA-seq | http://angiogenes.uni-frankfurt.de |
| C-It-Locia | Human, mouse, zebrafish | Tissues | RNA-seq | http://c-it-loci.uni-frankfurt.de |
| ChIPBasea | Human | Tissues | RNA-seq | http://deepbase.sysu.edu.cn/chipbase/index.php |
| Co-LncRNAa | Human | Cancers, cell lines, tissues | RNA-seq | http://www.bio-bigdata.com/Co-LncRNA/ |
| deepBase v2.0 | Chicken, chimpanzee, cow, gorilla, fly, frog, human, monkey, mouse, opossum, platypus, rat, worm, zebrafish | Cell lines, tissues | RNA-seq | http://biocenter.sysu.edu.cn/deepBase/index.php |
| Expression Atlasa | Many | Many | Many | https://www.ebi.ac.uk/gxa/home |
| GEO Profilesa | Many | Many | Many | https://www.ncbi.nlm.nih.gov/geoprofiles/ |
| LncBase v.2 | Human, mouse | Cell lines, tissues | RNA-seq | http://carolina.imis.athena-innovation.gr/ index.php?r=lncbasev2 |
| Human Body Map lincRNAsa | Human | Tissues | FISH, RNA-seq | http://www.broadinstitute.org/genome_bio/ human_lincrnas/ |
| lncRNA2functiona | Human | Tissues | RNA-seq | http://mlg.hit.edu.cn/lncrna2function/index.jsp |
| lncRNAdb v2.0 | Human | Tissues | RNA-seq | http://www.lncrnadb.org |
| lncRNAMap | Human | Cancers, tissues | RNA-seq | http://lncrnamap.mbc.nctu.edu.tw/php/index.php |
| lncRNAtora | Fly, human, mouse, worm, zebrafish | Cancers, diseases, tissues | RNA-seq | http://lncrnator.ewha.ac.kr/index.htm |
| MTDa | Human, pig, rat, mouse | cell lines, tissues | RNA-seq | http://mtd.cbi.ac.cn |
| NONCODE 2016 | Human, mouse | Tissues | RNA-seq | http://www.noncode.org |
| NREDa | Human, mouse | Cell lines, tissues | ISH, microarray | http://jsm-research.imb.uq.edu.au/nred/cgi-bin/ ncrnadb.pl |
| TANRIC | Human | Cancers, cell lines | RNA-seq | http://ibl.mdanderson.org/tanric/_design/basic/ index.html |
| TF2lncRNA | Human | Tissues | RNA-seq | http://mlg.hit.edu.cn/tf2lncrna/index.jsp |
aThe databases that contain both protein-coding genes and lncRNAs.
FISH, fluorescent in situ hybridization; ISH, in situ hybridization.
It is generally accepted in the field that lncRNAs are poorly conserved from one species to another when their sequences are examined [3, 4]. Nevertheless, for the purpose of biological experiments, it is important to know the species-conservation of lncRNAs of interest, as it is not always possible to perform biological experiments (e.g. gain/loss-of-function) in human subjects, which leads to the usage of model organisms (e.g. mouse, zebrafish) for in vivo experiments [46]. To provide the evidence of evolutional conservation of lncRNAs, deepBase v2.0, MTD and NONCODE 2016 offer such information based on the sequence similarity via BLAST, while ANGIOGENES and C-It-Loci use three types of conservations. The first homology is based on the concept of ‘positional conservation’ [8, 47] that a genomic locus spanning between two homologous protein-coding genes are conserved when these protein-coding genes are conserved between/among organisms. By defining this locus to be conserved, any lncRNA in this locus is also considered as conserved between/among organisms. The second homology is based on the ultraconserved elements, which are species-conserved regions that are shown to be transcriptional regulators of key developmental genes [48, 49]. The third homology is based on the species-conserved cis-regulatory elements (enhancers) that are experimentally validated in transgenic mice [50, 51]. As the intension of biological databases should be that to assist researchers further for their biological experiments, it is imperative that an option to know the evolutional conservation of lncRNAs is provided.
As lncRNAs are more tissue-specifically but generally lower expressed than protein-coding genes [35, 52–55], many databases contain expression data of various tissues. In most cases, these databases are built in a way to prompt further knowledge discovery from the user side with a defined hypothesis (e.g. ‘In which tissue, a lncRNA of interest is expressed?’). Among these databases, ALDB, C-It-Loci, MTD and deepBase v2.0 offer a way to screen for a list of lncRNAs expressed in a target tissue. Among them, ANGIOGENES, C-It-Loci and MTD allow for the comparison of expressed lncRNAs across various cell lines and tissues. With this feature, these three databases provide a set of predefined hypotheses that could be used directly to screen for tissue-expressed, enriched and/or specific lncRNAs as well as protein-coding genes. This feature is important for in silico screening, as a researcher could obtain a set of interesting lncRNAs to be studied further in their favorite tissues.
As more and more studies are conducted for lncRNAs, it has become evident that lncRNAs are cell-type-specifically expressed more so than protein-coding genes [11, 56]. As different cell types built up a tissue, it is important that such information is provided. Of the databases listed in Table 1, Human Body Map lincRNAs (called ‘lincRNA-FISH catalog’) and NRED provide cell-type-specific expression of lncRNAs via in situ hybridization data while MTD offers such RNA-seq data. Given that it is possible to sequence at the single cell level [57–60], there will be more of such data sets to be included in the databases. However, as lncRNAs are known to be lower expressed than protein-coding genes [5, 8, 52], it might be difficult to comprehensively cover the transcriptomes of lncRNAs at the level of single cell; thus, it will be more helpful to include RNA-seq data of tissue compartments (e.g. hypothalamus of the brain) to the databases as in the case of MTD.
Taken together, although there are public databases for lncRNAs providing their expression patterns in various tissues, most of these databases fall short of offering a comprehensive profiling of lncRNAs to cover their cell-type-specific expressions. Such information will be important especially for in vivo studies, as it will give a clue about where to find phenotypes on ablating a lncRNA as in the case of knockout mice [61–63]. Furthermore, for the utilization of model organisms, it is of utmost importance that the databases provide the information regarding the evolutional conservation of lncRNAs to allow for more functional studies. More importantly, most of the databases are released to the public without validation experiments, especially for functional assays beyond the expression profiling by RT-PCR experiments, for example, leaving the users to validate the content of the databases by performing biological experiments, which are costly and time-consuming. From the perspective of product building, it is not a good practice to release a product (i.e. database) without the extensive validation of its database content, in this case, by performing biological validation experiments.
Building of RenalDB for kidney-related RNA expressions
Provided the above situation, we attempted to build an expression database for lncRNAs and protein-coding genes across organisms to offer a comprehensive profiling of transcripts in one tissue. For this purpose, we chose kidney as a model, as this tissue is present in all vertebrates, is related to human health (e.g. diabetes) and has a modest but diverse set of RNA-seq experiments available. Kidneys are complex organs that perform many important functions, including filtering of blood for excess organic molecules and regulating blood pressure via the secretion of hormones. To maintain their various functions, they are composed of many cell types, which require careful profiling for transcriptomes. Furthermore, there exists the most widely used cell line called HEK-293 cells [64], which allow for easy experimental manipulation (e.g. transfection of plasmids and siRNAs).
To collect RNA-seq data sets of kidneys, various databases (e.g. Gene Expression Omnibus DataSets, PubMed and SRA) were searched manually. Because the qualities of the genomic sequence information and gene annotations vary across organisms, we chose three well-annotated organisms for further study, which are human, mouse and zebrafish (Supplementary Table S2). Available data sets included whole kidney, kidney sub-tissues and isolated cell types, and even single cells. To this end, we propose a database and analysis programs using logic programming. Logic programming is a programming paradigm based on formal logic, using a set of logical sentences consisting of facts, rules and queries to solve a given problem [65]. For example, consider a transcript expressed in the renal cortex. The renal cortex is located within kidneys. When sequencing whole kidney under the same conditions, the same transcript should be expressed (Figure 2A). One could even descend to the level of cell types (e.g. endothelial cells isolated from interlobular arteries, which are located within the kidney cortex). Similarly, all sequences expressed within these endothelial cells are expressed in the kidney. Furthermore, it is well known that high abundance sequences can overwhelm lower abundance sequences. Thus, logic programming can be useful tool for integrating RNA-seq data at different hierarchical levels and beyond. This can be accomplished by modeling the anatomical and experimental relationships (Figure 2B), creating rules to define various types of expression characteristics (Figure 2C) and then using queries to determine the expression characteristic of a given RNA (Figure 2D).
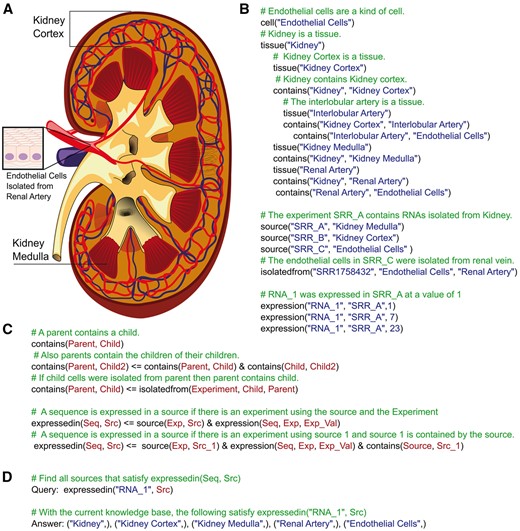
Logic programming. (A) Kidney anatomy. The original image was obtained from (Blausen.com staff. ‘Blausen gallery 2014’. Wikiversity Journal of Medicine 1 (2); doi:10.15347/wjm/2014.010; ISSN 20018762) and modified by showing only anatomical terms related to this figure. The image of endothelial cells was obtained from https://commons.wikimedia.org/wiki/File:Diagram_of_epithelial_cells_CRUK_033.svg. (B) A sample knowledge base describing the kidney anatomy and experimental data relationships with natural language comments explaining what each Datalog statement represents. (C) Another knowledge base describing some simple logical relationships (i.e. ‘contains’ and ‘expressed in’) with natural language comments explaining what statement represents. (D) A sample Datalog query using the knowledge bases in (B) and (C) to determine expression of ‘RNA_1’.
The above concept is further extended in RenalDB through the advanced search functions, which can handle arbitrarily complex combinations of search tags and Boolean operators (‘and’, ‘or’, ‘not’). The search is used in the [LOCI] view (Figure 3A) and in the [VENN] view (Figure 3B). The [LOCI] view displays rows of sequences with Universal Genomic Accession (UGAs), names and other high-level descriptive data [9]. Clicking on a UGA will lead to the sequence view (Figure 3C). The sequence view contains detailed information about the corresponding sequence, such as general annotation information, links to other databases provided via CORS request with the UGAHash server (e.g. accessions will stay up-to-date automatically) [9] and, to the UCSC Genome Browser [66], associated GO terms and the corresponding links to the AmiGO 2 [20] database. Furthermore, the sequence’s expression data are available as a heatmap displaying expression strength with hierarchical tree structures by showing the ‘contains’ and ‘develops to’ relationships described by the logical models. Numerical values of expression profiles are also provided in the table format when [Numeric Values] tab is clicked. The samples in both of these views can be grouped or ungrouped based on sex, age and strain. The search is also used in the [VENN] view, allowing users to visualize up to three searches as a Venn diagram. The numbers shown in each Venn diagram are clickable. Once clicked, the list of associated genes and/or transcripts will be displayed in the [LOCI] view. Special attention should be paid to the power of the search, as it includes some of the logic programming capabilities. For example, searching for RNAs expressed in kidney (EXPRESSED:Kidney) will also yield RNAs not directly detected in the kidney but also those detected in some child components of kidney. Similarly, an RNA found to be specific in a child component of kidney will also be listed as ‘kidney specific’.
![Usage of RenalDB. (A) A [LOCI] view from RenalDB showing search query using search tags and Boolean operators. (B) Example of a query on the [VENN] view. (C) Example from sequence view showing the basic annotation data, the graphical expression overview for a gene, GO terms and homologs. The grouping of expression values can be modified using the checkbox list and updated by clicking the [GO] button.](https://oup.silverchair-cdn.com/oup/backfile/Content_public/Journal/bib/19/2/10.1093_bib_bbw117/2/m_bbw117f3.jpeg?Expires=1749421124&Signature=V1Eh1mT91oh1k4hcT7Rw2UAzFNx6j6fcoBtwKwr5srmfQ3m9W-3bld9xByrGcDNxdMo5a6Gs3CEplYCGkubEyhT4L9hTeE2~iiGIQNgs6xtrX1EZPAx2olgzw1VWmpuBgHr6InXwIJ4-WyAL71zVrIn-81YL8rfXLQWrqJIWwhS-rxdBnd-yWy-xkCs5P4zZLAqo3icBHDhgfFUxRGhfPJS7CkYbM8sg0ofKjOatNHVXJuv14Dx8wtdJM1NmSB53oJMTLWLdHzJii8rYHL3jKznX4BB0uDqqtBYYJUFUREresdjxhrUlJEl-Y9oWeTv5nazYqmufgVqrlwlFm9e6nw__&Key-Pair-Id=APKAIE5G5CRDK6RD3PGA)
Usage of RenalDB. (A) A [LOCI] view from RenalDB showing search query using search tags and Boolean operators. (B) Example of a query on the [VENN] view. (C) Example from sequence view showing the basic annotation data, the graphical expression overview for a gene, GO terms and homologs. The grouping of expression values can be modified using the checkbox list and updated by clicking the [GO] button.
Validity of RenalDB and functional data of lncRNAs
To validate the content of RenalDB, we screened for lncRNAs; more specifically, lincRNAs that are located in between protein-coding genes on the genome [3]. The reason for focusing specifically on lincRNAs (instead of sense overlapping lncRNAs, for example) is that it is experimentally difficult to separate the expression of target lncRNA from that of nearby protein-coding gene, as some of their sequences overlap and the likelihood of sharing their promoter sequences is high.
From RenalDB, we selected 22 lincRNAs that are expressed in the human kidney and performed RT-PCR experiments using cDNA generated from 10 human tissues to validate their expression patterns in the kidney. As a result, 18 of 22 lincRNAs are expressed in the kidney, and some are enriched in the kidney compared with other tissues (Figure 4). Of note, the sources of total RNAs are different from those of publicly available RNA-seq used included in RenalDB. Furthermore, we set the number of PCR cycles to be 35, which may result in not detecting lowly expressed lincRNAs. Based on the RT-PCR results and conservation among organisms, we chose two lincRNAs (LOC440173 and PAXIP1-AS1) and characterized them further.
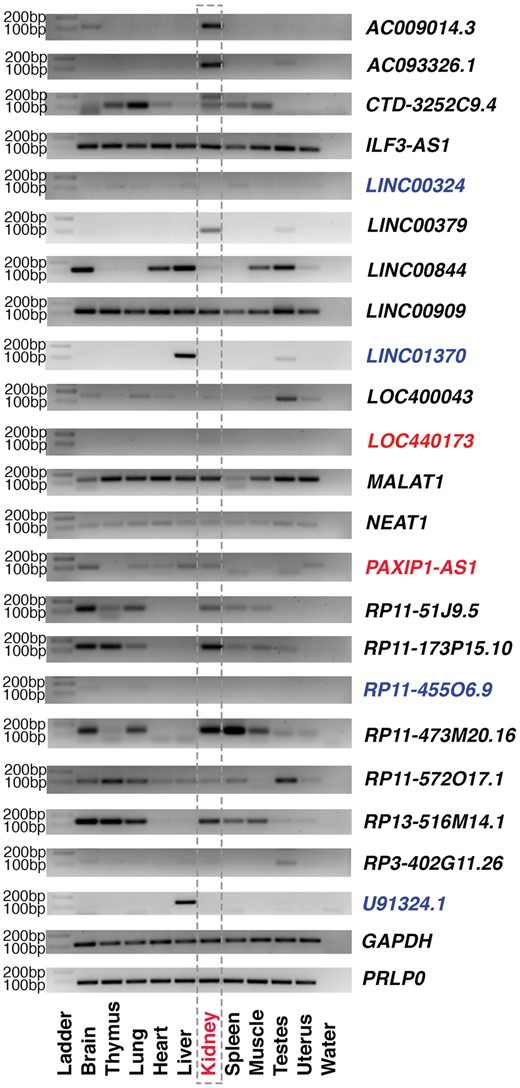
RT-PCR experiment of selected kidney-expressed lincRNAs. To be consistent, 35 cycles of PCR reactions were used for all primer pairs. GAPDH and PRLP0 were used as loading controls. Those lincRNAs whose expressions could not detected with 35 cycles of PCR reactions are marked in blue, while two lincRNAs used for further experiments are marked in red.
It is a well-known fact that many lncRNAs have distinct expression patterns in the cell (e.g. expressed exclusively in the nucleus). To determine subcellular localization of the selected lincRNAs, nuclear and cytoplasmic fractions of RNA were prepared from HEK-293 cells, and lincRNAs were detected by RT-PCR experiment (Figure 5A). The result indicates that LOC440173 is expressed in both the nuclear and cytoplasmic fractions, whereas PAXIP1-AS1 is exclusively detected in the nucleus.
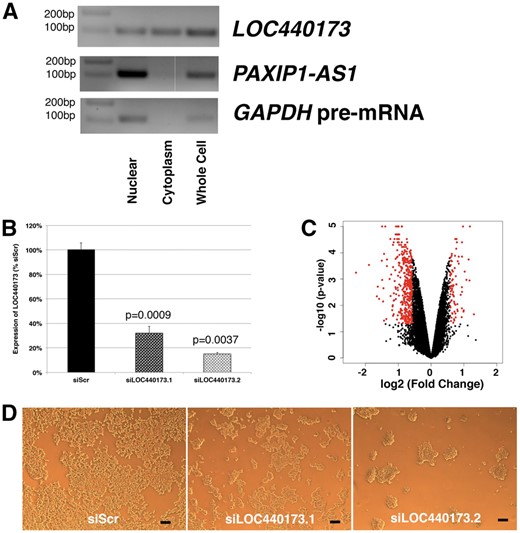
Expression of two selected lincRNAs and characterization of LOC440173. (A) Subcellular localization of LOC440173 and PAXIP1-AS1 in HEK-293 cells. For GAPDH, the primer pair targeting its intron between exon 2 and 3 was used. The representative image from three independent assays. (B) Efficiency of silencing by siRNAs; n = 3. (C) Volcano plot comparing silencing of LOC440173 and siScr. Genes selected above the threshold of 1.5-fold and p < 0.05 are colored in red; n = 2. (D) Morphologies of cells on siRNA transfection. The scale bar represents 100 μM.
Although the above expression profiling experiments are informative, biological functions of the selected lincRNAs are unknown without further experiments. To this end, LOC440173 was silenced by siRNAs. Compared with the control (siRNA against scramble control sequence, termed ‘siScr’ hereafter), the expression of LOC440173 was efficiently silenced (Figure 5B). From these samples, total RNA was isolated and subjected to microarrays (Figure 5C). When a threshold of 1.5-fold and p-value of 0.05 cutoff were applied, 80 up- and 375 downregulated genes were identified (Supplementary Tables S3 and S4). To these genes, GO analysis was performed (Supplementary Tables S5 and S6). Among upregulated genes, GO terms related to protein transport and cell division are enriched; while GO terms related to cell migration and growth are enriched among downregulated genes. These findings are consistent with the morphology of the cells, which revealed a reduction of cell numbers after LOC440173 silencing (Figure 5D), suggesting that LOC440173 is important for cell growth or cell survival.
Next, PAXIP1-AS1 was analyzed in a similar manner. Although its official name is ‘PAXIP1 Antisense RNA 1’, PAXIP1-AS1 does not overlap with the protein-coding gene PAXIP1 on the genome. After silencing of PAXIP1-AS1 (Figure 6A) followed by microarray experiment (Figure 6B), the same set of threshold values (1.5-fold and p < 0.05) was applied. There were 91 up- and 39 downregulated genes (Supplementary Tables S7 and S8). To these genes, GO analysis was performed (Supplementary Tables S9 and S10). Aside from various GO terms related to metabolic processes enriched among upregulated genes, many GO terms related to cell death are enriched in both up- and downregulated genes. To test whether silencing of PAXIP1-AS1 affects cell viability, cells were treated with hydrogen peroxide, and the surviving cells were counted and normalized to those of the corresponding siScr cells (Figure 6C). Compared with siScr cells, the survival of PAX1P1-AS1-silenced cells was improved, particularly if compared with cells after LOC440173 silencing. These experiments suggest that that PAXIP1-AS1 is a regulator of cell death. However, the mechanism of its action is unknown. To further elucidate the mechanism, we determined whether PAXIP1-AS1 could cis-regulate the expression of the nearby protein-coding gene PAXIP1. On silencing of PAXIP1-AS1, downregulation of PAXIP1 was recorded (Figure 6D). Given that Paxip1 (also known as ‘PTIP’) homozygous mutant mice die by embryonic day 9.5 via accumulation of DNA damage [67], the modulation of cell death-related genes on silencing of PAXIP1-AS1 might be owing to a decreased expression of PAXIP1. However, further research is required to clearly define this mechanism.
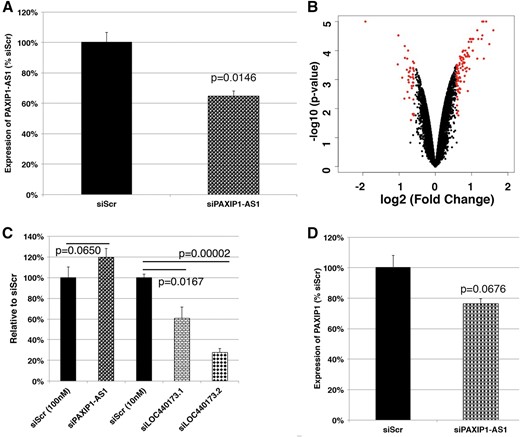
Characterization of PAXIP1-AS1. (A) Efficiency of silencing by siRNAs; n = 3. (B) Volcano plot comparing silencing of PAXIP1-AS1 and siScr. Genes selected above the threshold of 1.5-fold and p < 0.05 are colored in red; n = 2. (C) Cell viability on the treatment with hydrogen peroxide; n = 3. In the case of PAXIP1-AS1, the numbers of surviving cells were normalized to the corresponding siScr (100nM), whereas those of LOC440173-silenced cells were normalized to the corresponding siScr (10nM). (D) Expression of PAXIP1 on silencing of PAXIP1-AS1; n = 3.
Discussion
On the survey of public databases for lncRNAs, it is evident that most of the current databases do not provide the detailed profiling of lncRNAs for their cell-type-specific expressions at the genome-wide level. To offer a step forward for providing such information, we built a knowledge database RenalDB to comprehensively cover the transcriptomes of human, mouse and zebrafish kidneys. Although some databases (e.g. Expression Atlas [32] and GEO Profiles [33]) contain more data than RenalDB, none are able to filter data by tissue enrichment or specificity. Furthermore, RenalDB is the only one of these databases to use logic programing. Expression Atlas does not have an advanced search option, while GEO Profiles does offer an advanced search with many options; however, it suffers from a lack of curation. By curation we mean humans going over the data and resolving discrepancies in metadata. This poses a problem for preforming advanced searches. For example, consider simple metadata such as ‘sex’. One would expect the values to be something like ‘Male’, ‘Female’ or ‘Unknown’. However, the actual metadata is much more messy with multiple related headings and values. While building RenalDB, we encountered various headings, including SEX, sex, Sex, Gender, GENDER, mouse gender. The values under these headings contained various labels, such as M, Male, male, None, N, U, Mixed, pooled. This is the case of metadata heading with only a few possible answers, and yet, it became complicated. The sample source metadata tags are more complex, especially because many of the cell types and tissues have synonyms, for example, ‘Renal Cortex’ versus ‘Kidney Cortex’. We standardized all metadata within RenalDB using text similarity clustering with OpenRefine [68]. Furthermore, we extensively searched the GEO/SRA archives for all kidney-related samples. Owing to this situation, we only considered kidney-related metadata with high-quality samples available. The curated metadata can be found here: http://renaldb.uni-frankfurt.de/static/cit/data/samples_dump.20160210.tsv
When similar transcriptomics databases focused in the kidney were searched, there are only two databases currently available: Renal Gene Expression Database (RGED) [69] and Toxygates [70]. Both databases contain microarrays but not RNA-seq data, which is now increasingly used in the laboratories around the world. This fact alone makes RenalDB a valuable tool for researchers working in the field of nephrology. Furthermore, both RGED and Toxygates only contain the information for the selected sets of protein-coding genes that are on the microarray platforms that are being used. In comparison, RenalDB covers whole transcriptomes, including all protein-coding genes and lncRNAs currently being annotated by the most widely used informational database Ensembl.
In the field of nephrology, the following lncRNAs have been identified and studied in detail: Arid2-IR [71], H19 [72], HOTAIR [73], RCCRT1 [74], TapSAKI [75] and Xist [76]. Given that many lncRNAs are expressed in various cell types and parts of the kidney, more functional evidence is necessary to comprehensively understand the transcriptomes of kidney and their contributions to the functionalities of kidneys across organisms. Compared with the reports about the lncRNA databases, this study provides the functional data of lncRNAs along with the applicability of the lncRNA database itself. This point is important, as it should not be up to the users to verify the content of the database being built and introduced to the public, although the database itself might have been built using the previously published high-throughput data sets. It is imperative to note that it is the responsibility of the software developer and his/her team to provide the functional data of such database. In conclusion, this study should set the standard for the further building of bioinformatics tools with the confidence guaranteed to the users.
There are public databases providing transcriptomics data for expressions of lncRNAs.
There is a lack of cell-type-specific databases for lncRNAs targeting a specific tissue.
RenalDB provides a convenient way to screen for kidney, its sub-tissues and cell expressed, enriched and/or specific RNAs.
Experimental evidence helps demonstrate the validity of databases being introduced.
Supplementary Data
Supplementary data are available online at http://bib.oxfordjournals.org/.
Tyler Weirick is a senior Research Technologist at the University of Louisville and a PhD student at the Institute of Cardiovascular Regeneration (Uchida Lab), who is focused on elucidating the evolutional conservation of long noncoding RNAs (lncRNAs).
Giuseppe Militello is a senior Research Technologist at the University of Louisville and a PhD student at the Institute of Cardiovascular Regeneration (Uchida Lab), who is working with lncRNAs in the skeletal muscle.
Yuliya Ponomareva is a PhD student at the Institute of Cardiovascular Regeneration (Uchida Lab), who is working with lncRNAs in the heart and stem cells.
David John is a PhD student at the Institute of Cardiovascular Regeneration (Uchida Lab), who is developing computational algorithms and pipelines to identify RNA modification events.
Dr Claudia Döring is a bioinformatics scientist and laboratory manager of the RNA laboratory at the Dr Senckenberg Institute of Pathology, who is focused on gene expression and next-generation sequencing analysis especially in lymphoma diseases.
Prof. Dr Stefanie Dimmeler is the director of the Institutes of Cardiovascular Regeneration.
Dr Shizuka Uchida is an Associate Professor of Medicine at the University of Louisville and an Independent Junior Group Leader at the Institute of Cardiovascular Regeneration. His laboratory (‘Cardiovascular Bioinformatics’: http://heartlncrna.github.io) is interested in elucidating the functions of lncRNAs using dry and wet laboratory techniques.
Acknowledgements
The authors would like to thank Wenjun Jin for excellent technical assistance.
Funding
The LOEWE Center for Cell and Gene Therapy (State of Hessen) (to S.U. and S.D.); the Deutsche Forschungsgemeinschaft (SFB834 to S.U. and S.D.); the German Center for Cardiovascular Research (DZHK) (to S.U. and S.D.); and the startup funding from the Mansbach Family, the Gheens Foundation and other generous supporters at the University of Louisville (to S.U.).
References
Author notes
Tyler Weirick and Giuseppe Militello authors contributed equally to this work.
