


Abstract
Genome-wide association studies are moving to genome-wide interaction studies, as the genetic background of many diseases appears to be more complex than previously supposed. Thus, many statistical approaches have been proposed to detect gene–gene (GxG) interactions, among them numerous information theory-based methods, inspired by the concept of entropy. These are suggested as particularly powerful and, because of their nonlinearity, as better able to capture nonlinear relationships between genetic variants and/or variables. However, the introduced entropy-based estimators differ to a surprising extent in their construction and even with respect to the basic definition of interactions. Also, not every entropy-based measure for interaction is accompanied by a proper statistical test. To shed light on this, a systematic review of the literature is presented answering the following questions: (1) How are GxG interactions defined within the framework of information theory? (2) Which entropy-based test statistics are available? (3) Which underlying distribution do the test statistics follow? (4) What are the given strengths and limitations of these test statistics?
Introduction
Genome-wide association studies are moving to genome-wide interaction studies, as the genetic background of many diseases appears to be more complex than previously supposed. Specifically, complex diseases are not caused by one single but by many genetic variants that potentially interact with each other. Unless these variants also have strong main effects, they are unlikely to be identified using standard single-locus tests. Thus, many statistical approaches have been proposed to detect gene–gene (GxG) interactions, or, more precisely, interactions between genetic variants.
These include traditional approaches, such as regression methods [1], and more novel approaches, such as multifactor dimensionality reduction (MDR) [2, 3, 4] or random forest [5]. Moreover, information theory-based methods are emerging, inspired by the concept of entropy and other therefrom derived measures. While entropy and related measures have already been introduced in the middle of the past century [6, 7], Jakulin and coauthors applied these quantities to interactions studies in 2003 [8, 9], and Moore et al. [10] were the first to introduce entropy to the realm of GxG interactions in 2006. The information theory-based methods are suggested as particularly powerful and, because of their nonlinearity, as better able to capture nonlinear relationships between quantities. Generally, these approaches enjoy a good reputation owing to their model freedom and their capability to quantify or even amplify nonlinear relationships through the basic function of entropy. However, the proposed entropy-based estimators differ to a surprising extent—they even disagree on the basic definitions of interactions from the information theory point of view. Also, although entropy-based measures for interactions are available, it is not always clear how to construct a proper statistical test based on these measures, i.e. how a test statistic can be defined and which distributions it follows under the null and/or alternative hypothesis, respectively.
In summary, the following questions are open: (1) How are GxG interactions defined within the framework of information theory? (2) Which entropy-based test statistics are available? (3) Which underlying distributions do the test statistics follow? (4) What are the given strengths and limitations of these test statistics? In addition, for practical applications, it is important to understand for which study designs a given entropy-based estimator can be used, and for which test statistics computationally reasonable implementations are available.
To answer these questions, we performed a systematic review of the literature. The results of the search motivate the following article structure: First, in the ‘Definitions and methods’ section, we summarize some fundamental definitions of genetic interaction and information theory, and describe in details our systematic search of the literature. The main results are listed in Table 2, which tabulates a visual summary of all the results, grouped by the underlying information theory-based quantity. The ‘Results for studies on binary traits in unrelated individuals’ and ‘Results for specific study designs’ sections describe the main results in detail. In particular, the ‘Results for studies on binary traits in unrelated individuals’ section is devoted to information theory estimators for the study of a binary trait in unrelated individuals. Here, entropy-based estimators are presented with their strengths and limitations, with information about underlying distributions of test statistics and implemented software, if available. The ‘Results for specific study designs’ section introduces further entropy-based estimators that were proposed for specific study designs, such as family studies. Finally, the ‘Conclusions’ section gives a final evaluation of the methods and some general suggestions on how to choose between the presented estimators when searching for genetic interactions.
Definitions and methods
GxG interactions
We begin by specifying how GxG interactions may be defined. For the general notation, we consider a diallelic genetic variant G such as a single nucleotide polymorphism (SNP) coded as 0, 1 or 2 for the number of minor alleles. Throughout the following, genetic variants are denoted by where take values in the total sample of the genetic variants.
Moreover, we mostly consider for simplicity a binary phenotype P coded as 0, 1 for controls and cases, respectively, so that ‘phenotype’ refers in the first instance to the presence or absence of disease. However, some results will also be shown for the situation of quantitative traits (in the ‘Association with quantitative traits’ section).
Throughout the literature, heterogeneous definitions of interactions exist in the context of genetics in the fields of biology, medicine, biochemistry and biostatistics. It is beyond the scope of this work to detail these, for more information we refer the reader to[1, 11]. For our aims, let a GxG interaction be present as soon as a genetic variant influences the ‘effect’ that another genetic variant has on a trait of interest. This approach has not the ambition to be a precise definition of GxG interaction but to provide a general framework to comprehend many different situations. In specific settings, the magnitude of an interaction directly depends on how the effect is modeled, e.g. using an additive or a multiplicative model. Moreover, to distinguish this from haplotype effects, we assume for the sake of convenience that the two variants are located on different chromosomes or at least are physically distant from each other. Finally, let us assume throughout the whole article that Hardy–Weinberg Equilibrium holds for the control population. Indeed, in the searched literature this is not always specified.
Different study designs have been suggested to be used to detect GxG interactions, which are reviewed in detail in the literature [11]. In a simplified way, we distinguish between the use of data from family members and from independent individuals such as in the classical case-control or cohort design. For interactions, in some situations it may be possible to use a case-only design in which the association between the two variants in only the cases indicates GxG interaction.
Information theory definitions
In this section we summarize the fundamental definitions in information theory to prepare the subsequent definition of entropy-based estimators. For this, we consider two discrete random variables X1 and with potential states and respectively. The probability mass function of one variable X is given by p, where and the joint probability of two variables is denoted by The marginal probabilities are and for X1 and respectively. Figures 1–6 illustrate six fundamental definitions giving their formal mathematical expressions and visualizing them by Euler–Venn diagrams as established procedure for illustration, see for instance [12].
![H(X1): Entropy of a random variable X1:=E[ log2(1P(X))]=−∑i=1mpi log2(pi)](https://oup.silverchair-cdn.com/oup/backfile/Content_public/Journal/bib/19/1/10.1093_bib_bbw086/5/m_bbw086f1.jpeg?Expires=1749719171&Signature=3GfY5H-64MAKhllYyu~QRIgWsYpN2HTUQvLFzzX4FiEOFoxOe9v3~VHZC79uPLZ4n2H8gZHoE4O1OxyW0GrljSDnOriHupjEd2lIchWlQzgU~9wgWwHHqMzKPJRFqesTV7HxixlHdmewgErJdkMZ7cQY-AbhLPiJDJlFG~TnB3uZUWzky2cWK-e~y6fDDqY-JORJLJ7igFCch4fnbohZo2ftIScg2Vo4bnueDF7SWzZA15XaITW2IE3vIT2FltFeiF2Lm5GNUwZo~-zL-9Ldna5LjPPdA2LzVtSUGO9CdZAzPfG1RxFKd-kEvGIyK9wDAwl~QK1HuRpRcd1cTKb~8A__&Key-Pair-Id=APKAIE5G5CRDK6RD3PGA)
: Entropy of a random variable X1
![H(X1,X2): Joint entropy of the two random variables X1 and X2:=E[ log2(1P(X1,X2))]=−∑i=1m∑j=1m′pij log2(pij)](https://oup.silverchair-cdn.com/oup/backfile/Content_public/Journal/bib/19/1/10.1093_bib_bbw086/5/m_bbw086f2.jpeg?Expires=1749719171&Signature=krPU1xYnESxREIi9ExKIA30CNeHlvKvfadVo5AaleEj4DL8pdDg7Ys0QOBTAu5CfZM8fr4BOlONDQw2fcaBfsefdFpPRluDcwXaz4fKiVmd7SwnCsIwvmioRiJZ0sudppQ0mzOZGQOxMdurTiO1dB88kmeifmKhrErnYrzJdzdF0uC1nPMSPMeEG4krUCBxO5dfq528yMeZL95n4PWZiaKd5hDRuUaiwngmNkUW6ViVPP0yTdnUEc6rK5NgfN355xRTN8p0UD3~fS1rzcAC0zTDXuVJGdeH3ElWkoeacOxovwN27kdZYl2lRL9pYbGk1QgIIKs3xkzR8~k8ULH~RFA__&Key-Pair-Id=APKAIE5G5CRDK6RD3PGA)
: Joint entropy of the two random variables X1 and X2
![H(X1|X2): Conditional entropy of the variable X1 given the variable X2:=E[ log2(P(X2)P(X1,X2))]=−∑i=1m∑j=1m′pij log2(pijp·j)=H(X1,X2)−H(X2)](https://oup.silverchair-cdn.com/oup/backfile/Content_public/Journal/bib/19/1/10.1093_bib_bbw086/5/m_bbw086f3.jpeg?Expires=1749719171&Signature=Zef0zA8vJyXmqug3qR0WbsN069fM4sOZt9W3fc5u1XljmCPqt7AGDv1XxuzYRHRwaMFATlgXFNcuF73x419vCxtANow8FQiLrwwPw3hyG5ttgWBkcGLQtesokX48LUvJkCIj2v5eqMuQAUxGsE27bLafjbLlD9GjMQ4L-PcDbpePAxjOV5yrx0OHxudxUZwfq35Inmfk6OWfVhZLHohUd0olcapR5seJDhJwuFTd0aFOLZn3LaOajxk~vB-9m5Nl42gk3XrdijqEvMKcFA8XOGBzZ6QnTg7vjRxAgFmBD1yk2C6dWkJlIZcPtm-fQ1IMbz43bmhUbJEjVlbcvkdDGw__&Key-Pair-Id=APKAIE5G5CRDK6RD3PGA)
: Conditional entropy of the variable X1 given the variable X2
![I(X1,X2): Mutual information of the variables X1 and X2:=E[ log2(P(X1,X2)P(X1)P(X2))]=∑i=1m∑j=1m′pij log2(pijpi·p·j)=H(X2)H(X2|X1)=H(X1)H(X1|X2)](https://oup.silverchair-cdn.com/oup/backfile/Content_public/Journal/bib/19/1/10.1093_bib_bbw086/5/m_bbw086f4.jpeg?Expires=1749719171&Signature=jdncyvOphikm2fQTDhf7MIuCH~6XFK2lSUoFweGQxMeucW7cLXC-NlcFrX0EAlR6B6bTeWVkigaZbvgsmUQuoYZ99MZvxQ1MhQC3-L-FnoDcpNf4Do~r1URHEjwGc7KSbJjjz52QXMrQIxCvMuEoXTf5VDbvQlhsxWxph7F-clvPVuB62KZfxXz2AgnBox1nyOTeMG~UYLiBHsIJiRonjoqk~1mMoR8QFaagtqdZ8U9Qk6M~UXIGMMHNNLkoaus3e4Mg8llylqFeOjmdd5SqbzSoMgI~yqxZcFblmtM20NTa-h2ECBNgGp1Y-9ny6y6~oZ7ayMXhWM6yakgpY3zi~w__&Key-Pair-Id=APKAIE5G5CRDK6RD3PGA)
: Mutual information of the variables X1 and X2
: Total correlation information of three random variables
: Three-way interaction information of three random variables
The most fundamental concept is the ‘Shannon entropy’, first introduced by Shannon [6], which aims to quantify the uncertainty within a random variable (see Figure 1). Formally, it is defined as minus the logarithm of the probability distribution of this variable. This leads to the following properties (cf. [13]):
The entropy is zero when one outcome is certain.
The larger the uncertainty about a variable, the larger the entropy.
Given two probability distributions defined over the same range, the larger entropy will be assigned to the wider and flatter distribution.
For independent variants the definition of entropy by the logarithm is especially convenient because in this case it is additive.
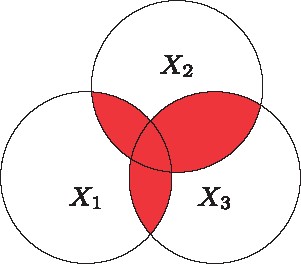
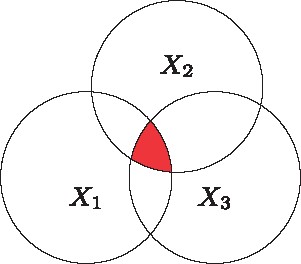
For three variables, it is necessary to distinguish between the total extent of dependence among the three variables, which is the so called ‘total correlation information’ (TCI; Figure 5), and the amount of information common to all variables but not present in any subset alone, which is the ‘three-way interaction information’ (3WII; Figure 6).
Both the TCI and the 3WII are generalizable to k-way interaction information (KWII) and the k-way TCI, respectively, and these quantities were introduced by McGill [7]. The KWII represents the gain or loss of information owing to the inclusion of additional variables in the model. It quantifies interactions by representing the information that cannot be obtained without observing all k variables at the same time. Different from the bivariate case in which the mutual information can be at most nonnegative, the KWII can also become negative. A positive value of the KWII is termed synergy between variables, while a negative value is named redundancy. In this sense, a synergy quantifies the positive gain in information of k – 1 variables owing to the knowledge of the kth one, while a redundancy means that the kth variable did not add information to the previous ones. However, synergy and redundancy do not have unique definitions, as we specify again later in the ‘Synergy and redundancy’ section.
Systematic search of the literature
In May 2015 different bibliographic databases were systematically reviewed drawing on the PRISMA (Preferred Reporting Items for Systematic Reviews and Meta-Analyses) Statement [16] to identify information theory-based quantities suggested for detecting GxG interactions. Articles were selected that describe the development or methodologically discuss entropy-based estimators to detect GxG interactions. Thus, we did not consider articles
in which entropy-based estimators were used to detect genetic association, i.e. main effects of association between a single genetic variant and a phenotype,
or if they presented only an application of entropy-based estimators on real data.
The complete search process was documented, and Table 1 details the search strategy. Owing to the plurality of terms addressing GxG interactions, a number of searches with different keywords were carried out in PubMed. On the other side, for the search in Google Scholar we tried to limit the number of false-positive findings by using only the most precise search terms. In this case, the results were sorted by their relevance, and we considered only the first 365 findings.
Hits from the four systematic searches
| Search | Keywords combination | Database | Date | Hits |
|---|---|---|---|---|
| 1 | (entropy AND genetic) AND interaction (with activated filter limited to humans) | PubMed (www.ncbi.nlm.nih.gov/pubmed) | 23 June 2015 | 51 |
| 2 | entropy ‘gene-gene interactions’ (excluding patents and citations) | Google Scholar (https://scholar.google.de/) | 23 June 2015 | 680 |
| 3 | epistasis entropy (limited to humans) | PubMed | 2 June 2015 | 18 |
| 4 | (entropy AND gene) AND interaction (limited to humans) | PubMed | 28 May 2015 | 67 |
Results
In the search, 29 articles were identified as shown in Figure 7. These may be grouped into the following sections with respect to entropy-based definitions of interactions: Interactions defined with the help of mutual information (Figure 4) are illustrated in the ‘Pairwise interactions: Information gain’, ‘Pairwise interactions: Relative information gain’ and ‘Synergy and redundancy’ sections; interactions defined with the help of three/k-way interactions (Figure 6) are described in the ‘Third order interactions: 3WII, TCI and PAI’ and ‘Interactions of higher order’ sections; finally, interactions defined with the help of other approaches will be given in the ‘Rényi entropy’ and ‘Maximum entropy conditional probability modeling’ sections. For an overview, Table 2 lists all findings giving the entropy-based quantities with literature references, the entropy-based definitions of interactions, the availability of a test statistic, of simulation results as well as of an implementation. Specifically, references are ordered in the table by appearance; estimators used in more than one reference are listed repeatedly if availability of a test statistic, simulations or implementation differ in the corresponding publications.
Results from the systematic literature search
| Entropy-based quantity | Reference | Quantity to estimate | Test statistics | Simulations | Implementation |
|---|---|---|---|---|---|
| Information gain | [17] | Yes | Yes | Yes | |
| [18, 19] | Yes | Yes | No | ||
| [20] | Yes | Yes | Yes | ||
| Conditional mutual information | [21] | Yes | Yes | No | |
| Relative information gain | [22] | No | Yes | Yes | |
| [23] | Yes | Yes | No | ||
| [24] | Yes | Yes | Yes | ||
| [20] | Yes | Yes | Yes | ||
| Three-way (k-way) | [17] | Yes | Yes | Yes | |
| Total correlation Information | Yes | Yes | Yes | ||
| [25, 26, 27] | No | Yes | No | ||
| [28, 29, 30, 31] | No | Yes | No | ||
| Strict information gain | [32] | ||||
| Yes | Yes | Yes | |||
| phenotype-associated information | [25, 26, 27] | ||||
| [30, 31] | No | Yes | No | ||
| Synergy | [33] | No | No | Yes | |
| [34, 35] | No | Yes | Yes | ||
| Rényi entropy | [15] | ||||
| where | Yes | Yes | No | ||
| Maximum entropy conditional | |||||
| Probability models | [36, 18] | Yes | Yes | No | |
| Case-only design | [37, 15] | H (P) | Yes | Yes | No |
| Quantitative trait locus studies | [31] | No | Yes | Yes | |
| [38] | No | Yes | Yes | ||
| [39] | Yes | Yes | No | ||
| Family studies | [40] | No | Yes | Yes |
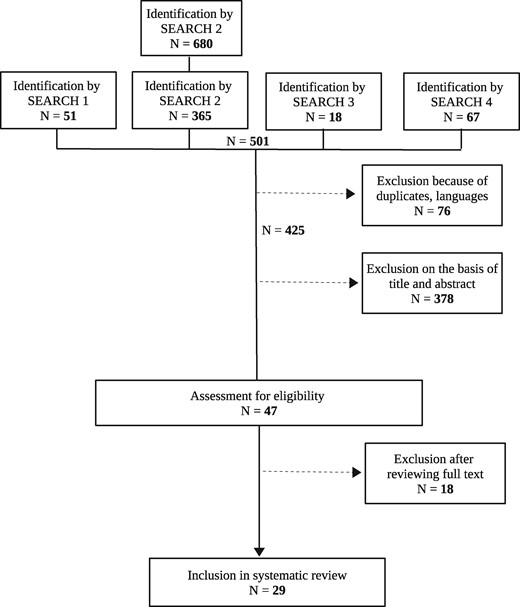
Flow diagram of the search process.
Results for studies on binary traits in unrelated individuals
Pairwise interactions:information gain
Four of the 29 articles of the systematic search deal with estimators to detect pairwise interactions that are based on a so-called information gain (IG).
By estimating all probabilities emerging in by counts, the corresponding final test statistic for testing for interactions is defined as the estimated normalized by a specific quantity of variance type. The closed expression of the estimator can be found in the Appendix. The test statistic is asymptotically centrally or non-centrally chi-square distributed under the null or the alternative hypothesis, respectively, with one degree of freedom.
The merit of this article lies not only in the clear definition of second-order genetic interactions from the information theory point of view, but also in the construction of a statistical test complete with formulations of null and alternative hypotheses and a proper test statistic with a corresponding distribution. Since 2015, also an implementation of the estimator is available, and the corresponding R code can be found on http://www.nichd.nih.gov/about/org/diphr/bbb/software/fan/Pages/default.aspx
As a reviewer pointed out, the can be interpreted as contrasting correlations between genetic predictors in cases with those in controls. In this sense, it has a strong link with a ‘case-only’ design (compare also the ‘Case-only design’ section).
A corresponding estimator with its asymptotic distribution is given in Kwon et al. [20] citing results by Goebel et al. [41]. The estimated asymptotically follows a gamma distribution under the null hypothesis of independent variants. The most important contribution of Kwon et al. [20] lies in the freely available and fast implementation called IGENT, which is written in C ++ (http://statgen.snu.ac.kr/software/igent/). IGENT can be used for an exhaustive as well as for a stepwise search of interacting pairs, depending on whether every possible pair is systematically tested or whether a genetic variant is admitted for pair building only if it shows a main effect. IGENT can be seen as an association test while allowing for interactions, as it calculates the entropy of a phenotype twice, first per se and second given an interacting pair.
This quantity there is called interaction gain rather than IG. It has a similar structure as where the idea is to evaluate the correlation between genetic variants given (or not) the disease information. The authors emphasize that their estimate requires neither main effects nor any specific genetic model (i.e. additive, recessive, etc) to identify an effect. Moreover, for detecting interactions, they follow neither an exhaustive nor a stepwise approach, but rather they introduce a strategy for parallelization: First, genetic variants located on the same chromosome are divided into two groups depending on whether they are in a gene or between genes. Then, chunks of SNP pairs are formed by pairing SNPs within the same gene, pairing SNPs in different genes, pairing SNPs in a gene with intragenic SNPs and pairing intragenic SNPs on different chromosomes. These chunks are then tested for interaction at the same time (parallelization), estimating their interaction gain (replacing probabilities by counts). After this, variants in linkage disequilibrium are discarded, and the remaining pairs are reduced by cutting at a given threshold value. By synchronous calculations of many interaction gains in parallel, the entire test procedure is speeded up, while maintaining accuracy.
Chen et al. [18] introduce the same IG as mentioned above, i.e. However, they do not explicitly describe the estimation of this quantity. Instead, the main objective was a comparison of the performance of different methods for detecting interactions, including MDR, logistic regression (LR) and an estimation based on . These competitors were evaluated with regard to type I error rate, power and computational complexity. For the -based estimates, the authors conclude that they successfully detect interactions with strong main effects but miss many interacting variants at an acceptable rate of false positives. However, this behavior is not significantly worse than that of the other analyzed methods. Moreover, as expected, the power of the tests varies under different genetic models as a function of penetrance, minor allele frequency, linkage disequilibrium and marginal effects; again, the other methods did not significantly differ in their behavior. In particular, the magnitude of the main effect influences the power of the tests. In summary, the authors emphasize that the estimate can detect some ground-truth SNPs but has only modest power to detect the entire set of interacting SNPs.
The authors argue that the inflation of the type I error was considerably reduced by their strategy. Finally, the authors analyze the type I error depending on the disease prevalence or the case/control ratio, coming to the conclusion that neither the prevalence nor the case/control ratio influence the type I error considerably.
Finally, we remark that many articles propose the calculation of information-gain-type quantities for feature selection and other aspects in the context of genetic analyses; however, these are beyond the topic of this review.
Pairwise interactions:relative information gain
Our literature search identified four articles that deal with pairwise interactions based on the so-called relative information gain (RIG).
The RIG by Dong et al. [22] has a similar structure as the RIG above. In particular, the ‘Entropy-based SNP–SNP interaction method’ (ESNP2) is developed here to detect GxG interactions with the help of the RIG, while the extension ESNP2-Mx enables in addition a best fit to a genetic model. The program, implemented in Java, is free for download (http://www.biosino.org/papers/esnp2/).
An extension of the ESNP2 method can be found in Li et al. [42], which describes the ‘Gene-based Information Gain Method’. This extension considers interactions between grouped variants, typically grouped by genes, covering the case that the two genes have different length.
Third-order interactions: 3WII, TCIand PAI
Estimators for third-order interactions are the topic of 9 of the 29 results from the systematic literature search.
Some theoretical properties of TCI and PAI are given by Tritchler et al. [30]. Moreover, Chanda et al. [27] present an algorithm, called CHORUS, based on PAI to detect the GxG interactions on quantitative traits. This will be described in detail in the ‘Association with quantitative traits’ section.
Interactions of higher order
Both 3WII and TCI can be extended to the KWII and total correlation, respectively, which can be used to detect interactions of higher than third order. Similar to the lower-order situations, Fan et al. [17] compare the estimated KWII and total correlation in the cases and in the general population, respectively, to detect k interacting variants associated with a disease.
Furthermore, Chanda et al. [45] introduced a KWII initially as a metric for visualizing GxG interactions. Owing to its specific aim of visualization, that article is not directly relevant for this review, but Chanda et al. [25] subsequently construct an algorithm called AMBIENCE to detect higher order interactions by using KWII and PAI. In particular, AMBIENCE requires as input the number θ of combinations retained in each search iteration and the number of total iterations, τ. To explain the algorithm in a simplified example, suppose we have n = 10 genetic variants, and we fix θ equal to 2 and τ equal to 5. This means that we are interested in interactions of fifth order, and we want to retain maximally the two ‘relative best results’. AMBIENCE will start by calculating the PAI for each of the 10 variants. Then, the θ = 2 best results (i.e. the two highest PAIs) will be retained, and for these variants interactions of third, fourth until τ = fifth order will be calculated. AMBIENCE hence delivers combinations ranked by PAI.
Another algorithm, AMBROSIA ([29]), reuses the results from AMBIENCE, i.e. the combinations with highest PAI, and tries to decide which of these combinations essentially explain the phenotype, discarding the redundant ones. Moreover, Sucheston et al. [28] compare these results with other common methods such as MDR, concluding that the information theory-based methods have a considerably higher power. However, Lee et al. [46] show recently that higher power often comes at the cost of lower specificity, so that some signal is erroneously identified. We address this problem again in the conclusions.
Based on KWII, Shang et al. [47] developed a software named EpiMiner, which uses a three-stage approach for detecting and also visualizing GxG interactions. This software is available on https://sourceforge.net/projects/epiminer/files/. In its first stage, KWII is calculated by supposedly replacing probabilities by frequencies. A previously fixed number of variants is then passed on to the second stage, either user-specified or based on classification by support vector machines. In stage two, permutation tests are conducted on the selected variants sequentially to search for GxG interactions, and the results are ranked by the P-values. The third stage is then reserved for a visualization of the results.
Knights and Ramanathan [48] address the problem of over-dispersed count data, translated in a Poisson-distributed phenotype. The authors use an estimator of KWII type and compare its results with those from a Poisson regression. A Web site with software written in Java is available (http://pharmsci.buffalo.edu/computational_software/murali_1/download/). An estimator is not given explicitly but only the definition of entropy for a Poisson distributed phenotype.
Finally, Brunel et al. [40] consider interactions of higher order by calculating the mutual information between a set of markers with the phenotype, where the set of markers is determined by the following algorithm. First, the set contains just one marker, which is significantly associated with the phenotype, and then a new marker is added to the set; the mutual information calculates whether the new marker adds new information. If yes, a further marker is added to the set; if not, the marker is removed. In this sense, the authors speak about forward and backward steps, depending on whether any further marker is left in the set of is removed.
Synergy and redundancy
Four of the 29 findings from the systematic search deal with estimators based on synergy and redundancy. As already stressed in the ‘Information theory definitions’ section, other than the mutual information the KWII can also become negative, so that up to three variables one can consider synergy and redundancy between variables. However, these concepts do not have a unique definition and interpretation, which is described in the following.
Curk et al. [34] provide an algorithm and a software for detection of interactions by synergy based on . To save computation time, an exhaustive approach is avoided in that a heuristic is introduced that involves a threshold for identification of the ‘best’ low-order interactions before searching for interactions of higher order. The software tool can be found on http://snpsyn.biolab.si.
Moore and Hu [35] use synergy and redundancy for summarizing and visualizing interactions. The synergy of many genetic variants is used for building epistasis networks, and these networks are visualized by the open-source software ViSEN (Visualization of Statistical Epistasis Networks) [49], following Hu et al. [50], who were the first to introduce networks to visualize entropy-based measures of GxG interactions.
Rényi entropy
Maximum entropy conditional probability modeling
Based on the principle of maximum entropy by Jaynes [51], Maximum Entropy Conditional Probability Models (MECPM) is described in its general form by Miller et al. [36], p. 2479: ‘When building a probability model, one should agree with all known information while remaining maximally uncertain with respect to everything else’. Miller et al. [36] transfer this idea to genetics replacing the ‘known information’ by the pairwise probability of disease presence and a particular genotype for a given genetic variant. Maximum uncertainty is obtained by selecting the probability distribution of the phenotype that maximizes Shannon’s entropy function but still ensures agreement with the known information ([36], p. 2479).
Chen et al. [18] implemented MECPM as well as seven other methods (including IG [10]) comparing their performances by the number of truly and falsely discovered markers. They found that MECPM performs well in particular by detecting interactions with moderate effects and at an acceptable rate of false positives. Moreover, the authors generally conclude that the power of all the tests varies as a function of the penetrance, minor allele frequency, linkage disequilibrium and marginal effects.
Results for specific study designs
As described above, the majority of entropy-based methods for detecting interactions pertains to a specific study design, namely, the analysis of unrelated individuals with regard to a binary phenotype, and the phenotype is associated with genotypes of diallelic genetic variants. In addition to that, a few articles were concerned with deviations from this design, and these will be described in the following.
Case-only design
Two of the 29 results of the systematic review deal explicitly with estimators conceived for a case-only design. In this design, an association between the two genetic variants within the cases can be interpreted as a GxG interaction if the prevalence of the disease is low and if the investigated genetic variants are independent from each other in the general population. The recognized advantages of a case-only design compared with the more common case-control design are that (i) a smaller sample size is required and (ii) it might be possible to eliminate selection bias by avoiding to select controls in the first place.
For this constellation, Kang et al. [37] generally express genetic interactions by the difference between joint entropy and entropy by the marginal probabilities under the assumption of no interaction. In addition, they also present a generalization for interactions of higher order as well as a modification to express the magnitude of interaction on a normalized scale, using the ratio rather than the difference between entropies.
Generally, this approach is complete with a quantity to measure interaction, hypotheses to be tested, corresponding test statistics and asymptotic results. Furthermore, tests for interactions and tests for association when allowing for interactions are presented. However, the approach relies on strong assumptions that may or may not be fulfilled. Moreover, the case-only design can be highly sensitive in case of departure from the independence assumption between genetic variants, as e.g. pointed out in [52].
As mentioned in the ‘Rényi entropy’ section, de Andrade and Wang [15] also propose a case-only design. In fact, the authors describe that their test statistic for the case-only design is the same as in [37] as soon as i.e. when the Rényi entropy becomes equal to the Shannon entropy. For the asymptotical distribution of the test statistic is not known and will be approximated by de Andrade and Wang [15] with the help of Monte Carlo simulations.
Association with quantitative traits
We identified three articles that explicitly deal with estimators conceived for association with quantitative traits instead of a dichotomous phenotype. First, Chanda et al. [27] extended the previously published algorithm AMBIENCE [25] to a new algorithm called CHORUS, designed specifically for quantitative traits that are normally distributed. Subsequently, CHORUS was extended to the algorithm SYMPHONY in [31], which is designed for vectors of quantitative traits. The principle of both algorithms is the same: Calculate the first order PAI and retain the θ combinations with the highest PAI. For these θ combinations, then calculate the PAI of next order and repeat this procedure up to order Finally, calculate the KWII for all these winning combinations, which render the test statistic. Thus, CHORUS performs a stepwise search for interacting pairs associated with a multivariate normally distributed phenotype in the presence of main effects.
In a more general approach, Yee et al. [39] introduce nonparametric entropy estimates that renounce any assumptions about the distribution of the quantitative phenotype or about its regularity. In particular, the entropy estimators are inspired by sample-spacing techniques of Miller and Fisher [53], and they were modified for specific challenges with small samples in specific combinations, which may occur in the situation of combining loci with small minor allele frequencies.
Analogously to the approach for a binary phenotype [23] that was described above (section ‘Pairwise interactions: Relative information gain’), the difference between the entropy and the conditional entropy yields an IG of type , which is then modified and standardized to a RIG. Finally, replacing the entropy and the conditional entropy by their sample-spacing estimates, a test statistic is given for interacting variants associated with a quantitative phenotype. The plausibility of the proposed estimator was examined by simulations, where the phenotype was simulated to follow nine different distributions. Moreover, its performance was compared with two MDR variants, and it was applied to real data. The results of MDR and of spacing entropy were comparable.
For this, first the conditional mutual information of two genetic variants taken together given the phenotype is normalized by the maximum between the two conditional entropies of each genetic variant alone given the phenotype. Then a corresponding normalized quantity is calculated for the mutual information (without conditioning by the phenotype), and these two NMI values are subtracted from each other. Thus, takes on values between −1 and 1, where a negative value indicates that the variants are redundant, whereas a positive value indicates synergy. Three types of permutation tests are presented that test different hypotheses on the presence or absence of main effects together with interaction effects. Finally, the optimal ratio of cases to controls for planning new studies may be quantified based on simulation results, and commented Matlab code is available.
Family studies
In the literature search, no article was identified that presents a method to explicitly deals with family data. However, for the study of sib-pairs, Brunel et al. [40] propose to associate the phenotypic and genetic similarities in sib-pairs instead of phenotypes and genotypes in unrelated individuals. While they suggest this in the context of mutual information estimation in the algorithm Mutual Information Statistical Significance, this idea can be adopted in other methods readily.
Conclusion
The systematic literature search identified 29 relevant articles that present mostly different information theory-based estimators and tests. Given this large number, it is obvious that they cannot be treated as a single method but fundamentally differ from each other. In fact, in many cases the estimators are different or even contradictory regarding the basic definition of genetic interactions from the information theory point of view. This raises the following aspects that should be tackled in near future.
First, it would be desirable to find a harmonic definition of interactions based on entropy leading to ‘sufficient’ estimators. This might be possible by systematically identifying which definitions are redundant, overlapping or contradicting. The first steps in this direction have been made by Lee et al. [46] who theoretically compared the relationship between four IG quantities and the interactions detected by a LR model.
Second, the systematic literature search showed that in many cases it is not clear how to construct a proper statistical test based on the proposed measures. A simple replacement of probabilities by frequencies often yields biased or even inconsistent estimators, or extremely slowly converging ones. Therefore, estimators should be sought that are both ‘consistent’ and if possible ‘unbiased’ (see also [54]).
Third, the systematic literature search showed that often the underlying distributions of the test statistics under the null or the alternative hypothesis are unknown. Thus, estimators whose ‘asymptotic behaviors’ are investigated are required.
Finally, the estimators have in many instances still to be adapted to the practical situation of genetic studies. Specifically, extensions remain necessary to account for genotyping errors, missing genotypes, phenocopies or genetic heterogeneity, as already pointed out in 2011 by Fan et al. [17].
Thus, we still agree with Fan et al. [17], even after 5 years, that a lot of work still needs to be done to understand high order interactions. Bearing these aspects in mind, we tentatively give the following recommendations, when working with an information theory-based estimator.
First, clarify which types of interactions are defined by the chosen estimators. Consider that stepwise searches (i.e. search for interactions only when main effects have been identified) are computationally much simpler but leave open the question about the genuinity of the signal as well as the possibility of interactions without main effects. Be aware that some interactions could be described completely also by a classical regression model or identified by a classical -independent test.
Second, because replacement of probabilities by frequencies represents often just a first ‘naive’ approach, choose estimators for which a test statistic is already derived or at least simulated (compare Table 2).
Third, consider that some estimators require a new implementation if they are used for genome-wide data or for interactions of higher order, to obtain an estimation in reasonable time. Also, consider that not every implemented estimator is usable for working with high-dimensional data.
Fourth, because of all these previous considerations, it seems pragmatic to first obtain estimators for interactions of second order, before trying to estimate interactions of third or even of higher order.
Funding
German Federal Ministry of Education and Research (BMBF, grant # 01ZX1313J to I.R.K.). German Research Foundation (DFG, grant # KO2240/-1 to I.R.K.).
For detection of GxG interactions, numerous information theory-based methods have been proposed.
However, these do not agree on the basic definitions of interactions and differ to a surprising extent in their construction or aims.
Hence, different estimators may serve different purposes, and the selection of a suitable method is supported by this review.
Paola G. Ferrario is Researcher at the Max Rubner-Institut, Karlsruhe, Germany. She is interested in nonparamtric estimation and genetics of complex diseases.
Inke R. König is Professor for Medical Biometry and Statistics at the Universität zu Lübeck, Germany. She is interested in genetic and clinical epidemiology and published over 190 refereed papers.
References
Appendix
Estimation of proposed by Fan et al. [17]
In a case-control design with M controls and N cases, Xij and Yij denote the count of controls and of cases whose genotypes are respectively, where .
is an overall test statistic to test the association between the markers A and B and the disease. Therefore, the null hypothesis is that the two markers are independent of the disease. It is asymptotically centrally or non-centrally chi-square distributed under the null or the alternative hypothesis, respectively, with one degree of freedom. The non-centrality parameter is
