


Abstract
Metabolomics is a rapidly growing field consisting of the analysis of a large number of metabolites at a system scale. The two major goals of metabolomics are the identification of the metabolites characterizing each organism state and the measurement of their dynamics under different situations (e.g. pathological conditions, environmental factors). Knowledge about metabolites is crucial for the understanding of most cellular phenomena, but this information alone is not sufficient to gain a comprehensive view of all the biological processes involved. Integrated approaches combining metabolomics with transcriptomics and proteomics are thus required to obtain much deeper insights than any of these techniques alone. Although this information is available, multilevel integration of different ‘omics’ data is still a challenge. The handling, processing, analysis and integration of these data require specialized mathematical, statistical and bioinformatics tools, and several technical problems hampering a rapid progress in the field exist. Here, we review four main tools for number of users or provided features (MetaCoreTM, MetaboAnalyst, InCroMAP and 3Omics) out of the several available for metabolomic data analysis and integration with other ‘omics’ data, highlighting their strong and weak aspects; a number of related issues affecting data analysis and integration are also identified and discussed. Overall, we provide an objective description of how some of the main currently available software packages work, which may help the experimental practitioner in the choice of a robust pipeline for metabolomic data analysis and integration.
Introduction
Metabolomics is an emerging field of the biological sciences; it concerns the high-throughput characterization of metabolites, i.e. small molecular compounds (< 1500 Da), which constitute the end products of the cellular metabolism and form the chemical fingerprint of an organism at a precise time point. More precisely, metabolomic studies involve the identification and quantification of metabolites, with the aim of correlating their changes with pathological states, or with the effect of external influencing factors such as drugs or contaminants [1]. Together with the other main ‘omics’ areas (genomics, transcriptomics and proteomics), metabolomics constitutes one of the building blocks of systems biology. Because of its focus on small molecules and small interactions, it has lately reached a widespread application in many different fields, including molecular epidemiology, toxicity assessment, functional and nutritional genomics, biomarker discovery and identification, drug development and personalized health care [1–3].
The following two are the general analytical approaches in performing a metabolomic analysis: targeted and untargeted. Targeted metabolomics refers to the detection and precise quantification (in nM, or mg/mL) of a small set of known compounds. It is driven by a specific biochemical question or hypothesis in which the set of metabolites related to one or more pathways is already defined. A limitation of the targeted approach is that it requires the compounds of interest to be known a priori, and to be available in their purified form. Currently, only few purified standards (i.e. defined groups of chemically characterized and biochemically annotated metabolites) have been clearly identified and are available for a calibration process; therefore, owing to the wide variety of metabolites and their complex dynamics within a cell, the targeted approach cannot yet be used alone for a comprehensive analysis of the metabolome. The untargeted approach instead, also called ‘metabolite fingerprinting’, is not driven by an a priori hypothesis and it is used for complete metabolome comparison (i.e. as many metabolites as possible are measured and compared between samples) [4]. Metabolite variations are observed principally as total changes of chromatographic patterns without requiring previous knowledge of the compounds under investigation. Therefore, untargeted metabolomics does not attempt to precisely quantify all measurable metabolites in a sample, but it only gives their relative quantification (fold change) [5, 6]. It is important to stress that, in spite of the presence of extensive metabolomics spectra repositories (e.g. SMPDB [7], KEEG [8], MetaCyc [9] and HumanCyc [10] to cite some), metabolite identification still constitutes a challenge in untargeted metabolomics. This is mainly because of technological limitations such as the dependence on the intrinsic analytical coverage of the platform used, and the possible bias toward the detection of the most abundant molecules [11]. Moreover, the same molecule can be fragmented differently depending on the specific instrument or technique used, and this hampers the metabolites spectra matching. Furthermore, instrument-dependent variability between different kinds of mass-analyzers and even between the ones of the same kind, but of different brands, increases the variability in compound identification.
Metabolomic research leads to the handling of complex data sets, which include hundreds of metabolites; their comprehensive evaluation requires a specialized data analysis that involves cheminformatics, bioinformatics and statistics aspects. Moreover, to better understand the role of each metabolite in the studied condition, metabolomic data must be interpreted; this requires that every chemical information derived from metabolomic analyses has to be related to both biochemical causes and physiological consequences [1, 12]. Toward this end, the multilevel integration of metabolomic, proteomic and transcriptomic information is fundamental for a better understanding of the cellular biology. Although this information is available, its fast evaluation and integration is still hampered by technical and biological issues, including (i) the complexity and heterogeneity intrinsic to biological data, which require appropriate statistical and computational analysis methods; (ii) the limited reproducibility of the results of transcriptomic, proteomic and metabolomic research and the heterogeneity of the available analysis techniques, which make data comparison among different labs hard; (iii) the lack of standard data formats both for ‘omics’ data and for metadata; and (iv) the need of user-friendly tools for integrative analysis of multiple data types [13, 14].
Although several literature about metabolomic data production and analysis techniques exist [3–5, 15–23], to the best of our knowledge, a comprehensive review illustrating the available tools for the analysis and integration of metabolomic data with other ‘omics’ data has not been reported yet. Here, we describe and compare four tools (MetaCoreTM, MetaboAnalyst, InCroMAP and 3Omics [24–27]), which we selected among the several ones currently available for metabolomic data analysis and integration (Table 1 reports a list of the tools most frequently cited in the literature); related issues and challenges arising in ‘omics’ data integration and analysis are also identified and discussed.
Features of the currently available metabolomic data analysis tools most cited in the literature, ordered by their year of publication
| Tool name | Tool description | Data preprocessing | Omics data integrated analysis | Pathway analysis | Transcriptomic data | Proteomic data | Metabolomic data | Year | Reference |
|---|---|---|---|---|---|---|---|---|---|
| IPAa | Analysis and visualization of different kinds of omics data | ✓ | ✓ | ✓ | ✓ | ✓ | N/A | [28] | |
| MetaCorea | Functional analysis and visualization of different kinds of high-throughput omics data | o | ✓ | ✓ | ✓ | ✓ | ✓ | 2004 | [24] |
| PaVESy | Data managing system for editing and visualization of biological pathways | o | o | o | 2004 | [29] | |||
| Proteome Softwarea | Quantization, compound identification and statistical and pathway analysis | ✓ | ✓ | ✓ | ✓ | 2005 | [30] | ||
| VisANT | Visualization and analysis of many types of biological networks | o | ✓ | o | o | 2005 | [31] | ||
| VANTED | Visualization and analysis of networks with related experimental data | ✓ | ✓ | ✓ | ✓ | 2006 | [32] | ||
| MassTRIX | Annotation of input mass peaks and mapping of the identified compounds onto the specific metabolic pathway | ✓ | ✓ | ✓ | 2008 | [33] | |||
| ProMeTra | Visualization and integration of data sets of different kinds of omics data on user-defined metabolic pathway maps | o | ✓ | ✓ | ✓ | 2009 | [34] | ||
| MetaboAnalyst | Comprehensive metabolomic data analysis, visualization and interpretation | ✓ | ✓ | ✓ | ✓ | 2009 | [25, 35] | ||
| Paintomics | Integrated visual analysis of transcriptomic and metabolomic data | o | ✓ | ✓ | ✓ | 2010 | [36] | ||
| MetPa | Pathway analysis and visualization for metabolomic data | o | ✓ | ✓ | 2010 | [37] | |||
| IMPaLa | Joint pathway analysis of transcriptomic or proteomic and metabolomic data | o | ✓ | ✓ | ✓ | ✓ | 2011 | [38] | |
| InCroMAP | Single data set and integrated cross-platform enrichment analysis, and pathway-based visualizations of omics data | ✓ | ✓ | ✓ | ✓ | ✓ | 2011 | [26, 39] | |
| 3Omics | Analysis, integration and visualization of different kinds of human omics data | o | ✓ | ✓ | ✓ | ✓ | ✓ | 2013 | [27, 40] |
Ingenuity Pathway Analysis: Commercial tool. Ticks indicate full functionality; empty circles indicate partial functionality.
MetaCoreTM and MetaboAnalyst are the most commonly used tools by researchers who work with metabolomic data (the number of data analysis jobs submitted to MetaboAnalyst was about 40 000/month in 2014 [41]). Both of them have been available since several years (since 2004 and 2009, respectively). Conversely, InCroMAP and 3Omics have been implemented more recently (in 2011 and 2013, respectively), and they have not yet overcome the previous ones. However, given their ease of use, the knowledge of these two latter tools may be advantageous for researchers interested in evaluating the current possibility to integrate ‘omics’ data across multiple platforms. In this review, we provide an objective and practical assessment of these tools, which may be helpful as a guide for the choice of a robust pipeline for metabolomic data integration and analysis. We do not give a description of ‘the best tools’ for metabolomic data analysis, but we elucidate how some of the main currently available software packages work, highlighting their strong and weak aspects.
Metabolomic analysis workflow: a brief overview
A detailed description of how a metabolomic analysis is performed can be found in [5, 6, 15]. In the following, we provide a brief overview to better understand the related issues; we summarize the main aspects, focusing on the integration with other kinds of ‘omics’ data.
A typical metabolomic study consists of several different parts (schematized in Figure 1), which can be grouped in four main steps [5, 12, 16, 42].
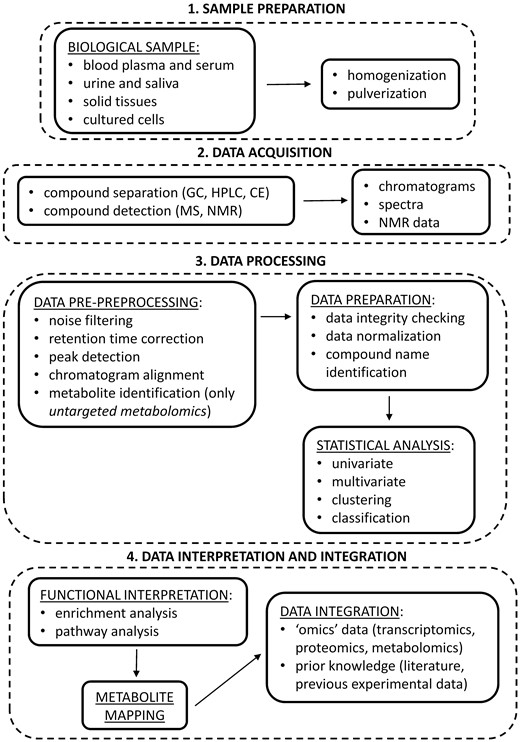
Flowchart of a typical metabolomic study. After sample preparation, specific metabolic signals are acquired using heterogeneous analytical platforms (DATA ACQUISITION). Raw signals are then pre-processed to produce data in a suitable format for univariate and multivariate statistical analyses. For untargeted studies, metabolites have first to be identified from spectral information (DATA PROCESSING). Significantly expressed metabolites are then linked to the biological context, through enrichment and pathway analysis, and mapped into networks. Finally, metabolomic data are integrated with other ‘omics’ data and with prior knowledge to gain a comprehensive view of the molecular processes involved (DATA INTERPRETATION AND INTEGRATION).
Sample preparation
The first step in the metabolomic workflow is the preparation of the biological sample (e.g. blood plasma and serum, urine, saliva, solid tissues and cultured cells). According to the kind of sample to analyze, several approaches are used, as described in details elsewhere [18–21]. Samples are usually homogenized or pulverized into smaller particles to increase their surface area for the exposure to the extraction buffer, which is chosen in accordance to their chemical characteristics.
Data acquisition
Once the sample is ready, different techniques can be used to separate and characterize chemically diverse groups of metabolites. To have different measurement dimensions based both on chemical and physical properties of metabolites, compound separation techniques (e.g. gas chromatography, high-performance liquid chromatography, ultra-high-performance liquid chromatography and capillary electrophoresis) are combined with compound detection techniques, such as mass spectrometry (MS) or nuclear magnetic resonance (NMR). Each detection or separation method has different resolution, sensitivity and technological limitations in identifying metabolites, and it is chosen in accordance to the chemical and physical characteristic of each sample and to the kind of analysis to be performed (targeted or untargeted) [12, 15, 18]. MS is the most widely applied technique, as it allows reliable metabolite identification, particularly when used in tandem with chromatographic separation methods so as to enhance its mass-resolving capabilities. It is rapid (the analysis time ranges from 5 to 140 min) and allows performing sensitive and selective qualitative and quantitative analyses. The main drawbacks of the MS technique are the need to separate or purify the sample before it is directed into the mass analyzer, and the high cost of the instrument. Compared with MS, NMR has a lower sensitivity, thus resulting in limited ability for metabolite identification and quantification. This implies that potentially important compounds that are present at smaller concentrations can be hidden by larger peaks, and are thus less likely to be identified. The advantages of NMR are the high analytical reproducibility and that it is a non-destructive method that requires minimal sample preparation [43, 44].
Data processing
Once acquired, raw signals (chromatograms, spectra or NMR data) are pre-processed by ad hoc software tools to facilitate compound quantification (e.g. the commercial software SIEVETM by Thermo Scientific [45], or some freely available software packages such as the cloud-based platform XCMS [46] or the open-source cross-platforms MAVEN [47] and MZmine 2 [48]). Generally, this preprocessing involves noise reduction, retention time correction, peak detection and integration and chromatogram alignment. Finally, for untargeted metabolomic studies, different databases, such as the Human Metabolome Database (HMDB) [49] or the Metabolite and Tandem MS Database (METLIN) [50], are used to identify the metabolites from spectra. During data integrity checking, different input data are then prepared to produce appropriate data matrices for further analyses, as better detailed in the next section. Briefly, before starting any kind of statistical analysis, data normalization is performed to reduce systematic biases or technical variations, and to avoid misidentification of significant changes owing to the different orders of magnitudes of metabolomic data. Following which, significant differences between sample sets can be identified using appropriate statistical methods. A typical statistical analysis for metabolomic data consists of two phases: initially, different univariate and multivariate methods are used to generate an overview of the considered data sets and to identify the metabolites that show significant changes under the studied conditions; then, data mining techniques are used to discriminate groups of functionally related metabolites [16]. A limit of traditional statistical methods is that they highlight relationships among variables based only on mathematical criteria (e.g. maximization of variance or correlation), and they do not take into account correlations from biological origin [17]. For this reason, the combined use of several statistical and data mining techniques is highly recommended [4]. Once identified, significantly expressed metabolites are first ranked using appropriate P-values; then, a cut-off threshold is applied to select the top-k ones from the ranked list. The choice of this threshold, which is often arbitrary, is critical, as it may influence the final biological interpretation. In fact, some moderate, but significant, changes may be missed, or critical components of a particular biological process may be left out, thus compromising subsequent analyses [42].
Data interpretation and integration
In this last step, the selected metabolites are linked to the biological context under study, through enrichment and pathway analyses. More precisely, enrichment analysis aims to investigate the enrichment (i.e. over- and/or under-expression) of predefined groups of functionally related metabolites (i.e. metabolite sets) to identify significant and coordinated expression changes among them. This allows taking advantage of the list of altered metabolites to suggest a biological pathway, or disease condition, which can be further investigated [42]. Conversely, pathway analysis involves the description and visualization of the interactions among genes, proteins or metabolites within cells, tissues or organs. Its goal is to identify the pathways that significantly impact on a given biological process [37]. Enrichment and pathway analyses are performed using ad hoc software tools [37], which map significant metabolites to known biochemical pathways on the basis of the information contained in public databases such as the Kyoto Encyclopedia of Genes and Genomes (KEGG) [8]. Once the metabolic pathways are identified, this information has to be integrated with transcriptomic and proteomic data to obtain a comprehensive view of all the biological processes involved [22]. To capture all the interactions that these data describe, network-based visualization tools are commonly used by investigators to better understand and show their findings. Depending on the kind of interaction under study, a biological network can be represented through a different type of graph. Graphs are mathematical structures of several kinds, such as directed or undirected graphs, directed acyclic graphs, trees, forests, minimum spanning trees, Boolean networks and Steiner trees [51]. To make graph layouts informative and reproducible, several visualization strategies have been proposed and adopted. A frequently used visualization method is the ball-and-stick diagram, where pathway data are presented as networks, with compounds (e.g., metabolites, proteins) as nodes and reactions as edges [23, 37, 52]. Nodes can be placed hierarchically (a father node with one or more child nodes) or radially as in radial networks or hive plots, which more closely represent the complexity of biological systems [53]. To reach a more reliable evaluation of the process under study, integration with biological knowledge derived from the literature or from previous experimental data can also be performed [12, 17]. In spite of the availability of this information, effective data integration is still far to be achieved owing to the heterogeneity of current databases. As a consequence, users have to take into account multiple databases to extract and manually assemble the several different information needed; this makes data integration time-consuming, and the final interpretation is often prone to errors because of different background knowledge or biases of individual researchers [42].
Software tools for metabolomic data analysis and integration
Powerful software tools are essential to address the vast amount and variety of data generated by metabolomic analyses. Required software capabilities include (i) processing of raw spectral data; (ii) statistical analysis to find significantly expressed metabolites; (iii) connection to metabolite databases for metabolite identification; (iv) integration and analysis of multiple heterogeneous ‘omics’ data; and (v) bioinformatics analysis and visualization of molecular interaction networks [16, 18]. In this section, we introduce the four data analysis tools selected (i.e. MetaCoreTM, MetaboAnalyst, InCroMAP and 3Omics); their main functionalities are illustrated and compared on the basis of some selected features, such as data preprocessing techniques used, statistical analyses performed and methods used for functional interpretation and, if available, for data integration. The main features of each tool are summarized in Table 2. It is important to point out that only MetaboAnalyst provides a comprehensive module for data preprocessing and statistical analysis [25, 41]. MetaCoreTM and 3Omics only offer limited support for these functionalities, whereas InCroMAP only accepts already preprocessed data. In spite of these limitations, we decided to include MetaCoreTM, 3Omics and InCroMAP in this review because of their ability to perform comprehensive analyses of multi-omics data, which are currently limited in other high-level analysis tools.
Main features of the selected four software tools for metabolomic data analysis
| Tool | MetaCoreTM | MetaboAnalyst | InCroMAP | 3Omics |
|---|---|---|---|---|
| Year | 2004 | 2009 | 2011 | 2013 |
| Institution | GeneGo | University of Alberta, McGill University, Montreal (CA) | Center for Bioinformatics of the University of Tübingen (D) | Molecular Design & Metabolomics Laboratory, University of Taiwan (TW) |
| Implementation | Web-based + stand-alone | Web-based | Stand-alone | Web-based |
| License | Commercial | GPL (GNU General Public License) | LGPL (GNU Lesser General Public License) | None |
| Type of knowledge | Proprietary | Public | Public | Public |
| Input data | Gene, protein or metabolite lists imported as tab-delimited text (TXT), comma-separated values (CSV) or Excel files; gene lists from microarray analysis software (Affymetrix, Agilent). | Tab-delimited text (TXT) or comma-separated values (CSV) for concentrations, spectral bins or peak intensity data; zipped files (ZIP) of NMR or MS peak lists or of MS spectra (in NetCDF, mzXML or mzDATA format). | Tab-delimited text (TXT) or comma-separated values (CSV) of heterogeneous types of processed ‘omics’ data. | Comma-separated values (CSV) of processed transcriptomic, proteomic or metabolomic data. |
| Data preparation | ||||
| Data integrity checking | ✓ | |||
| Data normalization | ✓ | |||
| Compound name identification | ✓ | ✓ | ✓ | |
| Statistical analysis | ||||
| Univariate analysis | ✓ | ✓ | ||
| Multivariate analysis | ✓ | |||
| Clustering | ✓ | ✓ | ||
| Classification | ✓ | |||
| Data interpretation and integration | ||||
| Functional interpretation | ✓ | ✓ | ✓ | ✓ |
| Metabolite set enrichment analysis | ✓ | ✓ | ✓ | ✓ |
| Metabolic pathway analysis | ✓ | ✓ | ✓ | ✓ |
| Metabolite mapping | ✓ | ✓ | ✓ | |
| Hyperlinks to external databases | ✓ | ✓ | ✓ | ✓ |
| Data Integration | ✓ | ✓ | ✓ | ✓ |
| Output data | Networks can be exported in two formats: Netshot and Network; images as PNG files. | PDF reports containing plots, graphs and tables with all the results. Images are available as TIF or PNG files. | Tabular format (e.g. CSV) for enrichment analysis results and JPG files for pathway-based visualization. | PNG, SVG or SIF formats for images. |
Ticks indicate tool functionalities.
MetaCoreTM
MetaCoreTM [24] is a commercial tool available both as a stand-alone and as a Web-based application. It is a software suite for functional analysis of different kinds of high-throughput molecular data (e.g. next-generation sequencing, siRNA, microRNA, microarray-based gene expression and serial analysis of gene expression data, array-comparative genomic-hybridization, DNA arrays, proteomic data, metabolic profiles and screening data). MetaCoreTM is an integrated system, which consists of (i) a high-quality, manually curated database of mammalian biology, including metabolites and other molecular classes, bioactive molecules and their interactions, signaling and metabolic pathways; (ii) genomic analysis tools to identify potentially significant variants; (iii) a data mining toolkit for data visualization, analysis and exchange of data; (iv) a toolkit (pathway editor) for custom assembly of functional networks; and (v) a set of parsers to upload and manipulate different types of high-throughput molecular data [54–56]. Unfortunately, no public information is available about the details of how MetaCoreTM works; thus, our review of this tool is partially limited and some details remain unclear.
MetaboAnalyst
MetaboAnalyst [25, 35] is an integrated freely accessible Web-based platform. It was first released in 2009, then upgraded in 2012 (MetaboAnalyst 2.0 [57]) and in 2015 (MetaboAnalyst 3.0, also available for download and local installation). It offers a set of online tools for metabolomic data analysis that combine statistical analysis of data with their functional and biological interpretation and visualization [25]; tutorials and protocol papers are also available online. MetaboAnalyst 3.0 has been re-implemented to improve performance, capability and user interactivity. It offers eight functional modules, which can be grouped in three categories: (i) exploratory statistical analysis (Statistical Analysis and Time-Series Analysis modules); (ii) functional analysis (Enrichment Analysis, Pathway Analysis and Integrated Pathway Analysis modules for both genes and metabolites); and (iii) advanced methods for translational studies (Biomarker Analysis, Sample Size Estimation and Power Analysis modules). In addition, it has also an Other Utilities module containing a specialized function for lipidomic data analysis and a compound ID-conversion tool [41].
InCroMAP
InCroMAP is a stand-alone Java software originally developed in 2011 for enrichment analysis and pathway-based visualizations of genomic and proteomic data [27, 40]. The extended version InCroMAP 1.5, released in 2013, also supports annotated metabolomic data, thus making this tool suitable for comprehensive system biology studies [58]. InCroMAP is freely available at its Web site [39], which includes a user guide [59], example data files to test the tool and a short video tutorial. The software performs metabolite set enrichment analysis and generates interactive global maps of the cellular metabolism. These maps allow an integrated pathway-based visualization of data from multiple ‘omics’ platforms and provide a useful overview of the metabolic changes present in the studied experimental condition [26, 59].
3Omics
3Omics is a platform-independent, Web-based tool developed in 2013 for the analysis, integration and visualization of transcriptomic, proteomic and metabolomic human data. It is freely accessible at [40], and the Web site also includes a help section. To demonstrate the software functionalities applied to real data, two case studies are also reported and explained in [27]. 3Omics supports correlation analysis, co-expression profiling, phenotype mapping, pathway enrichment analysis and gene ontology-based enrichment analysis. More precisely, depending on the data provided, the software offers four types of ‘omics’ analyses: (i) Transcriptomics–Proteomics–Metabolomics (T–P–M), (ii) Transcriptomics–Proteomics (T–P), (iii) Proteomics–Metabolomics (P–M) and (iv) Transcriptomics–Metabolomics (T–M). A single-omics mode is also available to reveal intra-omics relationships. 3Omics can also supplement missing transcript, protein and metabolite information related to the input data, by text-mining the biomedical literature through iHOP (information Hyperlinked Over Protein, [60, 61]). Users can thus perform multi-omics analyses even when only one or two out of three ‘omics’ data sets are available [27].
Evaluation and comparison of software functionalities
In this section, strong and weak aspects of each of the four selected tools are reviewed and comparatively evaluated, following the data analysis workflow previously described (Figure 1).
Input data
Various proprietary data formats have been developed to handle and store MS or NMR raw data; this heterogeneity makes it difficult for researchers to manipulate these data. For this reason, several software for the conversion of raw data file types (e.g. .RAW) into a universal format (e.g. .CSV, .TXT, .mzXML or .MGF) have been implemented, such as ProteoWizard [62], MassMatrix [63] and several others, including MATLAB [64] and R [65, 66]. Once raw data have been converted to a suitable format, they can be further analyzed. Data types and formats accepted as input by the four reviewed tools are reported in Table 2. Input data are usually organized as data matrices with samples as rows and signal features as columns. MetaCoreTM, MetaboAnalyst and IncroMAP accept data in different kinds of tabular format (e.g. textual tab-delimited TXT or comma-separated value CSV files), whereas 3Omics only accepts CSV files. MetaboAnalyst also accepts zipped files of NMR or MS peak lists or of MS spectra, which must be in mzXML, mzDATA or NetCDF format. As for MetaCoreTM, gene lists can also be imported from output files of microarray analysis software such as Affymetrix [67] or Agilent [68]. Compound names or IDs, together with the values of a numeric attribute (e.g. fold-changes, P-values, gene expression changes, protein levels, metabolite concentrations), have to be included, and the data type has to be specified by the user [58, 69].
Data preparation
Data preparation includes integrity checking, normalization and compound name identification. This set of procedures is fully available only in MetaboAnalyst. MetaCoreTM and 3Omisc just offer a tool for compound name standardization, but MetaCoreTM also allows the integration with specific software for data preprocessing. InCroMAP and 3Omics only accept data already preprocessed and normalized with appropriate software (e.g. OpenMS, MayDay, R, IBM-SPSS Statistics, SAS or JMP) [27, 58]. A brief description of each data preparation step is given in the following text.
Data integrity checking
Among the four tools reviewed, data integrity checking is performed only by MetaboAnalyst, even if other software provide this functionality (e.g. XCMS [46] for metabolomic data or Progenesis QI [70] for proteomic data). As for MetaboAnalyst, this step includes handling of missing values as well as identification and removal of outliers [69]. Missing values are automatically replaced with small ones, i.e. half of the minimum positive value in the original data, but the user can also specify other missing value estimation methods, e.g. by replacing them with the mean/median of the original data, or by using K-nearest neighbors, probabilistic principal component analysis, Bayesian PCA or singular value decomposition methods.
Data normalization
MetaboAnalyst provides different normalization methods (e.g. by sum, median or reference sample) that can be selected by the user; data transformation (log or cube root) and scaling (auto, pareto or range scaling) are also available [69].
Compound name identification
As there is no universally accepted set of compound labels, molecule labels in user’s input data have to be converted to identifiers in public databases (e.g. HMDB, PubChem Compound, ChEBI, KEGG or METLIN). MetaboAnalyst and 3Omics provide a module specifically designed for this purpose [27, 41], whereas MetaCoreTM has a built-in synonym dictionary for gene and protein names that enables compound label standardization [54]. InCroMAP does not provide an ID-conversion tool, as it only accepts data with an appropriate identifier (e.g. Affymetrix or Agilent for genes; KEEG, HMDB or PubChem for metabolites) [58]. We highlight that the conversion of a compound name into its correct ID code is not a painless procedure, and can be an additional source of error or ambiguity. Furthermore, different results may be obtained depending on the used platform/tool. In fact, the same compound could be associated with different IDs according to its different molecular structures (e.g. chirality). We recall an example reported by Cavill et al. [22] regarding the case of lactate and KEGG identifiers: there are three KEGG identifiers that relate to lactate according to the chirality of the molecule (i.e. non-superposabity on its mirror image), and whether these chiral metabolites are distinguishable depends on the resolution provided by the analytical platform used. Because they have the same mass, a solution could be using specifically selected elution columns in MS to ensure they elute at different times and are thus experimentally distinguishable.
Statistical analysis
Out of the four tools reviewed, MetaboAnalyst is the one that offers the most complete set of statistical and machine learning methods for data analysis. 3Omics only performs clustering and co-expression analysis, whereas InCroMAP does not provide a statistical module. Unfortunately, only limited information is available about the data analysis performed by MetaCoreTM, but it seems incorporated in the pathway analysis module. Analysis algorithms used in MetaboAnalyst and 3Omics have originally been implemented in the R open-source project [65, 66].
A wide variety of statistical methods and data mining approaches can be applied on metabolomic data depending on the kind of experiment performed. In the following text, we illustrate both univariate and multivariate statistics and also briefly describe time-course analysis for completeness.
Univariate analysis
It is usually the first analysis performed, as it provides a preliminary overview about the data features that are potentially significant in discriminating the conditions under study. 3Omics performs co-expression analysis by means of an algorithm that computes dissimilarity coefficients using the Euclidean distance, and displays results as heat maps.
For two-group data, MetaboAnalyst provides fold change analysis, t-test and volcano plots (i.e. a type of scatter plots to quickly identify changes in large data sets of replicate data, having the fold change on the x-axis and the negative log of the P-value on the y-axis), both for unpaired and paired analyses. For multi-group data, it provides one-way analysis of variance (ANOVA), with associated post hoc analyses, and correlation analysis. As a large number of metabolites are usually present for each patient or biological sample, and an individual statistical test has to be performed for each metabolite, a high number of false-positive results can be obtained owing to multiple testing. To limit it, a multiple testing correction technique (e.g. Bonferroni, Bonferroni–Holm, Westfall–Young or Benjamini–Hochberg correction) must be used to adjust the obtained significance P-values to keep the probability of observing at least one significant result owing to chance below a predetermined level [71]. The Benjamini–Hochberg correction [72], also known as false discovery rate (FDR), is the recommended one, as it allows controlling the proportion of false positives among all significant results. Both FDR- and Bonferroni-corrected P-values are provided by MetaboAnalyst for each evaluated metabolite.
Multivariate analysis
It involves the simultaneous observation and analysis of more than two statistical variables. It is ideal for the analysis of ‘omics’ data, as they usually consist of several features that change as a function of time, phenotype or experimental condition. Multivariate analysis techniques include multivariate ANOVA, multivariate regression analysis, factor analysis, principal component analysis and partial least square discriminant analysis; all of them are supported by MetaboAnalyst. These techniques are useful for exploratory data analysis, as they allow summarizing original variables in fewer variables using their weighted average.
Clustering
Cluster analysis aims to determine intrinsic groups in a set of unlabeled data; thus, it is useful to identify groups of metabolites that have similar characteristic or behavior, or that belong to the same biological pathway. MetaboAnalyst supports two types of clustering: hierarchical clustering (with results visualized through heat maps and dendrograms) and partitional clustering (using K-means or self-organizing map algorithm), whereas 3Omics only performs hierarchical clustering.
Classification
On the basis of a training set, it allows to identify to which category a new sample belongs, and to assign metabolites to a known group or pathway in high-dimensional data. Classification methods supported by MetaboAnalyst are random forest and support vector machines.
Time-course analysis
Provided only by MetaboAnalyst, it allows detecting trends in metabolite concentrations or metabolite distribution patterns over time, e.g. to study treatment effects during multiple time points. The MetaboAnalyst module currently supports both multivariate empirical Bayes time-series analysis for detecting distinctive temporal profiles across different experimental conditions and ANOVA-simultaneous component analysis (ASCA) for the identification of major patterns associated with each experimental factor and their interactions [41, 57].
Data interpretation and integration
This final step of the data analysis workflow allows linking significantly expressed metabolites to the biological context under investigation. As shown in Figure 1, this step consists of three parts (i.e. functional interpretation, metabolite mapping and data integration), described in the following text.
Functional interpretation
It includes enrichment analysis and pathway analysis. These two approaches often overlap (pathway–enrichment analysis), as both work by comparing significant metabolites, identified by the statistical analyses, to predefined functional groups derived from previous knowledge.
MetaCoreTM contains many options for enrichment and pathway analyses, some of which are specifically designed for drug discovery and disease investigation. By default, calculations are set to compare the user’s data set to the entire software database; in the case of a limited data set, a specific restricted list of compounds can be selected from the entire MetaCoreTM database and used for comparison (data filtration). The statistics performed is based on the hypergeometric mean, and returns a P-value that ranks the intersection between the uploaded data and the content prebuilt in MataCoreTM. Results are displayed as histograms, with pathways ordered from the most to the least significant one [55, 56].
MetaboAnalyst incorporates the Metabolite Set Enrichment Analysis (MSEA) and Metabolomics Pathway Analysis (MetPA) software for metabolite set enrichment analysis and pathway analysis, respectively [17, 42]. MSEA offers three different kinds of enrichment analyses, i.e. over-representation analysis (ORA), single sample profiling (SSP) and quantitative enrichment analysis (QEA); a description of these methods can be found in [42, 69]. Briefly, ORA evaluates if a particular set of metabolites is represented more than expected in a given compound list extracted from a single biological sample; SSP allows to investigate if certain metabolite concentrations in a given sample are higher or lower than their normal range; QEA is similar to ORA, but used with multiple samples (e.g. collected at different time points or belonging to different patients) [42]. All these three methods generate graphs or tables with embedded hyperlinks to relevant pathway images and disease descriptions. MetPA provides several different algorithms for pathway analysis, including Fisher’s exact test, hypergeometric text, global test and GlobalAncova [37]. Compound importance in the given metabolic pathway is estimated through its betweenness centrality and out-degree centrality (refer to [37, 69] for further details). Results are presented in two parts: a table with all analysis results and the graphical output, which contains three view levels: metabolome view, pathway view and compound view. The metabolome view and a pathway view are shown in Figure 2. Pathway and compound views are generated dynamically, based on the user’s interaction with the visualization system; usually, multiple pathway and compound views can be obtained from a metabolome view.
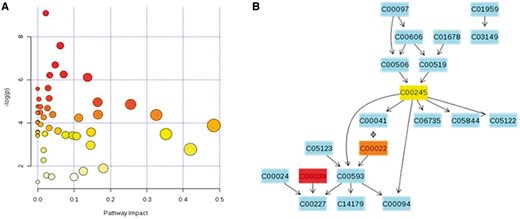
Some graphical visualization features of MetaboAnalyst: metabolome view (A) and pathway view (B). Images were obtained using the example data provided with the MetaboAnalyst software. In the metabolome view, each circle represents a different pathway; circle size and color shade are based on the pathway impact and p-value (red being the most significant), respectively. By clicking on a circle, the corresponding pathway view is generated, showing all genes involved in that pathway and their interactions. The codes represent compound IDs as reported in KEGG. In (B), the taurine and hypotaurine metabolism pathway is shown. As for compound colors within the pathway view, light blue means the metabolite is not in the uploaded data, but it has been used as background for enrichment analysis, whereas other colors (varying from yellow to red) mean the metabolite is in the data, with a different level of significance (red being the most significant). A colour version of this figure is available at BIB online: http://bib.oxfordjournals.org.
InCroMAp performs both single data set and integrated cross-platform enrichment and pathway analyses, using data from individual or heterogeneous platforms. In the former, single-platform case, a hypergeometric test is used to detect relevant pathways, whereas a straightforward extension of the single-platform method is used in the latter case. Unidentified metabolomic features, i.e. which cannot be mapped to a known set of genes, proteins or metabolites, are automatically discarded. Results are presented in a table or a barplot, sorted according to the associated P-values [58].
3Omics provides enrichment and pathway analyses for T–P–M, P–M, T–M and single metabolomic data. To perform the analysis, the user has to select a known metabolite set and one obtained from experimental data. Significantly enriched pathways are identified with a hypergeometric test. Results are reported in tables, ranked according to their probability. Metabolites in the pathways are displayed alongside hyperlinks to the HMDB or HumanCyc database [27].
Metabolite mapping and data visualization
Metabolites are mapped to their biological pathway as networks of interconnected nodes, thus transforming the original unstructured data into logically structured and visually understandable representations [73]. In this way, users can more easily identify relationships and hidden patterns among the data, which facilitates hypothesis generation and result interpretation.
MetaboAnalyst does not require this step, as it already provides interactive Google-Maps-style graphs of pathways and metabolites for the visualization of enrichment and pathway analysis results.
Within MetaCoreTM, biological networks are built on input metabolite lists after metabolite preselection through enrichment and pathway analyses. According to the aim of the study and the data set size, users can choose among several network-building algorithms, which are described in details in [54, 55]. Networks are generated as a combination of single-step interactions (directed edges) connecting metabolites, proteins or genes (nodes). Each node is associated with a specific compound through the MetaCoreTM database architecture, and users can retrieve the information about the node-associated compound simply by clicking on the node. An info page opens, containing many links with information about the node-associated object (e.g. gene, protein, metabolite, ligand, transcription factor or enzyme), maps where the object appears, related gene ontology processes or diseases, all known drugs for the object and a list of the object’s network interactions. Significant expression or abundance changes of specific compounds are also visually shown as a red or blue solid circle above the node, indicating increased or decreased expression/abundance, respectively (Figure 3).
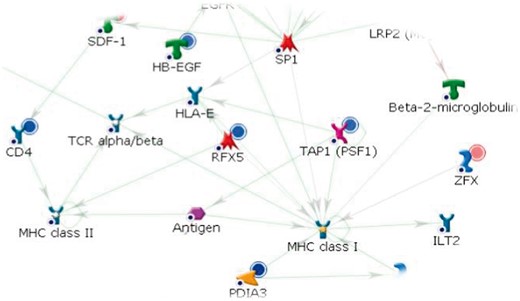
Example of a biological network representation in MetaCoreTM. According to their shape and color, nodes represent genes, proteins, metabolites or other biological elements, while directed edges represent the reactions intercurring between them: green for activation, red for inhibition and gray if unspecified. Compounds with abundance change are identified by a red (abundance increasing i.e. ZFX) or blue (abundance decreasing i.e. TAP1, RFX5) solid circle above them. A colour version of this figure is available at BIB online: http://bib.oxfordjournals.org.
InCroMAP provides metabolite mapping support through two different kinds of data visualizations: the integrated visualization and the global metabolic overview. The integrated visualization overlays a selected pathway of interest with the corresponding ‘omics’ experimental data; the global metabolic view integrates multi-omics data and displays them in a single graph where each subordinate metabolic pathway is colored according to the significance of its enrichment [58].
3Omics generates compound networks through the Correlation Network module, which incorporates the ‘cor’ function from R to compute the Pearson’s correlation coefficient (PCC). The PCCs between each pair of interconnected elements in the network are calculated from two sets of values, which can be of the same kind (intra-‘omics’ analysis) or of different kinds (inter-‘omics’ analysis). In the latter case, transcripts, proteins and metabolites are all represented in the same graph and identified with different symbols (squares, triangles and circles, respectively). Uploaded data are automatically mapped into networks using a force-directed layout algorithm. Literature-derived relationships are presented as dotted lines, whereas solid lines indicate strong correlations (PCC > 0.9) identified between the uploaded data [27].
Data integration
It is crucial to obtain meaningful biological insights, but it is still difficult to achieve. Currently, high-throughput analysis tools mainly perform data integration through network building; thus, they provide a ‘visual integration’ of the different kinds of ‘omics’ data, whereas the interpretation is left to the users. In light of these considerations, for MetaCoreTM, InCroMAP and 3Omics, we can consider data integration as part of metabolite mapping, as they map all ‘omics’ data levels on the same network. MetaboAnalyst instead provides a specific module for integrated pathway analysis, which enables users to integrate data from gene expression and metabolomic experiments. Users have to upload a list of genes and metabolites of interest, identified from the same samples or obtained under similar experimental conditions; genes and metabolites are then mapped to KEGG pathways for overrepresentation analysis. In spite of its great usefulness, this MetaboAnalyst module still has some limitations. On the positive side, by combining the evidence based on changes in both gene expressions and metabolite concentrations, it is more likely to identify which pathways are involved or up-/down-regulated in a biological process. On the negative side, users have to keep in mind that these graphical representations are prone to errors. In fact, although the entire transcriptome is routinely mapped, current metabolomic technologies capture only a small portion of the metabolome; this difference can thus lead to potentially biased results. Moreover, this module does not support proteomic data; thus, a comprehensive multilevel data integration cannot be achieved yet [41].
Output data
Once the data analysis, integration and interpretation have been performed, users can export the results in different formats, to use them for further analysis.
MetaCoreTM allows saving networks in two formats: Network and Netshot. Netshot saves the network exactly as it is, whereas Network does not retain the expression data and will reflect any subsequent changes to the objects or interactions in the network as the MetaCoreTM database is updated. Thereby, saving a network in both formats enables users to see exactly how it looked when it was created (Netshot) and how it may have changed after subsequent MetaCoreTM updates (Network). High-quality images of networks and maps can be saved in PNG format. MetaCoreTM also provides a Data Sharing module to share experiments, gene lists and saved networks with other users or groups, with different permission levels [55].
MetaboAnalyst generates a report in a PDF format containing plots, graphs and tables with all the results of the analyses performed and a brief explanation; plots, graphs and tables can also be downloaded as TIF files. In addition, the processed numeric data, high-resolution images (PNG format), R scripts and R command history are also available for downloading (before being deleted, raw data files are stored on the server for 72 h). Users can easily rerun, and, in some cases, modify, resulting R scripts on their local machine after installation of the R software and the required packages [25, 66]. As for InCroMAP, the results of the enrichment analysis can be exported in a tabular format (e.g. CSV), and the pathway-based visualization can be stored as a JPG file. In 3Omics, network images can be exported in PNG, SVG or SIF formats, and all processed data can be downloaded for further analyses. To safeguard data confidentiality, uploaded data files are only temporarily stored during their evaluation section and then deleted after processing.
Conclusion
The fast-growing metabolomics domain generates high quantities of valuable data that require integration and comprehensive analysis with other ‘omics’ data to be fully interpreted. The most common approach consists in simultaneously monitoring the levels of transcripts, proteins and metabolites, and in combining the obtained data to infer the structure and dynamics of the underlining biological networks in data sets of interest. Several statistical and computational methods are required to analyze and integrate this diverse and large amount of data; computational tools supporting also data visualization and metabolite mapping greatly help to quickly identify the relevant metabolites and the involved biological processes in the studied conditions.
Of the many tools available for processing and analyzing metabolomic data, we reviewed and compared four of the most relevant for number of users or provided features, and pointed out their advantages and drawbacks. MetaCoreTM is the one with the wider integrated database of molecular information, containing more than 1500 signaling and metabolic pathway maps and over 1.3 million molecular interactions, which is continually updated to guarantee reliability and comprehensiveness [45]. This makes MetaCoreTM a powerful tool for researchers in many different fields, from drug discovery to biomarker identification and clinical applications. It also provides several biological network-building algorithms to map high-throughput experimental data into interactive and information-rich networks. The great limitation in the use of this software is that it requires purchasing a license, whose cost not all research groups can afford.
Among the freely available tools, MetaboAnalyst is the most complete one, as it offers comprehensive data processing options, a wide array of univariate and multivariate statistical methods and extensive data visualization and functional analysis modules. Its main limitation is the lack of support for proteomic data integration. Given its high ease of use, InCroMAP addresses to investigators of any kind of discipline, and it is suitable for the evaluation of system biology studies. However, its lack of a data preprocessing module requires the use of other software to prepare the input data. 3Omics is useful for researchers interested in integrated visualization and one-click comparative analysis of multiple ‘omics’ data in a simple and rapid way. Yet, as InCroMAP, it does not support data preprocessing, and it provides only a few statistical methods for data analysis; furthermore, it only supports human data evaluations.
Overall, in spite of the undeniable validity of the tools reviewed, there are still several challenges that need to be addressed, mainly in the field of data integration, to support a thorough comprehensive evaluation of the experimental data and a deeper understanding of the biological processes. Although multiple ‘omics’ data are increasingly available, an open issue is still their effective use to understand the biological mechanisms responsible for the variance in the observed metabolomic profiles. Toward this goal, further development and improvement of computational techniques for efficient storage, integration and use of prior knowledge, identification and accurate quantification of metabolites, heterogeneous ‘omics’ data integration and pathway visualization are essential and shall continue to be the focus of the bioinformatics community in the next future.
Metabolomics is a growing field of biology that generates large amounts of data; handling, processing and analysis of these data are still challenging and require specialized mathematical, statistical and bioinformatics tools.
Metabolomic data alone are not enough to gain thorough understanding of a biological system and its behavior under pathological conditions; integration with other ‘omics’ data (mainly transcriptomics and proteomics) and with previous knowledge is needed to gain deeper knowledge.
Several tools are available for ‘omics’ data analysis and integration, which constitute an invaluable help for researchers in many different fields; in spite of this, there are still open challenges, mainly regarding heterogeneous data integration and their comprehensive analysis, that need to be faced to take effective advantage of new experimental data and available knowledge.
Funding
This research was supported by the “ShockOmics” grant (FP7 EU Project No 602706).
Alice Cambiaghi is a PhD student in biomedical engineering at the Department of Electronics, Information and Bioengineering, Politecnico di Milano, Italy. Her PhD project deals with finding new strategies for multilevel integration of ‘omics’ data, as an approach for the identification of molecular biomarkers in acute heart failure induced by shock.
Manuela Ferrario is an assistant professor at Politecnico di Milano, Italy. She is a member of the scientific committee of the EU project ‘Shockomics: multiscale approach to the identification of molecular biomarkers in acute heart failure induced by shock’ (2013–2017). Her research interests include mathematical modeling of physiological systems, nonlinear analysis, variability analysis of cardiovascular signals, data mining and prediction models.
Marco Masseroli is an associate professor of bioinformatics and biomedical informatics at the Department of Electronics, Information and Bioengineering, Politecnico di Milano, Italy. His research interests include distributed Internet technologies, biomolecular databases, biomedical terminologies and bio-ontologies to effectively retrieve, manage, analyze and semantically integrate genomic information with clinical and high-throughout genetic data. He is the author of more than 170 scientific articles.
