


Abstract
Liquid chromatography-mass spectrometry is widely used for comparative replicate sample analysis in proteomics, lipidomics and metabolomics. Before statistical comparison, registration must be established to match corresponding analytes from run to run. Alignment, the most popular correspondence approach, consists of constructing a function that warps the content of runs to most closely match a given reference sample. To date, dozens of correspondence algorithms have been proposed, creating a daunting challenge for practitioners in algorithm selection. Yet, existing reviews have highlighted only a few approaches. In this review, we describe 50 correspondence algorithms to facilitate practical algorithm selection. We elucidate the motivation for correspondence and analyze the limitations of current approaches, which include prohibitive runtimes, numerous user parameters, model limitations and the need for reference samples. We suggest and describe a paradigm shift for overcoming current correspondence limitations by building on known liquid chromatography-mass spectrometry behavior.
INTRODUCTION
Chromatography is usually preferred in mass spectrometry experiments with complex samples because the added dimension helps to discriminate between analytes and can result in the observation of more lower abundance analytes by decreasing ion suppression. There are many versions of chromatography, including gas chromatography and capillary electrophoresis; we focus this review on methods that will work on the most common form: liquid chromatography-mass spectrometry (LC-MS). Still, it is likely that many, if not all, of the methods reviewed will work across all formats.
LC-MS produces analytes that elute at different retention times (RTs) and (to a much lesser degree) m/z across replicates. Experiments often bridge multiple fractions as well as technical and biological replicates, yielding tens to hundreds of runs [1]. In any experiment spanning multiple samples, corresponding analytes must be mapped before statistical, comparative or quantitative analysis. This process is called correspondence.
Sometimes stable isotope labeling techniques such as iCAT, iTRAQ and SILAC are used to identify key corresponding analytes over all samples (landmarks). However, iTRAQ requires MS/MS identification and is quite expensive. Meanwhile, SILAC requires cells composing the sample to be culturable, and all three methods are limited in the number of samples in which they can be used. All three are expensive and are not readily applicable to lipid or metabolomic analyses [2,3].
Many label-free correspondence algorithms in proteomics, lipidomics and metabolomics have been proposed. However, the few existing reviews on the topic are limited in significant ways—providing a concise but general description of approaches without describing specific methods [4] or covering only a small subset of extant methods [5–7].
In this review, we describe 50 algorithms grouped by seminal approaches in chronological order, providing a comprehensive reference for practitioners as well as for researchers who develop correspondence algorithms. Although this review is specifically concerned with alignment methods for LC-MS, some of these methods (those that focus only on spectral alignment) should function on nuclear magnetic resonance (NMR) data (see [4,8] for reviews of NMR alignment methods).
We begin with an overview of the theory of variation between replicates. Next, individual alignment algorithms are described, as well as the general patterns common to groups of methods. We conclude with a list of problems unsolved by current approaches.
CORRESPONDENCE IN THEORY
Correspondence would be a trivial problem if each species always eluted at the same time and same m/z across replicates. However, any given species elutes at varied RT and m/z depending on a host of factors:
Random variation [4]
Variation in signal intensity [9]
Mass accuracy [9]
Sample collection [9]
Experimental design [9]
Platform stability [9]
Sample stability [9]
Cross-instrument variability [9]
Temperature fluctuation [13]
Sample buffer composition and gradient [13]
Separation system anomalies [4]
Spray variation from sample concentration variation [14]
Ionization efficiency [15]
Ion suppression [15]
Although some variation can be controlled via protocol (e.g. pH change due to carbon dioxide uptake from the air can be controlled), variation across experiments cannot be completely controlled [2]. LC-MS chromatograms are prone to non-linear shifts in RT and m/z [16], even in calibrated experiments conducted in the same laboratory [17], among technical replicates [2,15], and contiguous experiments on the same machine [9,11]. Variation in m/z is usually minor compared with RT.
Some of the above-named variation sources generate a shift in RT or m/z that is general to the whole run (e.g. column age). These types of shifts, called system-level variations (see Figure 1), can be modeled using monotonic functions. However, most LC-MS variation sources are not monotonic in nature or system-level. These component-level variations are singularities specific to a single analyte or a group of related analytes. For example, consider ion-suppression. This phenomenon occurs as a function of the ionization characteristics and abundance of the analytes under ionization at a given time. It is not a consistent effect throughout a run. It cannot be modeled using monotonic functions. Other examples of component-level catalysts include random variation in eluent at a given time, momentary changes in temperature or pressure, platform stability and spray variation. Component-level shifts occur frequently in LC-MS [18].
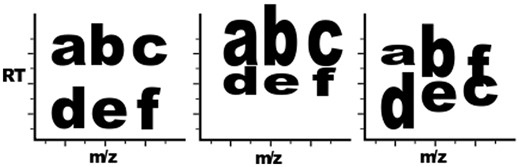
Component variation versus system variation. The first plot represents a baseline LC-MS output, with each letter representing an analyte signal. The second plot demonstrates three component-level shifts: a, b and c are lengthened in elution duration, column c-f has an m/z shift and row d-e-f is shifted in RT. The third plot demonstrates several component variations: b and d are lengthened in elution time, a is shortened in elution time and f and c have elution order swapped.
The field generally casts the problem of correspondence as an alignment problem (see Figure 2). Alignment is used in an attempt to facilitate correspondence via direct matching by mapping the data through a warping function designed to capture the net effects of the system-level variations encountered in a run. However, the warping functions required for alignment are incapable of capturing component-level variation due to the necessary computational constraint of requiring a monotonic warping function. There are other limitations to warping approaches, which will be discussed later. After alignment, correspondence must still be solved via direct match (see Figure 3), but with a data set now missing much of the information originally available, which has been modified according to the biases of the optimization function of the alignment algorithm. Current research has predominately focused on new warping algorithms, continuing to overlook the intrinsic weaknesses of alignment approaches. Research should instead focus on solving the problem of interest: correspondence.
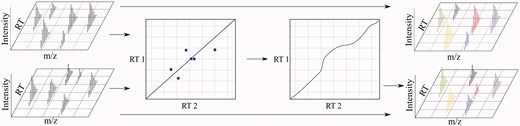
In alignment, a warping function is derived from a registration of two runs where one is usually a reference or target run (in this case, the bottom run). The alignment process defines a set of global and piecewise stretches and skews in RT. After alignment, corresponding analytes still must be matched (matches indicated by matching colors. Black indicates no match.) A colour version of this figure is available at BIB online: http://bib.oxfordjournals.org.
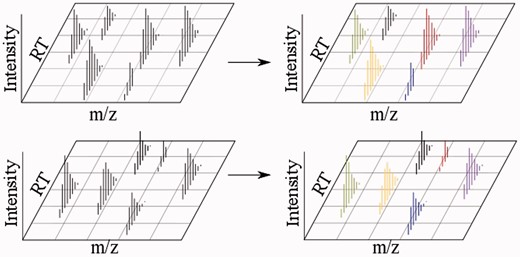
In direct match methods, analytes are matched directly based on factors such as elution time, charge state and isotopic envelope characteristics. Matches are indicated by matching colors. Black indicates no match. A colour version of this figure is available at BIB online: http://bib.oxfordjournals.org.
Direct match correspondence solutions are inherently difficult to develop due to the data complexity, and perhaps for this reason are less often attempted. Most correspondence approaches simplify the problem by considering only certain dimensions of the data, e.g. total ion chromatograms (TIC) or extracted ion chromatograms (XIC) (see Figure 4 and Table 1). While data reductions result in information loss [such as reducing an isotopic envelope to a single reduced isotopic envelope (RIE)], dimensionality reduction through ion feature or isotopic envelope detection actually adds information. For example, elution order swaps are undetectable without the discernment provided by the entire isotopic envelope.
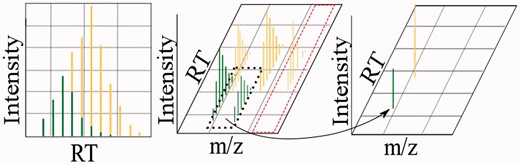
Terminology used in this article. The left plot shows a total ion peak (TIP), delineated by a distinguishable Gaussian shape on a TIC. Each analyte generates an isotopic envelope at each charge at which it is detected. The middle plot indicates two isotopic envelopes (green/bottom and yellow/top), composed of 2 and 3 ion features, respectively. The dashed red line indicates an XIC. The right plot shows each of the two isotopic envelopes from the middle plot as RIE. When speaking of TIPs, ion features, IEs or RIEs generally, we use the term feature. A colour version of this figure is available at BIB online: http://bib.oxfordjournals.org.
Novel publicly available LC-MS alignment algorithms
| Algorithm | Data type | Reference | Anchor points | Dimensions | Warping |
|---|---|---|---|---|---|
| AMSRPM [19] | TIP Lists | User | Auto | TIC | Yes |
| Auto-PABS [20] | Raw | User | No | XIC | Yes |
| Bylund et al. [21] | Raw | User | No | BPC | Yes |
| ChAMS [22] | Raw | User | No | Spectrum | Yes |
| Chromalign [23] | Raw | User | No | XIC then spectrum | Yes |
| COW-CODA [24] | Raw | User | No | XIC | Yes |
| COW [25] | Raw | User | No | TIC or XIC | Yes |
| CPM [26,27] | Raw | No | No | TIC or XIC | Yes |
| DeSouza et al. [28] | Raw | No | No | TIC | No |
| DTW [29] | Raw | User | No | TIC or XIC | Yes |
| Fischer et al. [30] | RIE lists | User | Auto | RIE lists | Yes |
| Higgs et al. [31] | IE lists | User | MS/MS | XIC | Yes |
| IDEAL-Q [13] | Raw | User | MS/MS | XIC | Yes |
| LCMSWARP [32,33] | RIE lists | AMT or user | MS/MS | RIE lists | Yes |
| MassUntangler [15] | IE lists | User | No | IE list | No |
| MCCA [34] | RIE lists | User | MS/MS | RIE lists | Yes |
| MetAlign [35] | IE lists | User | Auto | XIC | Yes |
| MSInspect [36,37] | RIE lists | AMT | MS/MS | RIE lists | No |
| MZMine 2 [38] | IE lists | No (but still asymmetric) | Random | XIC | Yes |
| MZmine [39] | IE lists | No (but still asymmetric) | No | XIC | Yes |
| OBI-warp [40] | Raw | User | No | XIC | Yes |
| OpenMS [41] | RIE lists | Auto | No | RIE lists | Yes |
| Palmblad [18] | Raw or RIE | User | MS/MS | Yes | |
| PARS [42] | Raw | User | No | TIC or XIC | Yes |
| Peakmatch [43] | IE lists | User | No | XIC | No |
| PEPPeR [44] | RIE lists | User | MS/MS | RIE lists | Yes |
| PETAL [45] | RIE lists | User | No | Spectrum | Yes |
| PMRM [46] | Raw | No | TIC or XIC | Yes | |
| Podwojski et al. [47] | RIE lists | User | Auto | Yes | |
| PTW-I [48] | Raw | User | XIC | Yes | |
| PTW [49] | Raw | User | No | TIC or XIC | Yes |
| Quality threshold clustering [50] | TIP lists | User | Auto | TIC | Yes |
| Radulovic et al. [51] | IE lists | User | No | XIC | Yes |
| RTAlign [52] | RIE lists | No | No | RIE lists | No |
| SAGA [53] | Raw | No | No | XIC | Yes |
| SIMA [1] | RIE lists | No | No | RIE lists | Yes |
| Skov et al. [54] | Raw | Auto | No | XIC | Yes |
| SpecArray [55] | RIE lists | User | No | XIC of RIE lists | Yes |
| STW [5] | Raw | User | No | TIC or XIC | Yes |
| Suits et al. [56] | RIE lists | User | No | RIE lists | Yes |
| SuperHirn [57] | RIE lists | User | No | RIE lists | Yes |
| Supervised alignment [58] | IE lists | User | Common ion features | XIC | Yes |
| Valkenborg et al. [59] | RIE lists | No | No | RIE lists | No |
| Walczak et al. [60] | Raw | User | Auto | XIC | No |
| Wang et al. [61] | Raw | User | Auto | RIE lists | Yes |
| Xalign [62] | RIE lists | User | Auto | RIE lists | Yes |
| XCMS [63] | IE lists | No | XIC | Yes | |
| Zhang et al. [64] | Raw | User | Spectrum | Yes |
Note that the vast majority are warping methods. Blank entries indicate that we were not able to ascertain this detail from the article. See Figure 4 for abbreviated terms.
CORRESPONDENCE IN PRACTICE
To our knowledge, this review contains every non-commercial published LC-MS correspondence method. The disparity in detail of the original articles is reflected in this summary. It is worth noting that the level of scrutiny and, frankly, guesswork needed to construct these textual and tabular summaries (see Table 1) sheds serious doubt on the possibility that most of these algorithms could be reproduced from the original articles. For this reason, we omit from our review any method that is not available as implemented software.
Warping
Warping models systematic shifting. The goal is to trivialize the direct match problem by first reverse mapping the RT shifts of analytes between runs. To do so, analytes are shifted, stretched or squeezed monotonically until an objective function is minimized. Warping is, by far, the most popular approach to correspondence.
Dynamic time warping (DTW) [29] was originally designed for TIC data. DTW warps similar TIPs across runs to minimize the RT distance between them without the use of landmark TIPs. That is, all signals are weighed equally by the distance function. OBI-warp is a modification of DTW where a bijective function is coupled with piecewise cubic hermite interpolation to make a smooth warping function, using the most similar correspondence in each segment as landmarks [40]. While early DTW solutions use only the TIC, OBI-warp uses the mass dimension to generate the similarity function—m/z values are binned and compared with one another.
The approach of correlation-optimized time warping (COW) [25] is similar to DTW except that it prioritizes the alignment of correlated ion features, theoretically boosting its performance on comparative studies, where at least a portion of replicate runs are expected to differ in content. COW uses a piecewise linear alignment, where the data are segmented, and each segment is shrunken or stretched to best fit the reference chromatogram. The original version used TIC data, but later versions accept XIC data. COW and its derivatives require the specification of the segment length, which is not likely to be globally optimal and usually requires a significant number of re-runs to optimize. The performance of COW and its derivatives is sensitive to selection of a reference sample, segment length and slack size. Skov et al. [54] provide a metric for similarity for choosing the reference sample that requires a pairwise comparison of all samples. They also provide a heuristic for selecting segment length and slack size. Bylund et al. propose a modification to COW in which they replace the fixed start and end RT points of the chromatogram to be aligned with a user parameter, allowing for a constant level of flexibility throughout the warp space instead of the constrained warping at the beginning and end times of the original COW method. The authors note that this incurs additional runtime, as multiple settings must be evaluated to find the optimal setting. Additionally, the correlation coefficient is replaced with covariance as the benefit function, which replaces the COW algorithm’s bias of matching segments to small ion features with a bias to match segments to large ion features, minimizing the effect of background noise subtraction. ChromAlign is a method that first roughly aligns the data using RT and intensity, where a pairwise correlation measure is determined via fast Fourier transform (FFT) [23]. Then, the fine-tuned alignment is produced by a COW-like algorithm, except it uses m/z as well as RT and intensity. The rough alignment makes the user-provided slack parameter required for COW unnecessary. After calculating a pairwise correlation coefficient, the algorithm uses dynamic programming to compute the optimal time warping function. The rough alignment reduces the number of elements from each run for which a correlation coefficient must be calculated. It is further optimized by using the FFT to speed up the calculation of the correlation coefficients. Palmblad et al. [18] use a genetic algorithm to estimate the optimal piecewise segment lengths of correspondence between runs using MS/MS identifications as landmarks. Christin et al. [24] use the component detection algorithm (CODA) to focus the COW algorithm on areas with low noise, minimum single data points and good background difference. CODA convolves the data with a moving window, subtracting the windowed mean intensity to detect areas of high information. This method is biased toward high-intensity signals. Suits et al. [56] propose a COW modification that uses RIE lists instead of raw data.
Wang et al. [61] create a warping function that minimizes the intensity differences between RIEs within a user-specified m/z and RT window across runs. The algorithm is limited to 200 mass chromatograms due to the computation required and is unlikely to be able to discriminate RIEs across complex sample replicates.
PARS is a non-linear asymmetric warping method that creates a map for each run that consists of the distance between TIP (or ion feature) maxima in the reference and sample run [42]. The warp function is determined via dynamic programming, shrinking or stretching RT gaps in each sample to best match the reference sample.
Radulovic et al. [51] calculate the monotonic increasing function that maximizes pixel overlap between two runs from a set of ion lists. Intensity values are not used. A wobble function allows slack in overlap calculation, which can be problematic in complex samples where multiple peptides exist within the expanded window.
Xalign [62] first identifies all RIEs. Samples are segmented into m/z and RT windows. A piecewise alignment is conducted within each window across runs. Within each window, the most intense RIE is considered a landmark if it is present in that window for every sample. For a given window, landmarks across runs are considered to correspond. The reference sample is chosen as the sample whose landmark signals have a RT closest to the median RT across all samples. A linear warping function is derived from the landmark RIEs. After warping, the correspondence is generated via a pairwise comparison with the reference sample. For each RIE in the reference sample, a user-defined window is overlaid on the run to be registered. The closest match in RT, m/z and intensity from within the window is considered to be the match to the reference RIE. Although the use of the most intense RIE is helpful to minimize computation, differing intensities are expected for the same analyte across runs, suggesting that the landmark correspondence will in most cases be incorrect.
Parametric time warping (PTW) fits a polynomial (second degree in the original approach, but later expanded to an eight degree polynomial) warping function to minimize the abundance differences between runs [49] using TIC data. Because the focus is on the intensity dimension, this method is reportedly sensitive to any pre-processing steps that affect the intensity of the data, including normalization. It has been shown to not work well on low-intensity ion features [20]. Semi-parametric Time Warping (STW) [5] aligns raw data from samples to a reference sample using a series of B-splines. A modified version of PTW implements a global alignment and replaces the root-mean-square difference metric, which is very sensitive to signal intensity, with a weighted cross-correlation [48]. It also pads the signal with zeros on both sides to prevent sub-optimal edge cases.
Higgs et al. [31] use an MS/MS identification-based method. Peptides that are successfully identified and possess several other characteristics are considered landmarks, which are used for locally weighted scatterplot smoothing (LOESS regression) to align the runs. Assumptions made in this approach are that the RT offset between any two samples is constant, which is not true in practice. Also, the method is only available in Linux and requires a cluster of computers to run.
SpecArray [55] first creates a rough match of RIEs with identical charge and masses within 0.5 Dalton (Da), creating a many-to-many mapping. Then, a warping function is created by minimizing the root-mean-square distance between the reference and a given sample using the initial matches. After this, the residual between the warping function and each RIE is interpreted with a normal function to create a significant value. Matches with significance < are removed. The warping function is then relearned based on the retained matches, and the process continues iteratively until convergence.
PEPPeR is a toolkit that uses a combination of IE detection and MS/MS identification for alignment [44]. First, each run is subjected to MS/MS and any identifiable RIEs are labeled. Then, each unlabeled signal is checked to see if it matches a signal that was labeled in another run using a hard RT and m/z window. This preliminary matching is refined with a least squares quadratic fitting, after which a more strict RT and m/z window is applied. The landmark mappings are used to warp the remaining data. The resulting warp is further refined by clustering the RIEs with a Gaussian mixture model. The authors indicate that their method takes a full day to run on a 400-core cluster.
Fischer et al. [30] use MS/MS identifications as landmarks from which to derive the correspondence between runs, then a non-linear regression function to interpolate the RT of other RIEs.
ChAMS [22] aligns raw data by considering which spectrum in other runs is most alike, limiting this adjustment to a window of 5 spectra (2 spectra before and 2 spectra after). Each spectrum from each run is integrated to a summed intensity. For each pair of runs  , each spectrum from r1 is compared with the spectra from r2 over a window of 5 spectra (the same order, one and two before and one and two after). The two spectra of minimum intensity distance are used to align that segment. The equivalence function ChAMS uses is similar to DTW.
The alignment algorithm proposed as a part of XCMS uses a kernel estimation procedure to cluster ion features with similar m/z values and RTs [63]. Clusters that contain ion features from each sample and no more than one ion feature per sample are used as the basis for regressing the deviation from the median RT of their respective cluster to warp the remainder of the ion features.
LCMSWARP uses MS/MS identifications above a certain confidence as a landmark set to warp samples in a piecewise linear manner; these samples are segmented into RT chunks consisting of 1% of the RT for each sample [32,33]. Each RIE in each sample is matched to the closest landmark reference RIE using the Mahalanobis distance. A piecewise linear warping function is generated from the matches with dynamic programming. Residuals from the warp function are used to refine the normalized RIE elution time and mass.
MZmine assigns each ion feature from each sample to the closest ion feature on the master feature list [39]. If the ion feature under consideration is not within a user-provided threshold for distance (defined by the m/z distance plus the intensity distance times a multiplier set by the user), it is added to the master feature list. Like most methods, this is highly subject to the order in which the samples and ion features are processed and the fact that the optimal value for the multiplier will change intra-run and inter-scan.
Auto-PABS [20], a beam search alignment method, is based on FASTPA, an NMR piecewise linear alignment technique [65]. FASTPA is purported to be fast but is sensitive to two user-selected parameters: a segment number and range for interpolation and shifting. Beam search alignment extends FASTPA by estimating the optimal interpolation range by calculating the FFT cross-correlation between corresponding segments. The segment number is still obtained via empirical search.
AMSRPM is based on a medical image registration algorithm [19]. It produces a non-linear monotonic warping function using TICs, building a correspondence matrix estimating the similarity of two runs using m/z, RT and intensity values of the data. Then, using spline-based regression and simulated annealing, it iteratively updates a warping function until convergence. The authors admit that it neither performs well on complex data nor does it run quickly.
Wang et al. [45] create an RIE lists, reducing raw data to an ‘element spectrum vector,’ a normalized vector where each element is the normalized intensity of the ith m/z ‘pixel’ of the feature and all elements sum to one. This encoding facilitates isotopic envelope and charge state identification. Overlapping isotopic envelopes are an unaddressed problem. They use a least squares regression, minimizing the difference between the observed RIEs and a self-generated reference library.
OpenMS estimates an affine transformation from the reference sample (the sample with the highest number of data points) to a target sample, mapping as many RIEs as possible [41]. The transformation is applied, and matches are identified. Linear regression is used in a second transformation to refine these rough matches. The matching elements are added to the reference, and the process is repeated with the next sample.
SuperHirn obtains MS/MS identifications and links them to the closest RIE via comparing m/z and RT [57]. The first correspondence map consists of all RIEs within a 0.05 Da m/z and 5 min RT window. LOESS regression defines an alignment function, and then the process is repeated. Samples are aligned in order of their similarity, with the most similar samples being aligned first. There are >30 user-set parameters to optimize with this method.
Multiple canonical correlation analysis operates by projecting each run onto a canonical global scale. A subset of RIE identifications are used to learn a warping function that is then extrapolated to all RIEs in the file [34].
The Continuous Profile Model (CPM) [26,27] is a probabilistic generative model that attempts to model a latent trace for alignment using a hidden Markov model where each observation corresponds to a replicate. The model is trained with expectation maximization. Although the method does not require a reference sample, it does require a significant amount of processing time as well as multiple runs for parameter optimization, even after making significant computation-minimizing assumptions (such as limiting the RT shift to three states), which weaken the theoretical strength of the model. Another Bayesian model was proposed by Tsai et al. Here, multiple representative chromatograms are deduced for each run via clustering, while internal standards are used to estimate the experimental RT variation. These two information sources are merged to inform a model of a latent run, yielding an alignment. It is unclear how many random restarts are required for parameter optimization. To reduce the computational time to reasonable lengths, the authors suggest binning the data into a few m/z bins, which would incur a significant information loss.
Podwojski et al. [47] propose three algorithms for non-linear alignment, two that extend previous linear alignment algorithms. Their linear regression method clusters a list of the most intense RIEs from m/z bins of a user-selected width. Those clusters—with no more than one RIE from each run and no missed runs—are used to train a linear regression model. The model is used to interpolate the alignment of the remaining RIEs. Their local linear regression method likewise uses high intensity points to train the model, but uses LOESS instead of linear regression, which produces a locally weighted model via least squares. The method uses a Bayesian information criterion to select the span parameter, which determines the distance function used to determine the local weight map used in the regression problem without requiring user input, as opposed to the version in [63]. Because the fitting uses only local points, it produces a local non-linear mapping function. They propose a modification to the shifting vector method of [41], where an affine transformation is determined for each run compared with a reference run. The most likely shifts are calculated by enumerating the parameters for all possible pairwise shifts between the two runs and selecting the most common parameters. The algorithm in [41] is modified to create non-linear shifts by weighting shifts between closer RIEs as more likely than distant RIEs. All three methods rely on an RT window parameter.
MetAlign has a two-stage alignment process [35]. First, all ion features within a user-defined time window across runs are clustered by intensity for each m/z bin. In the second phase, ion features present across all samples are used as landmarks. At this point, iterative adjustments are made to the position of all samples’ ion features with respect to a reference sample, where points are adjusted based on the average time difference of points within an RT window. With each iteration, the RT window reduces in size.
IDEAL-Q uses MS/MS-identified ion features as landmarks to regress a linear warping function from a reference [13]. The m/z window used to identify a match is ±0.2 Da, which is wide enough to include several peptides in a complex sample.
MZMine 2 [38] is a completely different algorithm than MZMine. The samples are divided into rows whose width is set by the user to be the highest observed deviation in RT among all ion features. Then, the RANdom SAmple Consensus (RANSAC) algorithm (a long-standing method for fitting a model to data with outliers) and LOESS regression are used to estimate the optimal window size (in m/z and intensity) for alignment matching. This algorithm produces a linear alignment function.
Quality threshold clustering works by clustering TIPs using minimum membership and maximum width parameters [50]. TIPs within the same cluster are considered matches, and excluded TIPs from the clusters that did not meet minimum membership size are interpolated via a support vector machine regression warping function.
Simultaneous multiple LC-MS alignment begins correspondence by randomly pairing all samples [1]. The most likely pairing of RIEs between each run pair is established via the stable marriage algorithm [66]. Then, each pair’s similarity is calculated as the sum of the weighted distance between each matched RIE’s m/z, RT and charge state. Matched RIEs are added to a master RIE list in sorted order, with the most similar pairing first, with each master RIE aggregating the most similar new RIE pair via average m/z and RT. This method is asymmetrical and will not perform well when RIEs are missing on some samples, as the corresponding RIE will be force matched with the next most similar RIE. After matching, the maximum likelihood alignment path is established to provide a warping function. Why there needs to be a function at this point, as correspondence has been established, is not clear.
In supervised alignment, the sample with the highest global pairwise correlation coefficient is selected as the reference [58]. Ion features common across all samples are identified by the user. These ion features are used to extrapolate a linear warping function that is then applied to all samples. The interpolation method is not stated in the publication.
Kaya et al. [53] present an algorithm that is not subject to the non-smooth warping function and quadratic space and time constraints of most extant methods. They use an ordinary differential equation combined with a weight function, which is optimized with a genetic algorithm for alignment. Genetic algorithms are subject to the same necessity of random restarts as Bayesian methods, as there is no guarantee of global optimal convergence. Values of the chromosome length, population size and maximum generations must be optimized and vary widely, suggesting a large range of runs to fix the best values.
Zhang et al. [64] approach alignment as a recursive comparison problem. For each sample, the recursive process iteratively chooses the linear RT shift (of ∼50 fixed options) that maximizes the similarity function (RT, m/z, intensity) of landmark signals in the segment, then divides the segment in two and begins again. The non-landmark signals are shifted if they are included in the segment. This method is fast and simple, but is highly reliant on the reference sample and landmarks selected and cannot account for swapped order or non-matched signals or large intensity deviations.
Direct match approaches
Direct match approaches attempt to establish a correspondence based only on similarity between specific signals from run to run, without applying a warping function. RTAlign [52] is a simplistic method that matches RIEs across samples that occur within an RT window. It is unclear how RIEs in complex sample replicates can be resolved only via RT discrimination. Peakmatch [43] similarly matches each ion feature of each run to the closest feature in the reference sample within an RT window of possibilities. The authors state that their method does not work well on the overlapping ion features typical of high-resolution data. It also requires that the shift amount be less than the typical RT time between ion features. They minimize the weakness of requiring a reference sample by creating the reference sample as the mean of all samples.
In fuzzy warping, a set of landmark ion features in a reference sample is assigned a Gaussian membership function in RT, while each reference feature from an unaligned run is compared with the Gaussian to generate an intersection matrix [60]. The matrix is converted into a quasi-probabilistic measure using Sinkhorn standardization. This process continues iteratively as the width of the Gaussians is reduced until convergence. This function is then used to interpolate all other ion features between the two runs.
Many of the above-mentioned algorithms use clustering as a pre- or post-processing step to warping. However, some algorithms attempt to cluster features directly. DeSouza et al. [28] separate runs by experimental condition, cluster TIPs within these groups, then cluster them across experimental conditions, using the cluster assignments as an alignment grouping. The dendrogram cutoff for feature assignment is where the maximum average number of features per run occur. A similar clustering approach is proposed by Valkenborg et al. [59] where RIEs of similar mass and RT are clustered allowing for 1 min RT shift. MSInspect establishes a correspondence of all RIEs that match the AMT database created from MS/MS peak identifications [36,37]. This approach is limited by the coverage and accuracy of MS/MS identifications.
MassUntangler creates a correspondence by analyzing similarities between the isotopic envelopes of analytes between runs [15]. An initial rough correspondence from every analyte to every other analyte is refined by filtering out disagreements between one-way matches. A hard RT difference threshold further filters matches. The use of charge state is unique among existing correspondence methods.
LIMITATIONS OF CURRENT METHODS
Despite the large number of methods proposed to align LC-MS experiments, some shortcomings still abound, namely:
Model assumptions that fail to capture real behavior.
Long run times due to algorithm complexity and user-defined parameter optimization.
Pairwise comparisons and reference samples.
Current methods have not been empirically compared.
Model assumptions that fail to capture known behavior
There are certain characteristics of LC-MS data shifts that are well known: not all analytes appear in all replicates, elution order can swap, shifts occur in m/z as well as RT, MS/MS capture rates are low, etc. Any viable model ought to capture as many of these characteristics as possible. However, each current approach fails to model at least some of the known behaviors of LC-MS data.
Warping has some theoretical limitations. Warping cannot correct component-level shifts because the warping function operates on a systematic level, the scale of which is bounded by computational complexity (the more segmented the warp function, the more computation required). Warping methods typically deform the original signal, which is detrimental to comparative/differential analysis, where feature intensities are targeted for comparison after features are matched across samples [19,48]. Warping requires the selection or construction of a reference sample, making for a non-symmetric solution: changing the order of comparison/reference results in a different alignment. An alignment method should handle the trends that span and develop across many runs, which are a real challenge to methods that require a target sample, since trends are progressive. That is, a reference from the beginning, middle, end or even an average will all be significantly different than some other section of the runs. One purported benefit of warping is that it provides a smooth mapping function. However, the shifting behavior between runs is often not smooth.
Warping methods that use clustering are robust to missing signals across features due to the fact that all features from all samples are combined and clustered independent of the run of origin. However, this is also a shortcoming, as features originating from the same run, and therefore not eligible to be identified as the same analyte from different runs, can be just as readily matched as features originating from different runs. Additionally, hierarchical clustering methods require some method for thresholding, which typically is left as yet another user-optimized parameter.
It must be remembered that the goal in correspondence is not an alignment but the correspondence mapping of identically sourced features across all runs [6]. The warping factor is not homogeneous among all features in a sample, as demonstrated by the fact that there is a different optimal warping function for each landmark. When these are extrapolated to non-landmark features, error is certainly introduced.
Almost every method reviewed here makes the incorrect assumption that elution order is preserved across runs [15]. Warping methods are always monotonic. It is known that individual compounds shift non-monotonically [48]. This makes the incorrect assumption that distortions reversing the elution order do not occur or are rare [41]. Analyte elution order swapping is a likely event if the RTs are similar [6]. Changes in elution occur even in homogeneous experiments where all available controls for variation are implemented [6]. Algorithms without the ability to change elution order during correspondence cannot correctly match data sets that display this common characteristic. The exception to this is if the features that change order have different masses and the mass channels are warped independently [4].
Even the most sophisticated mass spectrometers demonstrate mass error, yet few methods account for mass deviations. Though systematic mass can be temporarily mitigated through calibration, random mass shifts due to changes in electric fields, space-charge effects, temperature, etc. are not calibratable [10]. Shifts in m/z are sure to influence RT alignment, and more importantly, influence feature correspondence.
Correspondence algorithms can use raw data, TIPs, ion features, IEs or RIEs. Arguments have been made against feature detection before correspondence. Critics rightly contend that any processing step before correspondence can result in loss of information and model bias. This argument is particularly true of denoising and baseline subtraction methods. However, a correctly detected feature provides membership information, something that individual data points lack, thus allowing RT order swapping for contiguous entities, a shift not allowed with individual data points. What is more, the abundance of noise points in LC-MS data (contaminants, spurious detections of data not present and background noise) suggests that alignment methods that favor all data points equally may lend too much credence to the noise points in the alignment function. Feature selected data not only obviates the need to process noise points but also provides compression by reducing the collection of data points comprising a feature to as little as a single (intensity, m/z and RT) tuple. Because the distribution of a given analyte across charge states can vary from sample to sample in an experiment, deconvolution and de-charging may prove important to solving correspondence. This requires feature detection. Without feature detection before correspondence, overlapping features will remain convolved. This is likely to cause a problem, as it is unlikely that overlapping features in one run will remain overlapped in all other runs.
Many methods for correspondence rely on identifying at least a subset of features in a run before correspondence. Such an approach is infeasible for metabolite analysis, where data sets and theoretical databases are so dense (containing isobaric species) that species can only be identified with a limited degree of certainty. Proteomic runs still suffer from the reliance on MS/MS identification due to co-eluting precursor ions, small MS/MS capture rates, and incomplete databases [57,34]. As the number of samples in an experiment increases, the fraction of peptides measured in every sample rapidly decreases [55], meaning that MS/MS landmark methods will have less available landmarks as the number of samples increases, which is exactly opposite the desired situation.
Algorithm complexity and user-defined parameter optimization
Practitioners would like to have an upper bound expectation of how long a correspondence algorithm will take to run. User-defined parameters preclude this expectation, as optimization of such requires an inconsistently long run time because it is impossible to predict how many runs will be required to come up with the optimal solution. Another important question is whether parameters can truly be optimized on a given problem without access to labeled data to gauge the accuracy of the solution. Because parameter optimality generally varies widely depending on the data set under consideration, this presents a real issue, since correspondence is unknown [67,68]. Parameter values increase the reporting burden, as each must be meticulously communicated in order to fully reproduce experimental outcomes.
Any algorithm that includes a stochastic component, such as random restarts in CPM, is particularly susceptible to run time uncertainty. With randomization, there is no way to know  how long it will take to obtain a solution, as randomization is essentially a guess at one or more parameters.
Computational complexity increases runtime, which is especially undesirable in the presence of parameters that need to be optimized. One way to reduce computation is to make assumptions about the data to trim down the computation space. For example, correspondence possibilities are limited to a small RT and m/z window. This makes it impossible for shifts outside of this window to be correctly identified. It is known that experiments with many replicates can produce RT shifts of >1 min across samples [31]. Another tactic is to split the alignment into two phases: a computationally inexpensive rough alignment followed by a computationally expensive refining alignment. The danger in a two-stage approach is that the rough alignment does not preserve the temporal proximity of the original data, which is the only information that can be used by the second refining alignment. One benefit of a warping function approach is that regression for a warping function using landmarks requires far less computation than an exhaustive consideration of correspondence, which increases exponentially in the number of data points considered.
Correspondence, although capable of capturing all known LC-MS behavior, requires more rigorous algorithms compared with alignment approaches, due to the necessity of bringing to bear all information encoded in the data while minimizing computational complexity and the number of user-set parameters. To date, no algorithm has achieved this delicate balance.
Pairwise comparisons and reference samples
All methods above except CPM and XCMS require a reference sample. This causes an asymmetric solution based on the reference chosen. One way to consider this is that the choice of a reference is yet another user-defined parameter, and the only way to know whether a better solution exists is to try every possibility. Any method that uses a reference requires that the algorithm be run n times (where n is the number of runs in the experiment) in order to assert that the solution is optimal. Some have proposed workarounds to methods that require a reference. Using all runs at once usually leads to degraded results. Averaging, for example, leads to loss of data. Reference-based methods’ assumption that chromatographic conditions are homogeneous across runs does not hold true in comparative studies, or in experiments carried out across different machines, at different times, or in different laboratories.
Lack of comparative evaluation
Despite the abundance of methods proposed for correspondence, we are only aware of a single comparative evaluation [6]. Most articles are not compared against any other method at all (see [69]). The few that compare results with other methods mostly use methods like coefficient of variation that are qualitative and do not necessary correlate with real world results. The bloat of essentially similar methods is due in large part to the free pass given to researchers to publish algorithms that are not demonstrable improvements over previous contributions.
Criteria for evaluation ought to focus on accuracy of correspondence, such as the percentage of true correspondence captured. MS/MS identifications provide a minimal set of true feature correspondences. Of course, this cannot be used in methods that incorporate MS/MS identifications. An improvement would be to use in silico simulated data sets (see [70]) or hand-labeled data sets to improve the label coverage, particularly among those difficult to capture with MS/MS, such as low-intensity signals.
CONCLUSION
Current approaches to LC-MS correspondence are numerous and varied, yet share a host of drawbacks that must be considered during the design of next generation of algorithms. Because certain drawbacks are unavoidable with alignment approaches, correspondence—rather than warping functions—ought to be the focus of solutions. Methods with user-defined parameters need analytical and automatic solutions. All methods ought to have bounds on run time. Reference samples and fixed RT and m/z comparison windows are undesirable.
Because there are already so many correspondence algorithms, we strongly suggest that any new algorithms abide by the above-mentioned criteria. Additionally, we reiterate that all novel algorithms for correspondence ought to demonstrate empirical superiority over extant algorithms in order to be accepted for publication.
Run to run analyte RT and m/z variation is caused by many factors, which can only be partially controlled.
A large number of correspondence algorithms have been proposed for LC-MS.
Newly proposed correspondence algorithms suffer from long-standing drawbacks such as discrepancy between model assumptions and known behavior, long run times, user-defined parameters, reference samples and lack of empirical evaluation.
Future correspondence algorithms should include empirical comparison with at least some of the algorithms highlighted in this review and should aim to overcome the limitations highlighted in existing methods.
FUNDING
This work was supported by the National Science Foundation Graduate Research Fellowship [DGE-0750759] to R.S.
