


Abstract
The formation of phenotypic traits, such as biomass production, tumor volume and viral abundance, undergoes a complex process in which interactions between genes and developmental stimuli take place at each level of biological organization from cells to organisms. Traditional studies emphasize the impact of genes by directly linking DNA-based markers with static phenotypic values. Functional mapping, derived to detect genes that control developmental processes using growth equations, has proven powerful for addressing questions about the roles of genes in development. By treating phenotypic formation as a cohesive system using differential equations, a different approach—systems mapping—dissects the system into interconnected elements and then map genes that determine a web of interactions among these elements, facilitating our understanding of the genetic machineries for phenotypic development. Here, we argue that genetic mapping can play a more important role in studying the genotype–phenotype relationship by filling the gaps in the biochemical and regulatory process from DNA to end-point phenotype. We describe a new framework, named network mapping, to study the genetic architecture of complex traits by integrating the regulatory networks that cause a high-order phenotype. Network mapping makes use of a system of differential equations to quantify the rule by which transcriptional, proteomic and metabolomic components interact with each other to organize into a functional whole. The synthesis of functional mapping, systems mapping and network mapping provides a novel avenue to decipher a comprehensive picture of the genetic landscape of complex phenotypes that underlie economically and biomedically important traits.
GENETIC MAPPING
One of the major tasks in modern biology is to map and characterize the genetic architecture of complex traits and use this knowledge to predict the response of biological structure, organization and function to changing environment [1, 2]. One important challenge in achieving this task is posed by the multifactorial and architectural complexity of biological traits. To infer and establish the genotype–phenotype relationship at the level of individual genes, known as quantitative trait loci (QTLs), genetic mapping pioneered by Lander and Botstein [3] has been used in a diversity of traits and organisms [4–6]. The past two decades have seen an explosion of interest in developing various statistical approaches for genetic mapping of complex phenotypes [7–13].
The defining principle of QTL mapping is based on the identification of significant associations between DNA-based polymorphic markers and phenotypic variation in order to link the genotype to the phenotype. This approach allows us to dissect a complex phenotypic trait into its underlying DNA variants distributed in various regions of the genome. For example, the difference in stem length between two plants may be attributed to their different DNA genotypes at particular loci (Figure 1). Quantitative genetics has gained revolutionary insights due to the widespread use of gene mapping [14]. In fact, this newly acquired knowledge has been successfully applied in breeding programs [5] and medicine [6]. Although useful to varying extents, QTL analyses based on simple statistical tests to identify the direct relationship between genotype and end-point phenotype do not reveal a complete picture of the genetic architecture of complex traits. Focusing on end-point phenotypes leaves out of the analysis all the developmental and genetic factors that shape the phenotype. For instance, consider the acquisition of certain height or weight over different lengths of time. The same end-point phenotype could be attained through different developmental trajectories each controlled by a different set of genes. This example underscores the limitations of bulking similar end-point phenotypes for standard QTL analysis.
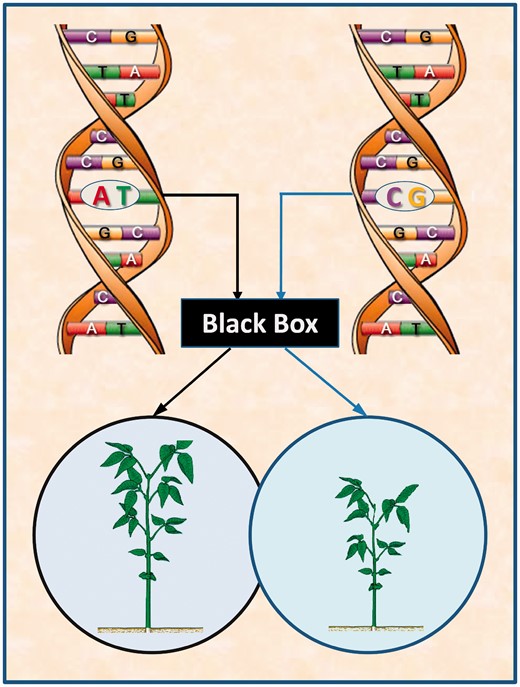
Traditional genetic mapping that links DNA variation (AT versus CG) in a region of the plant genome to phenotypic variation in static plant traits, such as leaf display, through a statistical test. This approach simply considers the biochemical pathways from DNA to the phenotype as a black box, unable to address the biological complexity of phenotypic formation and development.
It is widely recognized that almost all organ traits undergo a developmental process during which their level of complexity increases [15]. Thus, development is a dynamic process in which genes play a critical role in regulating the pattern of trait development through their interactions with morphogens [16]. In addition, DNA variants can affect phenotype formation by altering to some degree biochemical pathways and regulatory networks directly involved in the shaping of a particular phenotype [17–19]. The developmental pattern of genetic control can now be documented at both the spatial and temporal levels by two complementary and potentially synergistic approaches: global analysis of gene expression, and functional and systems mapping; the latter are two statistical models for mapping dynamic traits. In this Opinion article, we present a new conceptual framework of mapping complex phenotypes by integrating knowledge of how genetic information is integrated, coordinated and, ultimately transmitted through regulatory networks to enable biological functions that shape high-order traits. We will also argue how a comprehensive genotype–phenotype map can be charted through the merger of this framework and functional and systems mapping.
FUNCTIONAL MAPPING
Conventional QTL mapping experiments require three basic steps: (i) genotyping a segregating population with a relatively large number of DNA-based markers, (ii) phenotyping the populations at a specific point in time, usually the end-point (final size, weight, etc.), and (iii) identifying significant associations between the genotype and the phenotype. This approach, however, has a major limitation because it fails to analyze the genetic components of trait development that lead to phenotypic variation over time. This limitation can be overcome by functional mapping [12, 20–23], a new QTL mapping approach that takes into account the dynamic nature of trait development. It accomplishes this task through a statistical analysis of the mathematical function that best represents the growth or developmental trajectory of a segregating trait using parametric or nonparametric models [21] (Figure 2). Thus, functional mapping has the ability to identify QTL, which may play critical roles in trait development at a specific period in time. Overall, functional mapping displays increased statistical power and stability by reducing the number of parameters to be estimated.
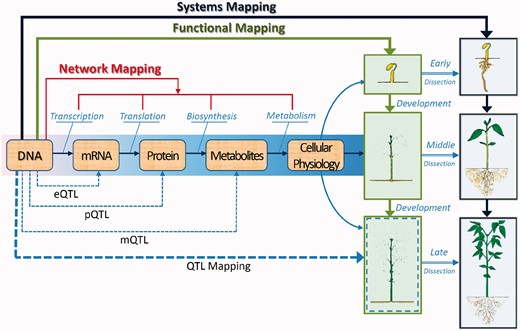
Biological networks that are involved in trait formation and development. Genetic mapping is moving from a direct genotype–phenotype correspondence (Figure 1) to regulatory networks that underlies the formation of a phenotypic trait. Functional mapping associates DNA variants with the developmental process (early, middle and late) of a trait, such as plant height, facilitating the elucidation of the developmental and genetic basis of trait variation. Systems mapping extends the dynamic idea of functional mapping to dissect the phenotype into its interrelating components based on design principles and then map QTLs that determine each of the components and component–component interactions and coordination. In this example, systems mapping dissects plant height into its leaf and root components over a time scale and study how leaf and root traits coordinate and compete with each other to affect height growth. Now, network mapping combines the advantages of functional mapping and systems mapping to identify eQTLs (for gene expression), pQTLs (for protein expression) and mQTLs (for metabolic expression) and their genetic interactions that control regulatory networks that cause the final phenotype. Network mapping entails the integrative and innovative use of different tools from diverse disciplines, such as genetics, mathematics, development, statistics, computer science and engineering.
From a statistical standpoint, functional mapping strives to jointly model mean-covariance structures for a longitudinal trait, i.e. a trait measured repeatedly over a period of time. However, in contrast to the general treatment of longitudinal problems, functional mapping integrates parameter estimation and the testing process within a mixture-based framework in which each mixture component is assigned a biological rationale. Unlike traditional mapping models that normally do not consider biological processes, functional mapping yields biologically relevant genetic information because it embeds the mathematical aspects of biological processes (e.g. growth equations) within the estimation procedure of QTL parameters. Thus, results obtained by functional mapping provide a mechanistic and realistic perspective of biological systems. Specifically, functional mapping has been shown to address the following fundamental biological questions:
How does a specific QTL affect the pattern of development? Functional mapping can determine the timing at which the QTL is switched on and off and the period of how long the QTL is at work [21].
Are there any distinct temporal patterns of QTL effects in a time course? When used to study the genetic control of thermal performance, for example, functional mapping can identify whether hotter–colder, faster–slower or generalist–specialist QTLs exist to control thermal performance curves of growth rates [24].
How do developmental and environmental stimuli impact on the expression of a QTL? Genes affect phenotypic development through internal (developmental) and external environments. Functional mapping can characterize how different environmental stimuli activate the expression of new QTLs and guide the direction of their expression [25, 26].
What is the overall picture of the genetic architecture of dynamic traits? Functional mapping can test whether pleiotropic QTLs contribute to genetic correlations between vegetative growth and reproductive behavior [22]. In particular, it can also test how different QTLs interact to form a dynamic web of epistatic network to regulate growth and development.
SYSTEMS MAPPING
Functional mapping is a dynamic model for mapping QTLs because it treats trait development as a process. Indeed, any complex trait is formed in a dynamic system that consists of various interacting parts or gene networks, each with different levels of complexity and defined spatial and temporal patterns of expression. The behavior and outcome of this system, i.e. the resulting final phenotype, can be changed when one or more key components of the system are replaced by a variant [27]. However, to understand the basis of genotype-dependent changes of the phenotype, we need to understand how different system parts are coordinated and organized, as well as the genetic mechanisms that underlie their coordination [28].
A fundamental principle and approach for mapping QTL associated with a complex dynamic system has been formulated by linking different parts of the system with robust mathematical equations and integrating these equations into a statistical framework for genetic mapping. This approach, called systems mapping [29], deploys a system of differential equations to describe and quantify the dynamic behavior of a biological system and manipulate its high complexity (Figure 2). Systems mapping allows for the quantitative testing of biologically interesting hypotheses about the genetic mechanisms that control the interactions patterns among integral parts of the system and the emerging properties of the whole system.
During plant growth, biomass allocation to different organs (stem, branches, leaves, seeds, coarse roots and fine roots) tends to produce an optimal architecture that maximizes the capture of nutrients, light, water and carbon dioxide through a specific developmental program [30]. Thus, plant growth is a highly coordinated activity in which biomass is partitioned to the various organs according to the need while maintaining a physiological balance among them dictated by basic biological principles. A system of ordinary differential equations (ODEs) has been derived to model the dynamic allocation of carbon to different organs during growth in relation to carbon and water/nitrogen supply by integrating coordination theory [31] and allometric scaling [32, 33]. Systems mapping can quantitatively and precisely identify genes that govern the mechanistic relationships and interactions among system components. This task can be accomplished through various tests for individual ODE parameters, or combinations of them. Some mechanistically meaningful relationships that have been examined include:
Size-shape relationship—Systems mapping can analyze whether a big plant is due to a big stem with sparse leaves or dense leaves with a small stem [34].
Structural–functional relationship—Systems mapping can detect whether a plant tends to allocate more carbon to its leaves for CO2 uptake or to roots for water and nutrient uptake when the environment changes [35].
Cause–effect relationship—Systems mapping can determine whether more roots are due to more leaves or more leaves produce more roots in a particular environment [36, 37].
Pleiotropic relationship—Systems mapping can quantify how some QTLs pleiotropically control morphological integration in which different traits with a similar function tend to integrate into developmental modularity [38].
A better understanding of these relationships will help us gain additional insights into the mechanistic response of plant size and shape to developmental and environmental signals and, also, provide guidance to select an ideotype of crop cultivars with optimal shape and structure suited to a particular environment.
A BIG PICTURE OF LIFE
Existing genetic mapping methods are an intrinsic reductionist approach because they usually do not take into account the high-dimensional nature of gene expression—spatio-temporal patterns, transcriptional and post-transcriptional controls in the context of regulatory gene networks involved in trait formation. The emergence and development of any phenotype are carried out within a living system in which the ‘Central Dogma’ of biology, as a fundamental rule, controls and directs the life process according to: DNA → mRNA → enzyme (inactive) → enzyme (active) → metabolite(s) → metabolism → cellular physiology → phenotype (Figure 2). The pathways and processes from DNA to phenotype can be viewed as a biological system comprised of large populations of elements that function together within the system according to unique design principles. Thus, the phenotype can be defined by the structure and dynamics of the system. These two characteristics jointly establish the essential property of a biological system, robustness, with which single perturbations will rarely cause functional failure [39, 40]. There are two sets of digital information that play a central role in assembling different parts of the system; together, these sets coordinate with each other and with the surrounding environment. The first set comprises genes that encode proteins, which play specific structural and functional roles. The second comprises regulatory networks in which the genes interact with each other and with their products in a manner that reveals a complex web of dynamic co-expression in time and space [41]. While genetic information can operate over such a wide range of time scales: tens of years to hours (life cycles) and weeks to milliseconds (physiology) [42], the biological phenotype it determines can be expressed at multiple levels of organization, from the molecular to the organismal level [40].
Current biotechnologies allow the high-throughput measure of gene expression, a process by which inheritable information from the DNA sequence is converted into a functional gene product (such as RNA or protein). Nowadays, it has been increasingly feasible to measure the whole set of genes of a biological system (genome), the entire set of RNA transcripts of the system (transcriptome), the entire collection of proteins (proteome) and the entire range of metabolites taking part in a biological process (metabolome). Another technological development has facilitated the measure of organismal phenotypes, such as embryo growth trajectories, heart 3D shape and plant root architecture. It is also possible to measure a complete set of phenotypes (phenome) for some organisms, such as humans [19] and Arabidopsis [43]. The availability of these omics data entails the development of computing models to analyze the interactome (complete set of interactions between proteins or between these and other molecules) and localizome (localization of transcripts, proteins, etc.) and ultimately relate these to the organization and function of the biological system [41, 44, 45].
NETWORK MAPPING
Many studies have been carried out to map QTLs that affect gene expression (eQTLs), proteomic (pQTLs) and metabolomic profiles (mQTLs) (Figure 2) by dissecting the phenotype into its genetic regulatory networks [19, 46–48]. However, most of these studies associate DNA polymorphic markers with expression profiles of individual genes, proteins or metabolites, without considering intrinsic gene–protein–metabolite interaction networks. Such single-level analysis cannot extract information related to the control of gene expression between the transcriptional and post-translational levels. What is needed is an approach that can provide insight into interaction networks of genes during cell cycle, cell differentiation, signal transduction and metabolism, all processes that form a phenotypic trait.
Modeling dynamic regulatory networks
The information available from omics research can enable us to assess multiple features of complex systems at various levels of biological organization, from the cell to the whole organism within a defined and fully delineated framework. The challenge is therefore to decode this information in the context of the physiology of the system [49, 50].
It is imperative to have a good understanding of the pattern and control of gene expression and the physiology of a biological system if we are going to construct a model to assess the capabilities of such system [49]. Classic correlation methods or multivariate statistics have been used to correlate gene expression data with proteomic and metabolomic data [47, 48], but they fail to capture the true quantitative variation and relationship between activity of thousands of gene–protein couples or protein–metabolite couples in a cellular system. To do so, we need to consider several critical factors, i.e. the time displacement of the genetic and protein synthetic and post-translational events, their different timescales and their half-lives. ODEs that have been widely used to model electronic networks in engineering may play a part in describing regulatory networks of a biological system [51–56]. These ODE methods were applied to model the regulatory network of Halobacterium salinarum, suggesting that the model could predict mRNA levels of 2000 out of a total 2400 genes found in the genome [49]. A similar application was implemented to model human regulatory networks (TLR-5–mediated stimulation of macrophages) and several other microbial networks [54].
Mapping dynamic regulatory networks
It is feasible to derive a dynamic model for mapping the biochemical pathways of trait formation and development, and identifying the mechanistic networks involved in the generation of a high-order phenotype by integrating the basic principles of functional mapping and systems mapping. Although a regulatory network usually has a complex structure, robust mathematical models like differential equations have proven a powerful means for simplifying and summarizing this complexity. We use a simplified example of gene expression to show how network mapping is developed,
Four processes determine the expression of a gene into its protein: transcription, translation, mRNA degradation and protein degradation, as depicted below [57].

By integrating ODEs (1) and DNA polymorphic markers through a mixture model framework, a new dynamic model, called network mapping, can be derived. In Box 1, a statistical procedure of deriving network mapping is described. Network mapping is equipped to estimate and test ODE parameters for different QTL genotypes inferred from DNA marker information based on QTL-marker linkage or linkage disequilibrium [58]. Consider an ODE parameter set Θ1 = (k11,d11;k12,d12) ≡ (0.2,0.9;0.9,0.25), with which we plot the dynamic behavior of mRNA and protein expression (Figure 3A). If a QTL affects the dynamic system of gene–protein expression (1) by changing one or more parameters, we obtain different behavioral dynamics of expression profiles as shown in Figure 3B with Θ2 = (k21,d21;k22,d22) ≡ (0.25,0.9;0.9,0.35) and Figure 3C with Θ3 = (k31,d31;k32,d32) ≡ (0.3,0.9;0.9,0.45). Pronounced differences in curve form show a high sensitivity of gene and protein expression to parameter changes and, therefore, genotype changes. The genetic control of the correlation dynamics of gene and protein expression can be visualized by displaying genotype-specific phase planes (Figure 3D). Phase-plane analysis reveals the equilibrium points of the gene–protein expression system, showing the pattern of how a QTL controls the equilibrium point. Network mapping embeds a procedure of testing whether a QTL pleiotropically controls gene expression and protein expression. Computer simulation has provided basic information about the power of QTL detection and the precision of parameter estimation by network mapping given different sample sizes, measurement errors and the number of time points [30].


 is the delta based on the slope at the beginning of the interval, using
  ;
;  is the delta based on the slope at the midpoint of the interval, using
  is again the delta based on the slope at the midpoint, but now using
  the delta based on the slope at the end of the interval.
The Runge–Kutta fourth order algorithm with step size h = 0.1 is used to approximate the solution in high accuracy given a trial set of parameter values and initial conditions.
Next, we need to model the covariance structure by using a parsimonious and flexible approach such as an autoregressive, antedependence, autoregressive moving average or nonparametric and semiparametric approaches [74]. In likelihood (B1), the conditional probabilities of QTL genotypes given marker genotypes can be expressed as a function of recombination fractions for an experimental cross population or linkage disequilibria for a natural population [58]. The estimation of the recombination fractions or linkage disequilibria can be implemented with the EM algorithm.
In a regulatory network, it is common that different genes interact and coordinate to determine an intermediate step towards phenotypic formation. Network mapping allows gene–gene interactions to be tested in a quantitative way. Consider three genes that operate in a network [41] depicted graphically as below:

Gene 1 is constitutively expressed, and is repressed by gene 3. Therefore, its level may reach a maximal rate of increase (k1s where s stands for synthesis) when the level of gene 3 is 0, in which case k1s will be multiplied by 1. When the level of gene 3 is non-zero, the level of gene 1 rises more slowly than k1s. Transcription of gene 2 is activated by gene 1, with the expression level of gene 2 rising as a Michaelis–Menten function of the level of gene 1. Similarly, transcription of gene 3 is activated when both gene 1 and gene 2 levels are non-zero.

Each equation in system (B4) shows the change in the level of a gene as a difference of its synthesis and degradation through a set of 10 ODE parameters (k1s,k2s,k3s,k1d,k2d,k3d, k21,k31,k32,k13). By testing these parameters singly or in combination, we can determine how an eQTL affects the pattern of co-expression of different genes. For example, the test of how gene 1 and 2 are co-expressed is based on the null hypothesis H0: k21j ≡ k21 (for j = 1, … , J).
To show the effect of eQTLs on the dynamic system of gene co-expression, we assume three groups of parameters (k1s,k2s,k3s,k1d,k2d,k3d, k21,k31,k32,k13) = (2,2,15,1,1,1,1,1,1,100) for QTL genotype 1, (2,2,15,0.8,0.8,0.8,1,1,1,100) for QTL genotype 2, and (2,2,15,1,1,1,0.8,0.8,0.8,100) for QTL genotype 3, which produce different patterns of trajectories of gene expression in a time course as shown below:

Network mapping can be extended to map eQTLs and their interactions for more than three genes expressed on a time scale. A particular mathematical treatment is needed to assure the stability of the estimates of parameters for a high-dimensional system of ODEs.
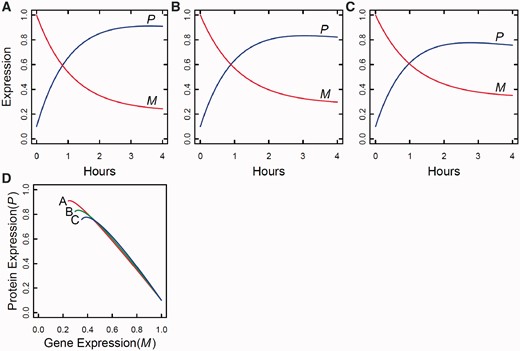
Dynamic changes of gene and protein expression in a time course, with the pattern and behavior depending on different QTL genotypes (A, B and C). In (D), a phase plane analysis is conducted for the three genotypes, showing their different patterns of gene–protein expression dynamics.
Network mapping described in Box 1 can be readily extended to characterize the effects of genetic interactions between different QTLs by incorporating multiple QTLs into likelihood (B1). If there exist an eQTL and a pQTL, co-located at a given genomic region, which control gene and protein expression dynamics, respectively, in a manner that is specified by system (1), then network mapping allows the overall genetic architecture of transcriptional regulation to be elucidated as follows:

From the above graphic presentation, we can address several important questions: (i) does the eQTL pleiotropically control protein expression as shown by the dash line with an arrow? Similarly, does the pQTL pleitropically controls the gene expression? (ii) do the eQTL and pQTL interact with each other to determine gene expression, protein expression or both? (iii) is the correlation between gene and protein expression due to either the pleiotropic control of these two QTLs or their genetic linkage in the genome? (iv) can we identify how each QTL affects different processes, transcription, translation, mRNA degradation and protein degradation, by testing individual parameters in Θ = (k1,d1;k2,d2)?
In practice, a biological system comprises of multiple genes and multiple proteins that interact with each other and are co-expressed across a time-space scale [41, 57]. Box 2 provides such an example of multiple-gene interactions. The basic procedure of network mapping given in Box 1 can well be used to map the regulatory network of this system by applying or deriving a high-dimensional system of differential equations with more complex structure (Box 2). Towards a fuller understanding of the genetic causes and consequences of transcriptional regulation networks that lead to a final phenotype, this approach allows testing a series of hypotheses about the pattern of expression of a gene set, a protein set or a gene–protein co-expression.
COMPREHENDING GENETIC ARCHITECTURE
Phenotypic traits are usually determined by many genes, acting with various effects and manners and interacting with one another, and also with a capacity to adjust genetic expression in response to environmental and developmental signals [14]. These activities of genes are cumulated to form a complex network of actions and interactions. The genetic architecture of a complex trait describes the structure and dynamics of this network. The more gene activities listed, the more comprehensive genetic architecture elucidated. Network mapping enjoys the incorporation of all the activities that constitute genetic architecture.
In recent years, new sources for genetic variation have been recognized and studied, including single nucleotide polymorphisms (SNPs), insertions or deletions ‘indels’ and copy number variants [59]. With the increasing availability of these data, genome-wide association studies (GWAS), aimed to identify a complete set of genes affecting a complex phenotype or disease, have become one of the most important tools in genetic research [59]. The implementation of network mapping into GWAS can greatly refresh our understanding of how and where a phenotype is originated.
Another important source, genomic imprinting, has been increasingly studied. This phenomenon results from epigenetic marks, causing different patterns of expression of certain genes depending on their parental origin [60–62]. These so-called imprinted genes violate the classical Mendelian inheritance, which are either expressed only from the allele of the mother, such as H19 or CDKN1C [63, 64], or from the allele of the father, such as IGF-2 [65]. From a quantitative genetic perspective, genomic imprinting may provide the organisms with evolutionary merits by activating additional genetic variation and conferring a fitness benefit when the environment changes [66, 67]. Currently, different forms of genomic imprinting have been detected in a variety of species and thought to play an important role in regulating crucial aspects of embryonic growth and development as well as pathogenesis [61]. Recent bioinformatic analyses suggest that the number of imprinted genes may be higher than we thought previously, although this remains to be demonstrated experimentally [62].
Genomic imprinting can also be incorporated into network mapping through a family design in which both parents and their progeny are genotyped while the phenotype is measured on the progeny. Li et al. [68] proposed a sampling strategy to estimate genetic imprinting expressed at the individual gene level by sampling nuclear families at random from a natural population. Using reciprocal crosses, Wang et al. [69, 70] formulated a model to compute different types of imprinting effects and their interactions with other genetic effects; this model allows the test of whether imprinting effects are reprogrammed in the process of embryonic development or transmitted to next generations. There is no difficulty in implementing these designs into network mapping, facilitating the complete elucidation of trait genetic control.
CONCLUDING REMARKS
One of the major challenges in systems biology, as far as modeling is concerned, is the construction of models capable of integrating processes across contrasting scales of time and space. The suite of mapping approaches that include functional mapping, systems mapping and network mapping offers the opportunity to meet this challenge given their complementation to provide a comprehensive coverage of the genotype–phenotype map. Functional mapping and systems mapping make it possible to detect QTLs and their epistatic interactions, which are responsible for phenotypic variation in trait formation and development. These two strategies provide a dynamic view of the genotype–phenotype connection, but do not reveal regulatory mechanisms behind this connection. By implementing network biology into systems mapping, network mapping promises to connect the phenotype to the interacting web of genetic regulatory networks at the transcriptional, translational and metabolic levels (Figure 2), likely making scientific breakthroughs in understanding biological signals. Network mapping provides an unprecedented resolution into fundamental biological questions about the interplay between genetic actions/interactions and the origin, properties and function of life defined as a dynamic system.
The uniqueness and novelty of network mapping rest on its ability to integrate genetics, genomics, proteomics and metabolomics by mathematical equations to model the genetic, biochemical and dynamic mechanisms of trait formation. The capacity of differential equations to handle complex systems makes them uniquely suitable for the identification of key structural features of the system, quantification of functional correlations of nodes and pathways and for providing fundamental insights into the mechanisms by which network structure determines network dynamics. Network mapping is flexible in incorporating various types of differential equations to map eQTLs, pQTLs and mQTLs and their genetic interactions on a time and space scale. Network mapping is equipped with a capacity to unleash the mystery of the black box that constructs the genotype–phenotype map.
Several issues, including analysis of rare variants and RNA-seq data generated by next-generation sequencing technologies, should be addressed, in order to make network mapping a broadly useful tool. Furthermore, although network mapping was introduced in the context of plant genetics, it can also have an implication for human genetics. Barabasi et al. [71] have discussed a new network-based medicine approach for studying human complex diseases. This approach can be integrated with our network mapping to better elucidate the genetic architecture and landscape of complex human diseases.
The application of network mapping relies critically upon differential equations and their mathematical, statistical and computational solutions. To capture and understand the structure, organization and function of any biological system, even a single cell, we need to build sophisticated differential equations that can reflect the emergent property and dimension of the system. Almost all such equations useful to biology and biomedicine are likely to be high-dimensional, nonlinear, stochastic and multifactorial. Just as deriving these biologically meaningful equations entails the participation of biologists, the solution of these equations requires in-depth technical helps from mathematicians, statisticians and computational scientists. Thus, to make network mapping a practical tool, synergic collaboration of various tools from multiple disciplines is crucial. Although many funding agencies have sensed the potential of integrating mathematics and biology, they yet have to realize the value of initiating a more comprehensive experiment completely based on well-justified statistical designs, such as network mapping. In a short run, biologists and mathematicians may work independently to deeply solve various questions and problems specific to their own areas. However, in a long run, because of its quantitative nature, network mapping that bridges mathematics and biology should be invested; after all, it provides a new vision for precision biology and precision medicine that cannot be achieved by any statistically unwarranted design.
A phenotype is genetically complex in terms of its underlying genetic architecture involving many genes that display a web of interactions with other genes and with environmental factors.
The formation of any phenotype undergoes a series of developmental events and biological alterations that lead to cell growth, differentiation and morphogenesis.
DNA sequences determine variation in a phenotype by perturbing transcripts, metabolites and proteins that construct transcriptional and regulatory networks.
A comprehensive picture of the genetic landscape of a phenotype can now be elucidated through dissecting it into its underlying genetic, developmental and regulatory components using robust mathematical models.
FUNDING
This work is partially supported by NSF/IOS-0923975, NIH/UL1RR0330184, the Changjiang Scholars Award and ‘Thousand-person Plan’ Award.
