


Abstract
Esophageal cancer (ESCA) has a bad prognosis. Long non-coding RNA (lncRNA) impacts on cell proliferation. However, the prognosis function of N6-methyladenosine (m6A)-associated lncRNAs (m6A-lncRNAs) in ESCA remains unknown. Univariate Cox analysis was applied to investigate prognosis related m6A-lncRNAs, based on which the samples were clustered. Wilcoxon rank and Chi-square tests were adopted to compare the clinical traits, survival, pathway activity and immune infiltration in different clusters where overall survival, clinical traits (N stage), tumor-invasive immune cells and pathway activity were found significantly different. Through least absolute shrinkage and selection operator and proportional hazard (Lasso-Cox) model, five m6A-lncRNAs were selected to construct the prognostic signature (m6A-lncSig) and risk score. To investigate the link between risk score and clinical traits or immunological microenvironments, Chi-square test and Spearman correlation analysis were utilized. Risk score was found connected with N stage, tumor stage, different clusters, macrophages M2, B cells naive and T cells CD4 memory resting. Risk score and tumor stage were found as independent prognostic variables. And the constructed nomogram model had high accuracy in predicting prognosis. The obtained m6A-lncSig could be taken as potential prognostic biomarker for ESCA patients. This study offers a theoretical foundation for clinical diagnosis and prognosis of ESCA.
Introduction
Esophageal cancer is one of the nine most prevalent cancers globally, with the sixth highest fatality rate [1, 2]. There are about half a million new cases of esophageal cancer (ESCA) each year [3]. Adenocarcinoma and esophageal squamous cell carcinoma are ESCA’s two most critical pathologic subtypes. The number of esophageal squamous cell carcinoma is higher than esophageal adenocarcinoma worldwide. According to statistics, most patients with ESCA are advanced once diagnosed, suggesting the poor prognosis of ESCA [4]. However, the existing research on ESCA is not perfect. Most researchers explored essential genes and their functions mainly based on experimental methods from the perspective of biology [5–7]. Nevertheless, the number of genes is usually in the thousands, and it takes an incredible amount of time and effort to test each of them or verify their functions. In addition, most researchers have only studied the effect of N6-methyladenosine (m6A) or long non-coding RNA (lncRNA) on ESCA, respectively. There are few studies focusing on the prognostic effect of the correlation of m6A and lncRNA on ESCA [8–10]. Therefore, it is necessary to build effective predictive models and discover novel prognostic biomarkers for ESCA through m6A-related lncRNAs.
For both mRNA and lncRNA, m6A is the most abundant internal alteration in eukaryotes. It affects gene expression by regulating RNA processing, nuclear egress, mRNA decay and translation. Thus, m6A controls fundamental cellular processes, and the dysregulated deposition of m6A is thought to play a role in human diseases [11–13]. Through controlling gene expression and splicing, m6A mediates immunotherapy and prolongs survival, resulting in changes in lactate levels in the tumor microenvironment [14, 15]. Studies have reported that more than 160 modifications of RNA molecules have been identified. M6A modification can play both carcinogenic and tumor suppressor roles in malignant tumors. LncRNA is a form of non-coding RNA (ncRNA) [16, 17]. It is a DNA transcription product longer than 200 nucleotides that is often not involved in protein-coding. Many studies in the last several years have shown the crucial roles of lncRNAs in cellular transcription and post-transcriptional control, development regulation, epigenetics, disease incidence and other processes [18–21]. Abnormal expression of lncRNA is related to the metastasis, growth and invasion of tumor cells, thus affecting the prognosis of the tumor. LncRNA also plays a vital role in ESCA. For example, lncRNA GAS5-AS1 reduces GAS5 m6A modification and improves the stability of tumor suppressor gene GAS5 by interacting with ALKBH5, thus inhibiting the tumorigenicity and metastasis of ESCA; lncRNA PEG10 is up-regulated in ESCA tissues, and its down-regulation promotes apoptosis of ESCA cells; lncRNA PVT1 can affect invasion of ESCA cells by inducing EMT [22–25].
The interaction between m6A and lncRNA was studied. It was found that m6A can not only regulate coding RNA, but also modify lncRNA, which is mainly concentrated in the 3 ‘non-coding region near the mRNA terminator. And m6A is involved in regulating the physiological functions of known lncRNAs [26]. M6A can regulate the structure of lncRNA via the binding site of the m6A reader, which may allow specific RNA binding proteins to enter m6A residues. Important regulatory functions for m6A-lncRNAs have been identified in both pathological and biological processes. At present, it has been confirmed that m6A-lncRNAs could be applied to project the prognosis of hepatocellular carcinoma [27], gastric cancer [28], lung adenocarcinoma [29] and other diseases. However, the regulatory mechanism of m6A-lncRNAs in ESCA has rarely been reported. Consequently, the objective of this research is to explore m6A-related lncRNAs and their potential role in ESCA prognosis. We identified 11 m6A-lncRNAs associated with ESCA prognosis by constructing the m6A and lncRNAs network combined with univariate Cox analysis and selected five m6A-lncRNAs for constructing m6A-lncSig using Lasso-Cox. The prognostic model constructed by m6A-lncSig predicted the survival rate of ESCA patients effectively.
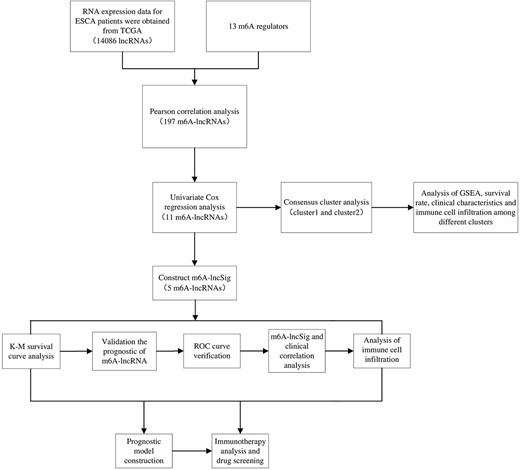
Diagrammatic representation of the research process.
Materials and methods
Data acquisition
The TCGA database was queried for information collection of the transcriptome, lncRNAs and clinical outcomes of ESCA (https://portal.gdc.cancer.gov/).We obtained 11 normal tissue samples, 160 ESCA tissue samples, 56 530 genes and 14 086 lncRNAs. The clinical traits included survival time, survival status, gender, tumor stage and TMN stage. Based on previously published literatures [30, 31], 13 genes (YTHDC1, YTHDC2, YTHDF1, YTHDF2, ALKBH5, FTO, METTL3, METTL14, HNRNPC, WTAP, RBM15, VIRMA and ZC3H13) had been reported to regulate m6A RNA methylation, most of them participated in some important biological processes in esophageal cancer or other cancers [32–35]. Therefore, the 13 genes were considered more representative in the study of esophageal cancer and were adopted as m6A regulators for further analysis.
Construction of co-expression network and extraction of prognostic m6A-lncRNAs
Potential m6A-lncRNAs were discriminated by comparing the expression levels of m6A regulators and lncRNAs in Pearson test (|Pearson R| > 0.4 and P < 0.001), and R software was applied to draw the correlation network diagram. Then, we combined the expression data of lncRNAs with survival information using limma package, extracted the prognostic m6A-lncRNAs through univariate Cox, and drew the heatmap to visualize the results. To reach statistical significance, the P-value needed to be <0.05.
Consensus cluster analysis
We performed K-means clustering of samples according to the expression of the prognostic m6A-lncRNAs using ConsensusClusterPlus and limma packages in R software. The survival package and survminer package were used to conduct survival difference analysis of different clusters. Limma was applied to compare differences of clinical traits and expression level of the target gene PD-L1 of ESCA in National Center for Biotechnology Information among different clusters. And the heatmap was compiled with the help of the Pheatmap package. Moreover, the limma package was applied to analyze immune cells infiltration in different clusters and visualize the results. Finally, we conducted gene ensemble enrichment analysis (GSEA) to identify the differences of related pathways between different clusters. Perl software was used to obtain expression data files and phenotype data files. The result with P < 0.05 was considered significant.
Construction of m6A-lncSig and survival analysis
We split the samples in half so that one half could be used for training and the other half for testing. Targeting the prognostic m6A-lncRNAs, m6A-lncSig was built using Lasso-Cox regression. The following equation calculated the risk score of m6A-lncSig:
where |${\mathrm{Coef}}_i$| was the regression coefficient and |${x}_i$| was the expression level of the m6A-lncRNA. To assess the validity of the risk score, we stratified the samples in both the training and test sets into high-risk and low-risk categories by the average value of the risk score. The survival differences between the categories were compared. The timeROC package in R was adopted to plot the receiver operating characteristic (ROC) curve and compute the area under the curve (AUC) value to assess the model’s accuracy. At the same time, survival analysis of the m6A-lncRNAs in the prognostic signature was performed by KM plotter (https://kmplot.com/analysis/) to validate the predictive ability of the m6A-lncSig, where P < 0.05 was considered statistically significant.
Correlation analysis of m6A-lncSig and clinical traits
The performance of the m6A-lncSig was further verified by examining the connection between the risk score and clinical traits through Chi-square test. ESCA patients were grouped according to different clinical traits including gender (156 males and 27 females), tumor Stage (96 stages I–II and 64 stages III–IV), T stage (75 T1–2 and 91 T3–4), N stage (76 N0 and 88 N1–3), M stage (134 M0 and 9 M1) and the result of K-means clustering (111 cluster 1 and 48 cluster 2) to estimate the difference of risk score between different groups, respectively. P < 0.05 was thought to be significant.
Association between m6A-lncSig and immune cell infiltration
To study the effect of m6A-lncSig on the tumor microenvironment of ESCA, the association between risk score of the m6A-lncSig and infiltration levels of 22 immune cells was investigated using Spearman’s correlation [36, 37]. The scatter plot was drawn to visualize the results. When P < 0.05, the result was thought to be significant.
Prognostic model construction based on m6A-lncSig
Training and test sets were used to conduct univariate and multivariate Cox regression analyses to check whether the m6A-lncSig risk score could be utilized as an independent predictive factor. P < 0.05 was considered significant. Then, a nomogram model was created to project the survival rate of ESCA patients with clinical traits and risk score as independent variables. And calibration curve was used to verify the accuracy of the nomogram.
Immunotherapy analysis and drug screening
We downloaded Tumor Immune Dysfunction and Exclusion (TIDE) data of ESCA from the website http://tide.dfci.harvard.edu/login/. The TIDE algorithm is a novel development that utilizes TIDE scores to accurately predict the effectiveness of immunotherapy drugs received by patients. To explore the possible application of m6A-lncSig in individualized ESCA therapy, we investigated the relationship between drug risk score and drug semi-inhibitory concentrations in ESCA therapy. To this end, we compared the sensitivity of 30 common anticancer drugs between the high-risk and low-risk groups. Wilcoxon test was used to assess inter-group differences. P < 0.05 was considered significant. Figure 1 was the diagrammatic representation of the research process.
Results
Construction of co-expression network and extraction of prognostic m6A-lncRNAs
We obtained 197 m6A-lncRNAs through correlation analysis, and their co-expression network was shown in Figure 2A. Univariate Cox regression result suggested that 11 m6A-lncRNAs including AC079684.2, UBR5-AS1, AC113143.1, ELF3-AS1, AL158196.1, Z94721.1, AL670729.2, LINC01977, AP003696.1, JPX and PPP1R26-AS1 were statistically linked to overall survival (OS) of ESCA (Figure 2B). Comparison of the expression between tumor and normal tissue (S Figure 1) showed that the 11 prognostic m6A-lncRNAs all highly expressed in tumor tissues (P < 0.05).
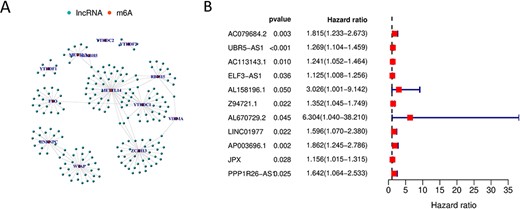
(A) Co-expression network diagram of m6A-lncRNAs. (B) Forest map of m6A-lncRNAs associated with prognosis.
Consensus cluster analysis
Using data on the expressions of the 11 m6A-lncRNAs, we were able to determine that the clustering result with the least overlap between two types corresponded to K = 2 (Figure 3A). Therefore, the samples were divided into cluster 1 (n = 111) and cluster 2 (n = 48). Correlation analysis between the two clusters and clinical traits showed that cluster 2 was closely related to N1–3 stage (P < 0.01) (Figure 3B). According to survival analysis, cluster 2 had a much lower OS than cluster 1 (Figure 3C) (P < 0.001), indicating that the prognosis of cluster 2 was relatively poor. The samples in cluster 1 had considerably greater expression of the target gene PD-L1 than in cluster 2 (P < 0.01, Figure 3D). Immune cell infiltration analysis suggested that the infiltration levels of T cells CD4 memory resting, T cells regulatory and B cells naive in cluster 2 were significantly higher than those in cluster 1 (Figure 3E).

(A) Consensus clustering matrix; (B) the clinical traits analysis; (C) survival differential analysis; (D) target gene analysis and (E) immune cell infiltration.
In addition, GSEA enrichment analysis results showed that (Figure 4), pathways FOCAL_ADHESION, REGULATION_OF_ACTIN_CYTOSKELETON, ECM_RECEPTOR_INTERACTION, ACUTE_MYELOID_LEUKEMIA, RENAL_CELL_CARCINOMA, BLADDER_CANCER and ARRHYTHMOGENIC_RIGHT_VENTRICULAR_CARDIOMYOPATHY_ARVC were significantly enriched in cluster 1. However, pathways RIBOFLAVIN_METABOLISM, PEROXISOME, MATURITY_ONSET_DIABETES_OF_THE_YOUNG and PANTOTHENATE_AND_COA_BIOSYNTHESIS were significantly enriched in cluster 2 (P < 0.05).

GSEA analysis result showed the difference of the related pathways between different clusters.
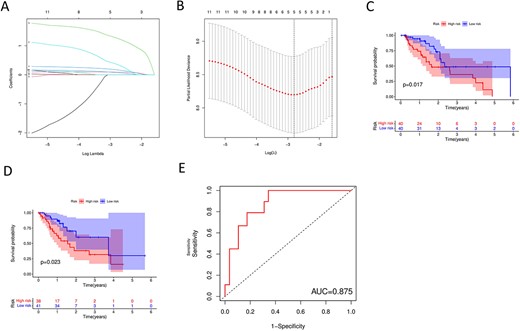
Construction of m6A-lncSig. (A–B) Lasso-Cox regression analysis. (C–D) Kaplan–Meier curves for the training group and the test group, respectively. (E) The ROC curve.
Construction of m6A-lncSig
Five of the 11 prognostic m6A-lncRNAs were finally obtained through Lasso-Cox analysis (Figure 5A and B), including UBR5-AS1, ELF3-AS1, AL158196.1, JPX and AP003696.1. Therefore, they were included in the construction of the prognostic m6A-lncSig and the corresponding risk score was computed. All the five lncRNAs highly expressed in the high-risk group (Figure 2A and B). Kaplan–Meier survival analysis (Figure 5C and D) showed significant differences in OS between the low-risk and high-risk groups in both the training and the test groups (P < 0.05). Meanwhile, the 5-year AUC value was 0.875 (Figure 5E), indicating the prognostic validity of the m6A-lncSig.
Further, survival analysis of the m6A-lncRNAs revealed that, except for AL158196.1 and AP003696.1, which were not found in the database, the lncRNAs in the prognostic signature had shown stable and reliable predictive ability (Figure 6).
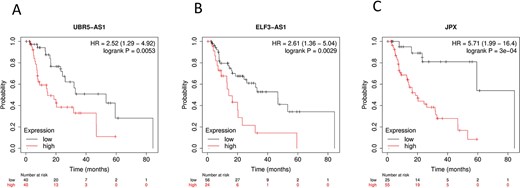
Prognostic validation of the m6A-lncSig by KM plotter. (A) UBR5-AS1. (B) ELF3-AS1. (C) JPX.
Correlation analysis of m6A-lncSig and clinical traits
Correlation study revealed that tumor stage, N stage and K-means clustering were all substantially connected with the m6A-lncSig risk score. The specific performance was: The risk score of N1–3 stage was substantially greater than that of N0 stage (P = 0.0066, Figure 7A). The risk score of tumor stages III–IV was considerably higher than that of tumor stages I–II (P = 0.021, Figure 7B). And the risk score of cluster 2 was much greater than that of cluster 1 (P < 0.001, Figure 7C).
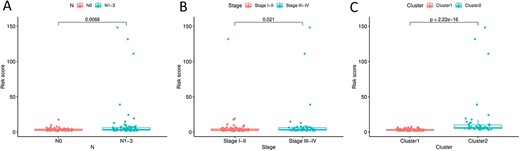
Correlation analysis between m6A-lncSig risk score and N stage (A), tumor stage (B) and different clusters (C).
Association between m6A-lncSig and immune cell infiltration
It was found that the m6A-lncSig risk score was strongly linked with B cells naive (R = 0.3, P < 0.05), T cells CD4 memory resting (R = 0.34, P < 0.05) and M2 macrophages (R = –0.27, P < 0.05) among 22 different kinds of immune cell infiltration (Figure 8).
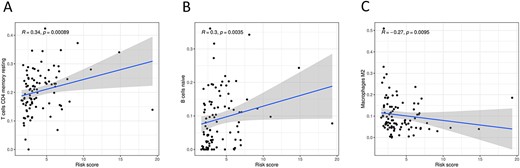
Association between risk score and three immune cells infiltration levels.
Prognostic model construction based on m6A-lncSig
Tumor stage (P < 0.001), M stage (P = 0.004), N stage (P = 0.044) and risk score (P = 0.003) were found substantially linked with OS in the training group using univariate Cox analysis (Figure 9A). Risk score (P = 0.004) and tumor stage (P = 0.005) were significantly correlated with OS, as shown in Figure 9B from the multivariate Cox analysis. Analysis result on the test group showed that risk score and tumor stage were significant independent prognostic elements for ESCA in univariate and multivariate Cox analyses (Figure 9C and D). Finally, a nomogram model was constructed to project patients’ 1-, 3- and 5-year survival rates (Figure 9E). The dependent variable of the nomogram model was the patients’ survival rate, and the independent variables were risk score, gender, tumor stage and TMN stage. It could be seen from the result of calibration curve that the nomogram could well predict the survival rate (Figure 9F).
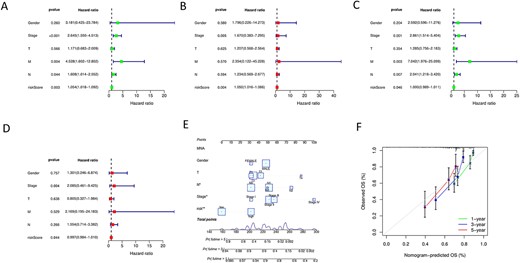
Univariate Cox analyses of the training group (A) and test group (C), and multivariate Cox analyses of the training group (B) and test group (D). (E) is the nomogram based on gender, tumor stage, TMN stage and risk score. (F) is the calibration curve.
Immunotherapy analysis and drug screening
It was found that TIDE scores in the high-risk group were lower than those in the low-risk group (Figure 10A), suggesting that patients in the high-risk group may be more sensitive to immune checkpoint blockade therapy. By drug sensitivity analysis, we found significant differences in the semi-inhibitory concentration values of the three anticancer drugs between the low-risk and high-risk groups: patients in the high-risk group were more sensitive to NSC-207895, AR-42 and Belinostat (Figure 10B–D). And risk score was negatively correlated with semi-inhibitory concentration of each drug in ESCA patients (Figure 10E–G).
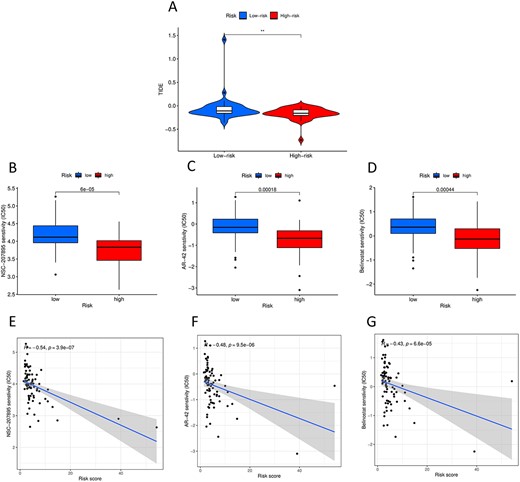
(A) TIDE analysis of the high-risk and low-risk groups. (B–D) Three candidate therapeutic drugs for patients with ESCA. (E–G) Relationship between risk score and semi-inhibitory concentration of each drug.
Discussion
Malignant tumors of the esophageal cancer are rather frequent in some countries and regions worldwide. Its high incidence and high mortality seriously endanger human health [38]. In China, ESCA has a high incidence and obvious familial clustering. Although there are many options for the treatment of ESCA, there may still be complications such as anastomotic leakage, simple empyema, pulmonary complications and anastomotic stenosis after treatment, which have serious adverse impacts on the prognosis of the patients [39]. Therefore, some researchers suggest that physical therapy or other methods should be advocated in order to improve the adverse outcomes of ESCA patients after surgery. However, we should establish personalized treatment plan according to the body composition of each patient [40]. With the further study of ESCA, the role of lncRNA has been gradually discovered, which is helpful for us to comprehensively understand the occurrence and development of ESCA [41, 42]. Meanwhile, many studies have confirmed that [31, 43, 44], m6A methylation may play a regulatory role in ESCA procession. Nevertheless, the roles of m6A-lncRNAs in ESCA progression remain unclear. Therefore, analysis on m6A-lncRNAs in the patients with ESCA is of great significance and provides a new perspective for the study of ESCA.
This study is to explore the prognostic significance of m6A-lncRNAs. 11 m6A-lncRNAs were confirmed to have prognostic value in ESCA. Clusters 1 and 2 were obtained by K-means clustering analysis based on the 11m6A-lncRNAs. It was found that Cluster2 had a worse prognosis than cluster 1 (P < 0.001). Next, we performed GSEA analysis across different clusters to identify potential major pathways. Among the substantially enriched pathways in cluster 1, we found that the ECM RECEPTOR INTERACTION signaling pathway might have a key impact on RA-induction; that is, interfering with RA receptor-binding genes in this term might reduce the efficiency with which RA induces SSCs development [45]. FOCAL_ADHESION participated in the biological processes including survival, proliferation, progression, adhesion, invasion, migration, angiogenesis and DNA damage repair through various signaling pathways in cancer cells [46]. FOCAL_ADHESION, BLADDER_CANCER, ACUTE_MYELOID_LEUKEMIA and RENAL_CELL_CARCINOMA induced the expression of PD-L1, which was the target gene of ESCA [47–51]. More and more studies have been conducted on the regulatory role of PD-L1 in ESCA. For example, recent studies have shown that the expression of PD-L1 promoted epithelial hyperplasia of ESCA, and PD-L1 had a certain correlation with the prognosis of ESCA [52–54]. We compared the expression of PD-L1 in different clusters and found that its expression in cluster 1 was significantly higher (P < 0.01). This indicated that PD-L1 was related to the signaling pathways of FOCAL_ADHESION, BLADDER_CANCER, ACUTE_MYELOID_LEUKEMIA and RENAL_CELL_CARCINOMA. In addition, it was discovered that different clusters were significantly correlated with N stage, indicating that N stage may be a major factor dominating the clusters.
In order to further exclude the correlation between variables and construct effective m6A-lncSig, we obtained five prognostic m6A-lncRNAs including UBR5-AS1, ELF3-AS1, AL158196.1, JPX and AP003696.1 by Lasso-Cox and then got the corresponding risk score. The high-risk group was found to have an obviously poorer clinical prognosis. Studies have shown that the expressions of ELF3-AS1 and JPX were significantly up-regulated in bladder cancer, hepatocellular carcinoma, oral squamous cell carcinoma and ovarian cancer, and their high expressions often indicated poor prognosis [24, 55–58]; as an added bonus, they could encourage ESCA cells to divide and spread [59]. Our experimental heatmap revealed that ELF3-AS1 and JPX highly expressed in ESCA tissues compared with normal tissues, which agreed with the existing conclusions.
In tumor microenvironment, immune cell infiltration may affect patients’ survival, metastasis and treatment resistance [60]. Previous studies have shown that T cells CD4 memory resting, B cells naive, activated mast cells, CD8+ T cells and infiltrating resting-stage dendritic cells were related to a worse prognosis in ESCA patients [61]. In this study, the risk score was strongly connected with B cells naive and T cells CD4 memory resting, indicating that risk score had a certain regulatory effect on tumor microenvironment in ESCA patients. These results indicated that the five m6A-lncRNAs used to construct m6A-lncSig in ESCA were associated with the infiltration levels of these immune cells, which corresponded with previous results. By itself, m6A-lncSig was shown to be an independent predictor of OS in a Cox regression analysis. In addition, we combined m6A-lncSig with gender, tumor stage and TMN stage to create a nomogram model, which obtained high accuracy in predicting the survival rate of ESCA patients. However, our results need more experiments to confirm the accuracy of the prediction system before it can be used to assist in the clinical treatment of ESCA patients.
Conclusions
We constructed the m6A-lncSig based predictive model in ESCA. As an independent variable, m6A-lncSig was highly correlated with the clinical traits of ESCA that could act as an independent prognostic index. High precision in prognosis projection was achieved by this model. All these results suggest that m6A-lncSig can be used as a new potential prognostic indicator to help researchers to establish individual treatment strategy for ESCA.
11 lncRNAs were identified associated with prognosis of ESCA, 5 of them constituted the m6A-lncSig, which could be the potential biomarkers.
The pathway differences between the two clusters were discovered by GSEA analysis.
A nomogram model was constructed using gender, tumor stage, TMN stage and risk score, which could accurately predict the prognosis of ESCA.
Acknowledgments
We are grateful to Dr. Zhipeng Gao and Dr. Ling Lin for their help in discussion and critical reading of the manuscript.
Funding
This work was supported by the National Natural Science Foundation of China (grant number 62271329).
Conflict of interest
The authors declare no conflict of interest.
Authors’ contribution
Conceptualization: T.H., Zp.G. and X.Z.; Data curation: T.H.; Writing—original draft: T.H.; Supervision: X.Z. and Q.Z. and Review and editing: T.H., Zp.G., X.Z., Q.Z. and L.L. All authors have read and agreed to the published version of the manuscript.
Data availability
The public datasets analyzed in this study can be found in the TCGA (https://portal.gdc.cancer.gov/) and Tumor Immune Dysfunction and Exclusion (TIDE) data of ESCA from the website http://tide.dfci.harvard.edu/login/.
Ting He is a postgraduate student at the School of Mathematics and Statistics, Southwest University of China. Her area of research includes applied mathematics and bioinformatics.
Zhipeng Gao is an attending physician of Beidahuang Industry Group General Hospital. He mainly engages in interventional vascular surgery, and serves as the member of tumor and vascular Professional Committee of Heilongjiang Geriatric Society, and the youth member of Hepatobiliary and Pancreatic Branch of Chinese Medical Association for Promoting Rehabilitation.
Ling Lin is a mathematical teacher at Yucai School Attached to Sichuan Chengdu No. 7 High School. She is interested in modelling.
Xu Zhang is an associate professor at School of Mathematics and Statistics, Southwest University, China, and her area of research includes computational biology and bioinformatics. She has published over 30 articles.
Quan Zou is a professor and doctoral supervisor of the Institute of Fundamental and Frontier Sciences of University of Electronic Science and Technology of China, the winner of the National Natural Science Foundation for Outstanding Youth Foundation, Senior Member of IEEE, Senior Member of ACM, Outstanding Member of CCF, and is selected as ESI Global ‘Highly Cited Scholar.’
References
Author notes
Ting He, Zhipeng Gao contributed equally to this work.
