


Abstract
Botulinum toxin is administered to paralyze the gastrocnemius muscle and reduce its size, thereby improving the calf contour and reducing the leg circumference of the calf.
In pursuit of better efficacy, we designed a new injection protocol that targeted both the gastrocnemius and soleus. An algorithm of botulinum toxin injection for calf contouring was proposed based on the results of the study and ultrasonographic data.
A prospective, self-controlled, double-blind study was conducted. The gastronemius muscle (GM) group (n = 17) included the patients whose gastrocnemius muscles were treated, and the GM + soleus muscle (SM) group (n = 17) included the patients who had both the gastrocnemius and soleus treated. Parameters including the maximum leg circumference and the subcutaneous fat, gastrocnemius muscle, and soleus muscle thicknesses were collected before and after injection.
Both GM and GM + SM injection helped improve calf contour. Although the thickness of the gastrocnemius muscle was reduced, reducing the leg circumference, the subcutaneous fat and soleus muscle had compensatory thickening after injection, especially over the long term, which may affect the efficacy. Compared with the GM group, the GM + SM group effectively reduced the tendency of the soleus muscle to thicken. Calf muscle thickness could be roughly estimated by constructing a fitting equation and measuring height, weight, and leg circumference.
Two injection methods achieved the effect of improving calf contour and reducing the leg circumference with equivalent patient satisfaction. The GM + SM injection group did not show any obvious extra clinical benefit when compared with the GM injection group.

Long, toned, or slightly muscular female legs are generally perceived to be attractive, which is the reason some patients with obese calves seek intervention, such as liposuction, tibial nerve gastrocnemius branch transection, or partial resection of gastrocnemius muscle.1-5 However, these procedures are limited by the complexity of the procedures, a high incidence of complications, a high recurrence rate, and the long hospital stay and high costs.6-8
Botulinum toxin type A (BTX-A) injection is considered a safe and reliable method for improving calf contour.9 Various approaches to paralyzing the gastrocnemius have been reported, which detail the injection site, injection dose, and efficacy.10-12 Judy Cheng’s review included some studies that refer to gastrocnemius injection with a different type of toxin.9 The efficacy of injection 3 months after was summarized by Wanithphakdeedecha, who reported a decrease in leg circumference of 1.53 cm, while Suh reported a decrease in leg circumference of 0.6 to 1.4 cm. Muscle volume will recover to 50% of its original volume after 6 months, and fully recover to its original volume after 12 months.9 Muscle paralysis is reversible, and its effect may only be maintained for 6 to 12 months. To prolong the effect, our team was inspired by the treatment of lower limb spasm with botulinum toxin, for which simultaneous paralysis of the gastrocnemius and soleus muscles was allowed; we applied a refined injection scheme seeking possible better circumference reduction.13 A recommended injection algorithm was proposed by comparing the efficacy of the 2 injection methods combined with anatomic ultrasound analysis of the calf before injection.
METHODS
Patient Selection
This was a prospective, self-controlled study. Thirty-four patients who received BTX-A injection for their lower legs were enrolled. Criteria for exclusion included surgery on the lower leg within 1 year, botulinum toxin injection into the lower leg within 1 year, known allergy to botulinum toxin, infection or inflammation in the injection area, musculoskeletal conditions, systemic conditions that might affect calf morphology, pregnancy, and lactation. Athletes or those who had to exercise for more than an hour a day after treatment were also excluded. The study took place from January 2021 to December 2022. This study was performed in line with the principles of the Declaration of Helsinki. Before participation, all participants provided written informed consent and fully understood the associated risks and possible consequences. All of them were informed that other ways of losing weight were disallowed. All treatments and follow-ups were conducted at Peking Union Medical College Hospital. The institutional review board approved this study (ethical approval no. S-K1688; trial no. ChiCTR2100051288). A single physician (N.Y.) was assigned to collect the participants’ preclinical history and conduct the required examination for consistency throughout the entire experiment.
Preintervention Measurements
Before injection, basic information about the patients was recorded, including age, BMI, daily exercise amount, and similar treatment history. Standardized measurements were performed of all patients as follows:
With a soft vernier caliper: patients were asked to stand with feet flat on the floor with both legs together and to stand on tiptoes to the greatest extent for the measurements of maximum leg circumference (MC, ttMC).
With ultrasound: patients were instructed to stay in an upright position. Measurement sites were set as shown in Figure 1.14 The subcutaneous fat, gastrocnemius, and soleus muscle thicknesses (SF, GM, SM) at each site were measured with patient in a prone position with a real-time ultrasound scanner (E-CUBE 7; ALPINION, Seoul, Korea) and L3-12 detector.
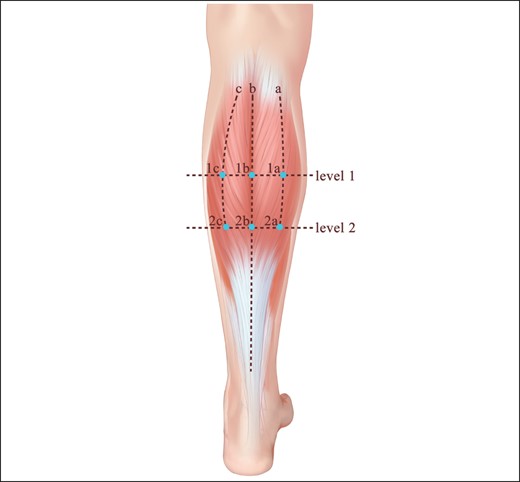
Illustration of the ultrasonographic detection of calves’ thickness. An ultrasound probe was placed at these 6 sites. Subcutaneous fat, gastrocnemius, and soleus muscle thicknesses were recorded at each site. The midline of the calf was defined as Line b. Line a was defined as the halfway point between the distance from the medial border of the gastrocnemius to Line b. Line c was defined as the halfway point between the distance from the lateral border of gastrocnemius to Line b. Levels 1 and 2 represented the one-quarter and one-half heights of the calf. Reproduced with permission from Chong et al.14
To minimize human errors, all measurements were performed by 1 physician (Z.L.), and repeated 3 times. The average data were adopted. A photograph of the lower leg was taken with feet flat on the floor in the upright position, and another was taken with the patient in the tiptoe position.
Injection Procedure
LanbotulinumtoxinA (Hengli; Lanzhou Institute of Biological Products Co., Ltd., China) was reconstituted in 1 mL of 0.9% sodium chloride solution to achieve a concentration of 20 U/1 mL in the botulinum toxin A vials. According to the recommendation of China Food and Drug Administration, indications for the product were eyelid spasm, hemifacial spasm, and strabismus, of which patients had been informed. The recommended dosage was <500U per time in total. Two methods of injection were performed with a 27G needle. For the GM group, 15 injection sites with an interval of 2 cm and 10U per site were performed. For the GM + SM group, injection sites were mapped as for the GM group. When the needle was inserted into the GM, 6 units were injected, and then the needle was inserted deeper, to the SM level, and another 4 units were injected (Figure 2, Video). Because we recorded the measurements of muscle thickness by ultrasound before injection, this muscle thickness data determined needle insertion levels for the injection. The morphology of subcutaneous tissue, gastrocnemius muscle, and soleus muscle at the 6 sites is demonstrated in Supplemental Figure 1, available at www.aestheticsurgeryjournal.com.
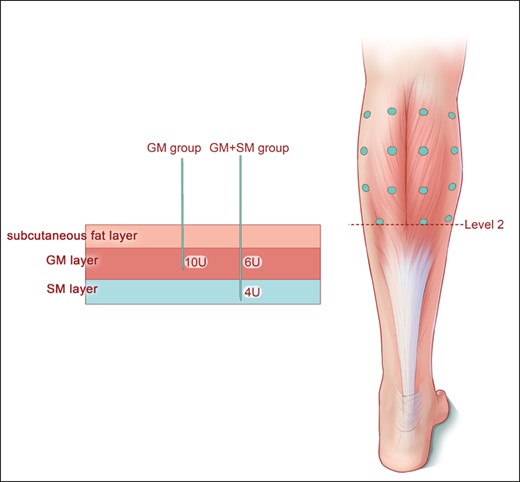
Illustration of injection method. A total of 15 injection sites were arranged. Injection sites were evenly distributed on both sides of the calf midline. Eight injection sites were distributed on the medial head, and 7 injection sites were distributed on the lateral head. Each injection site was spaced 2 cm apart. For the GM group, 10U was injected at each site. For the GM + SM group, 6U was first injected into the GM layer, and then 4U was injected into the SM layer. GM, gastrocnemius muscle; SM, soleus muscle.
Follow-up
Follow-up visits were scheduled at the end of the first, third, and sixth months, with review of all parameters collected before injection. At the first visit, a real-name electronic questionnaire (Appendix, available at www.aestheticsurgeryjournal.com) was administered to record complication information. If patients had complications, we paid close attention to the development of their symptoms. At the last visit, another electronic questionnaire was conducted that included a patient satisfaction scale ranging from 0 (complete dissatisfaction) to 10 (complete satisfaction).
Statistics
Statistical analysis was performed with SPSS software version 21.0 (IBM Corp., Armonk, NY). A comparison of MC, ttMC, SF, GM, and SM measurements before and after GM injection or GM + SM injection was performed with a pairwise t test. The correlation between the thickness of each layer of the calf and baseline clinical characteristics was analyzed with the linear regression model. Multivariate analysis of these parameters was performed with the autoregression (AR) model. The results were considered statistically significant when the P value was less than .05. They were expressed as means with a 95% confidence interval.
RESULTS
Baseline Information
Of the 34 healthy female patients (age range: 20 to 36; mean age: 29.5; no male patients), the GM injection plan was carried out on 17, with the GM + SM injection regimen for the rest. For more data relating to MC, ttMC, and the muscular thickness of the SF, GM, and SM, refer to Table 1. All patients received follow-up at 1, 3, and 6 months after injection. Patients received follow-up within the range of 5 days of each follow-up point.
Demographic and Baseline Information
| Parameter | Group GM (n = 17) | Group GM + SM (n = 17) | P value |
|---|---|---|---|
| Age (year) | 25.88 ± 3.58 (22,35) | 27.24 ± 3.86 (23,37) | .275 |
| BMI | 20.32 ± 1.59 (18.7,24.2) | 20.41 ± 1.78 (16.2,22.5) | .978 |
| MC (cm) | 37.21 ± 2.13 (35.25,42.10) | 38.39 ± 2.31 (33.75,41.75) | .162 |
| ttMC (cm) | 37.28 ± 2.30 (35.50,42.25) | 38.97 ± 2.44 (33.75,42.55) | .059 |
| Muscular thickness (cm) | |||
| SF | 0.56 ± 0.13 (0.36,0.84) | 0.60 ± 0.14 (0.36,1.01) | .448 |
| GM | 1.28 ± 0.23 (0.72,1.71) | 1.31 ± 0.29 (0.59,1.71) | .809 |
| SM | 1.51 ± 0.25 (1.03,2.00) | 1.54 ± 0.24(0.87,1.82) | .789 |
The data are shown as mean and standard deviation. BMI, body mass index; GM, gastrocnemius muscle; MC, maximal circumference of the calf; SF, subcutaneous fat; SM, soleus muscle; ttMC, maximal circumference of the calf in the tiptoe position.
Treatment Effects
Maximal Circumference of the Calf
As shown in Figure 3, the MC and ttMC in the 2 groups declined significantly following injection (all P < .001), indicating that the 2 injection methods effectively reduced maximal circumference. Six months after injection, the MC had decreased from 38.38 cm to 36.92 cm in the GM + SM group, slightly greater than the 1.26 cm of the GM group, although the difference between the 2 groups was not statistically significant (P = .355; Figure 3).
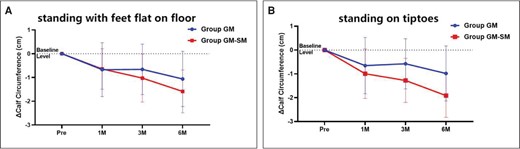
Calf circumference changed after injection of botulinum toxin. Individual points represent the means, and error bars represent the standard deviations. (A) Standing with feet flat on floor; (B) standing on tiptoes. GM, gastrocnemius muscle; M, month; Pre, preinjection; SM, soleus muscle.
Subcutaneous Fat Thickness
The overall thickness of the subcutaneous fat showed a slight increase (GM group, from 0.61 ± 0.15 to 0.75 ± 0.19; GM + SM group, from 0.56 ± 0.11 to 0.71 ± 0.13). The differences in the increases at the end of the third and sixth months (P < .001) were of statistical significance but without significance at the end of the first month (P = .06). There was no difference between the GM and GM + SM groups (P = .08; Figure 4).
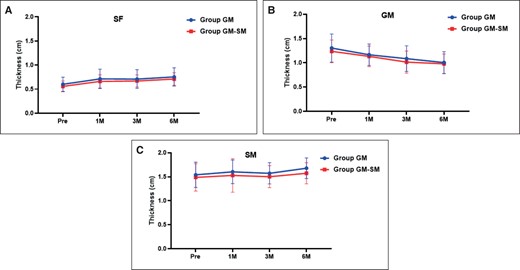
Changes in thickness of (A) subcutaneous fat (SF); (B) gastrocnemius muscle (GM); and (C) soleus muscle (SM), after injection of botulinum toxin. Individual points represent the means, and error bars represent the standard deviations. For the GM group, GM thickness decreased from 1.31 ± 0.30 cm to 1.02 ± 0.22 cm. For the GM + SM group, GM thickness decreased from 1.23 ± 0.23 cm to 0.97 ± 0.20 cm. It should be noted that there was no significant statistical difference in the degree of decrease in GM thickness between the GM group and the GM + SM group (P = .07).
Gastrocnemius Muscle Thickness
For both the GM and the GM + SM groups, the thicknesses of the gastrocnemius at the end of the first, third, and sixth months were significantly lower than before injection (all P<.001; Figure 4).
Soleus Muscle Thickness
For the GM group, SM thickness showed a trend of compensated thickening from the fourth month to the sixth, although this change was not statistically significant. For the GM + SM group, SM thickness, which should have decreased, showed the same thickness as before injection (Figure 4).
Partial Thickness
There were statistical differences in SF thickness between the GM group and the GM + SM group at Point 1a, and in GM thickness and SM thickness at Point 1c as well. At 1a, the thickening of SF was more significant in the GM group than in the GM + SM group (P = .02). At 1c, the GM in the GM + SM group decreased more than it did in the GM group (P = .02). At 1c, the compensatory thickening of the SM was greater in the GM group than in the GM + SM group (P = .01; Figure 5).
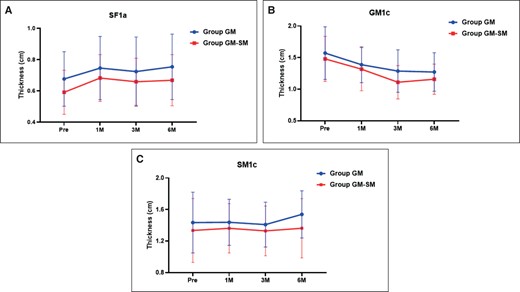
Changes in thickness of (A) subcutaneous fat (SF) at 1a point; (B) gastrocnemius muscle (GM) at 1c point; and (C) soleus muscle (SM) at 1c point after injection of botulinum toxin. Individual points represent the means, and error bars represent the standard deviations.
Overall Satisfaction
The mean satisfaction score was 7 ± 1 (range 5-9) after the GM + SM group combined injection and 6.8 ± 1 (range 5-8) after GM alone injection. No significant difference was found between the 2 groups (P = .41). In addition, we found that among those who perceived a decrease in calf circumference, the mean calf circumference was decreased by 1.07 cm, the mean MC after injection was 36.25 cm, and the mean satisfaction was 7.8 ± 1.
Complications
No major complications were observed in any patients. Eight patients complained of aching pain and weakness in the functional position (eg, standing, walking), and 12 patients complained of calf soreness in the resting position. These feelings were within tolerable range and disappeared within 1 month after injection. One patient reported an incidental calf spasm that resolved within 1 month after the injection. No patients reported bruising, edema, or bleeding.
Multifactor Analysis of Muscle Thickness and Maximal Leg Circumference
An AR (1) model that applied generalized estimating equations (GEE) and varied with time was constructed for an in-depth analysis of the independent effects of each contributing factor. Compared with injecting GM alone, injecting GM + SM could reduce the SM thickness by 0.1 cm and ttMC by 0.4 cm. GM, MC, and ttMC decreased significantly at all 3 follow-up time points after injection (Table 2).
Multivariate Analysis of Muscular Thickness and Calf Circumference After Injection of Botulinum Toxin
| Parameter | SF | GM | SM | ΔMC | ΔttMC | |||||
|---|---|---|---|---|---|---|---|---|---|---|
| β | P value | β | P value | β | P value | β | P value | β | P value | |
| Age | −.01 | .234 | .01 | 288 | −.01 | .890 | −.03 | .296 | −.01 | .719 |
| BMI | .01 | .756 | .04 | .001** | .02 | .253 | −.04 | .335 | 1.15 | <.001*** |
| Group | ||||||||||
| GM | 0 | 0 | 0 | 0 | 0 | |||||
| GM-SM | −.14 | .136 | −.05 | .232 | −.1 | .019* | −.15 | .355 | −.40 | .013* |
| Follow-up time point | ||||||||||
| Pre | 0 | 0 | 0 | 0 | 0 | |||||
| 1M | .23 | <.001*** | −.11 | <.001*** | .05 | .239 | −.65 | <.001*** | −.81 | <.001*** |
| 3M | .10 | <.001*** | −.23 | <.001*** | .01 | .967 | −.83 | <.001*** | −.90 | <.001*** |
| 6M | .13 | .058 | −.30 | <.001*** | .07 | .170 | −1.30 | <.001*** | −1.40 | <.001*** |
A multivariate analysis with generalized estimating equations was employed.*P < .05, **P < .01, ***P < .001. BMI, body mass index; GM, gastrocnemius muscle; M, month; ΔMC, changes in maximal circumference of the calf; Pre, preinjection; SF, subcutaneous fat; SM, soleus muscle; ΔttMC, changes in maximal circumference of the calf in the tiptoe position.
Case Report
A 30-year-old female patient received our treatment (GM injection), and after 6 months her leg demonstrated a reduction in circumference and an improvement of calf contour (Supplemental Figure 2A and C). On tiptoe, the muscle bulges became smaller (Supplemental Figure 2B and D). The cases of GM + SM injection can be seen in Supplemental Figures 3, 4. All supplemental figures are available at www.aestheticsurgeryjournal.com.
DISCUSSION
The Dilemma of Botulinum Toxin Injection for Improved Calf Contour
For calf contouring, conventional approaches have been associated with significant morbidity.15 Liposuction has limited efficacy because the main determinant of calf thickness is the size of the GM, rather than the subcutaneous fat.16 BTX-A injections are widely administered to improve calf contours.17-19
Based on the data we collected preoperatively with ultrasound, in general GM thickness was not always dominant (Figure 6). Except for Point 1b and Point 2a, in which the GM accounted for the largest proportion, the thickness of the GM was even less than that of the SF. The role GM thickness plays in the overall MC may not be as significant as previously thought. This is why, although a number of researchers have carefully designed injection sites to make injections as evenly distributed as possible in the GM, treatment effects have remained not quite optimistic. The role SM thickness plays in the overall MC should not be overlooked.
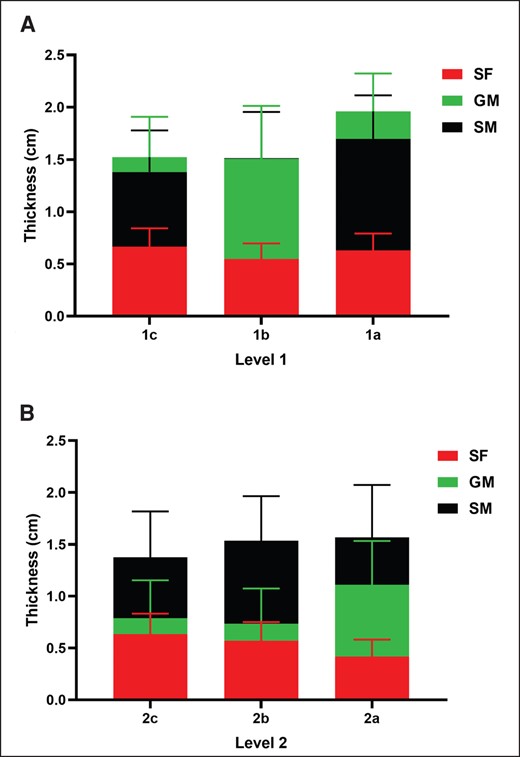
Distribution of subcutaneous fat (SF), gastrocnemius muscle (GM), and soleus muscle (SM) at different levels and points. Thickness proportions of SF, GM, SM at (A) Level 1 (in Figure 1: 1c, 1b, 1a); and (B) Level 2 (in Figure 1: 2c, 2b, 2a).
Gastrocnemius Muscle (GM) vs GM + Soleus Muscle (SM) Efficacy Comparison
There have been no cases reported of the soleus muscle as a site of injection in a healthy population. This is the first study that administered combined injection of the GM and SM to improve calf contour.
Circumference Analysis
Despite the subtle additional changes of the MC on tiptoes produced by GM + SM injection procedures compared to GM injection alone, it is worth noting that both of them achieved the same level of patient satisfaction (Figure 3).
Thickness Analysis
Injection of the SM eliminates the possibility of SM compensatory thickening resulting from the GM injection, and the GM + SM injection can achieve an SM that will not be larger after GM injection (Figure 4). In view of the difference in GM decline at Point 1c, the GM + SM group may have potential at the Point 1c muscle contour, that is, the upper and lateral crus (Figure 5).
Overall Satisfaction
The GM + SM injection did not achieve an extra clinical benefit when compared to GM injection alone.
Gastrocnemius Hypertrophy Experience and Recommendations
Targeted Dosage
Take the BMI into consideration. For each unit of increase in BMI, a decrease (by 0.04 cm) in GM thickness resulted in an average increase (by 1.15 cm) in the ttMC (Table 2).
GM layer dosage. The dose injected into the GM in the GM group was 2 times that in the GM + SM group. Regardless of the greater dose in the GM group, the effects were similar, probably suggesting that such a large dose was not required for the GM (Figure 4).
SM layer dosage. Injection into the SM did not result in a reduction in SM thickness, suggesting that we may have injected an insufficient amount in the SM. More studies are required to determine the appropriate dosage, which reduces the SM safely and effectively (Figure 4).
Site Distribution
Keep the interval distance between injection sites at 2 cm. Around 15 sites are suggested, allowing the BTX to diffuse the whole GM.
Level 2 is a good level for injection of the SM, but not for injection of the GM. The GM became significantly thinner at Level 2, and the needle inserted here could easily penetrate the soleus muscle, especially in the lateral calf.
Set sites in the midline to better paralyze the GM. At Level 1, the thickness of GM is the largest along the center line (the reason for the absence of SM data here is that the GM thickness is so large that an explicit lower boundary of the SM is difficult to monitor). This is not entirely consistent with our previous knowledge. The GM has long been considered a muscle with 2 abdominals that merged near the midline, where it was the thinnest. However, our data show that at Level 1 the thickness of the GM is the largest in the middle, followed by the thickness at the medial and lateral sites, suggesting that there may be different types of GM morphology (Figure 6A).
Targeted Depth
Average thickness. According to preoperative ultrasound data, the average distance from the skin to the middle of the GM was 1.63 cm, suggesting that when a needle is inserted 1.63 cm the accuracy of needle insertion into the GM will improve. Therefore, complete insertion of a 13-mm needle is safe for GM injection. However, a 25-mm needle is not enough for SM injection (Figure 7).
Correlation between BMI, leg circumference, and muscle thickness. The regression analysis is shown in Supplemental Figure 5 (available at www.aestheticsurgeryjournal.com). The R of the SF, GM, and SM is 0.51, 0.41, and 0.48 respectively. Table 3 shows how the equation between BMI and the SF, GM, and SM is constructed. The formulas of MC(X) are: Y = 0.06*X−0.52; Y = 0.06*X −1.04; and Y = 0.06*X−0.91. The adjusted R2 and P show a good fit.
Ultrasonic Device
Injection depth. The injection depth can be detected in real time.
Site distribution. According to the preoperative study, we found 4 different forms of GM under ultrasound (Figure 8). Type I is characterized by 2 prominent muscle bulges. Type II has a single bulge in the middle. Type III has a single bulge in the medial head. Type IV has a single bulge in the lateral head. These 4 different forms of GM are not significantly different to the naked eye. It is therefore difficult to distinguish them without ultrasound equipment. With the help of ultrasound, after the different types of GM are identified, the distribution of injection sites can be determined according to the characteristics of the GM.14 Table 4 summarizes the injection protocol, formulated with and without an ultrasound device.
Measurement of Improvement and Injection Strategy
For monitoring improvement, Bogari utilized MRI and Oh 3-dimensional computed tomography, both expensive imaging instruments.10,12 Although the ultrasonic instrument cannot display the muscle volume, it is cheap, portable, and has a low learning curve; Wanitphakdeedecha employed ultrasound in the research.11 For units injected in each leg, 72U and 96U(BTX-A), 100U and 200U(PRA), and 100U(ONA) have been reported in the previous studies.10-12,18 In our study, 150U was injected in each leg, and no serious complications were observed. Regarding injection technique, Wanitphakdeedecha injected 6 points to the medial belly and 4 points to the lateral belly.11 Suh injected 6 to12 points in total in the most prominent parts of medial and lateral bellies.18 Bogari injected 48 points over the whole calf to get a good effect of calf volume reduction.10 However, for Asian females, whose calves are usually short, 48 points must be set on the lateral and lower sides of the calf, where the GM is usually very thin. It is easy to insert the needle into the SM layer despite the help of ultrasound device. To avoid the possibility of inserting into the SM layer in the GM group, and to make patients more comfortable, we utilized 15 points and decided to sacrifice the potential improved effect of adding sites.
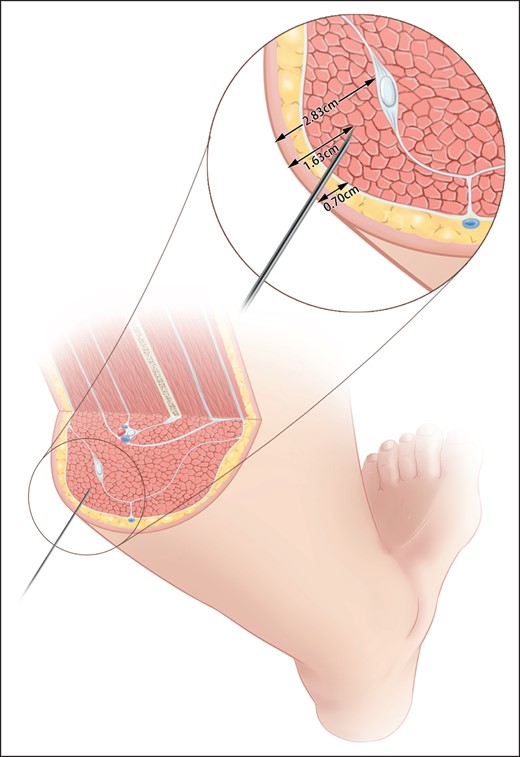
Recommended injection depth of gastrocnemius based on preinjection ultrasound data.
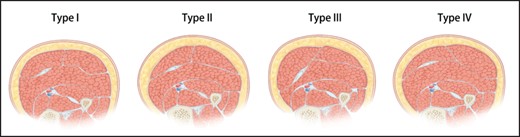
Schematic diagram of the 4 types of gastrocnemius muscle in cross-sectional views. Type I, the double bulge type, characterized by 2 muscle prominent bulges. Type II, the mono bulge, intermediate dominant type, characterized by a single bulge in the middle. Type III, the mono bulge, medial dominant type, characterized by a single bulge in the medial head. Type IV, the mono bulge, lateral dominant type, characterized by a single bulge in the lateral head. Reproduced with permission from Chong et al.14
Correlation Analysis and Linear Regression Between Baseline Clinical Characteristics and Muscular Thickness of the Calf
| Parameter | SF | GM | SM | |
|---|---|---|---|---|
| BMI | R | 0.51 | 0.41 | 0.48 |
| P value | .002 | .017 | .004 | |
| Linear regression | ||||
| Slope | 0.04 (0.02,0.06) | 0.06 (0.02,0.11) | 0.07 (0.02,0.11) | |
| Intercept | −0.20 (−0.68,0.27) | 0.01 (−1.00,1.02) | 0.12 (−0.80,1.03) | |
| R2 | 0.26 | 0.17 | 0.23 | |
| Equation | Y = 0.04*X − 0.2 | Y = 0.06*X + 0.01 | Y = 0.07*X + 0.12 | |
| MC | R | 0.54 | 0.56 | 0.6 |
| P value | .001 | <.001 | <.001 | |
| Linear regression | ||||
| Slope | 0.03 (0.01,0.05) | 0.06 (0.03, 0.09) | 0.06 (0.03,0.096) | |
| Intercept | −0.52 (−1.11,0.07) | −1.04 (−2.21,0.12) | 0.91 (−2.02,0.21) | |
| R2 | 0.29 | 0.32 | 0.36 | |
| Equation | Y = 0.06*X − 0.52 | Y = 0.06*X − 1.04 | Y = 0.06*X − 0.91 | |
BMI, body mass index; GM, gastrocnemius muscle; MC, maximal circumference of the calf; SF, subcutaneous fat; SM = soleus muscle.
Our Experience of Botulinum Toxin Treatment for Calf Contouring
| Items | Recommended practice |
|---|---|
| Without ultrasound device | |
| Targeted muscle | A combined injection of the gastrocnemius and soleus |
| Targeted dosage | BMI: This suggests that in obese patients, the dose of botulinum toxin should be raised at the discretion of injectors |
| GM dosage: 150U is effective at reducing GM thickness and will not cause SM hypertrophy | |
| SM dosage: 60U is not enough to change the thickness of SM | |
| Site distribution | Suggestion 1: Keep the interval distance of 2 cm between injection sites |
| Suggestion 2: Level 2 is a good level for injection of SM, but not for injection of GM | |
| Suggestion 3: Set sites in the midline for better paralyzed GM | |
| Targeted depth | |
| Average thickness | The targeted depth can be 1.63 cm to better guarantee needle insertion into the GM |
| Equation between BMI(Y) and SF,GM,SM | Y = 0.04*SF − 0.2; Y = 0.06*GM + 0.01; Y = 0.07*SM + 0.12 |
| equation between MC(Y) and SF,GM,SM | Y = 0.06*SF − 0.52; Y = 0.06*GM − 1.04; Y = 0.06*SM − 0.91 |
| With ultrasound device | |
| Suggestion: Conduct the injection under the guidance of ultrasound | |
| Type I (Double bulge) | The injection sites are symmetrically distributed on both sides of the midline |
| Type II (Mono bulge, intermediate dominant) | Set more sites and increase dosage in the midline |
| Type III (Mono bulge, medial dominant) | Set more sites and increase dosage in medial bulge |
| Type IV (Mono bulge, lateral dominant) | Set more sites and increase dosage in lateral bulge |
BMI, body mass index; GM, gastrocnemius muscle; MC, maximum circumference of the calf; SF, subcutaneous fat; SM, soleus muscle.
Limitations
A limitation of our study was that a larger sample size was required. Additionally, the injection interval of stable calf circumference and the GM and SM injection doses need to be further explored. An RCT study will be designed as the next step. Longer follow-up will be adopted in the next RCT. In addition, the morphological classification of the lower leg does not correspond well to the ultrasonic anatomical classification because subcutaneous fat can mask the outline of the GM. This further influences the potential role of ultrasound in botulinum toxin injection. Some patients also reported a strong sense of pain at the 15 points during injections. Future relevant research should be performed in which the GM and SM are injected at the same time at different injection sites. Next, although this study mentioned different types of gastrocnemius muscle morphology, the relationship between the morphology and the injection effect is unknown. This needs further exploration. Finally, more research is required to prove the feasibility, necessity, safety, and effectiveness of combined muscle injection.
CONCLUSIONS
Both GM and GM + SM injection can improve calf contouring. The GM + SM injection is more effective at suppressing SM compensation. The main strength of our study was the comparison of 2 different techniques for the GM + SM combined injection in patients with similar demographic and clinical data, establishing the feasibility of SM injection and filling this research gap. Despite the additional contouring improvement in tiptoe stand resulting from the GM + SM injection, it resulted in the same patient satisfaction as the GM injection alone. We recommend a more cautious implementation of SM injection in the future.
Supplemental Material
This article contains supplemental material located online at www.aestheticsurgeryjournal.com.
Acknowledgments
Dr Li and Dr Chong contributed equally to the manuscript as co-first authors.
Disclosures
The authors declared no potential conflicts of interest with respect to the research, authorship, and publication of this article.
Funding
The work was supported by the National High Level Hospital Clinical Research funding grant numbers 2022-PUMCH-B-041, 2022-PUMCH-A-025, and 2022-PUMCH-A-210.
REFERENCES
Author notes
From the Department of Plastic Surgery, Peking Union Medical College Hospital, Chinese Academy of Medical Sciences and Peking Union Medical College, Beijing, China.

