


Abstract
Debate surrounding the morphological evolution of the submandibular gland (SMG) with aging, and the uncertain influence of patient demographics, has led to hesitancy about incorporating targeted interventions of the SMG into clinical practice.
The aim of this study was to determine whether SMG ptosis, hypertrophy, or both is the primary etiology behind the increase in submandibular volume with age.
MRI segmentation was used to calculate the total and inframandibular (IM) volume and height of the SMG. Adult subjects with previous MRIs of the head and neck were used for analysis. Those with pathology or artifact compromising the SMG were excluded. Subjects were divided into 4 age-defined cohorts, for clinical applicability.
The study included 129 patients (65 females; 64 males) with a mean age of 52.3 years (range, 20-85 years). No significant change in total SMG volume was observed between the reference group and all cohorts. The IM-SMG volume of the reference cohort was 5.77 cm3. All 3 cohorts had a greater IM-SMG volume than the reference group. The 45- to 54-year cohort had a mean volume of 6.7 cm3 (P = 0.4), the 55- to 64-year cohort, 7.5 cm3 (P = 0.01), and the ≥65-year cohort, 7.2 cm3 (P = 0.01). Male sex and overweight or obese BMI were associated with significantly larger total and IM-SMG volumes.
The novel finding of a significantly larger IM-SMG volume with no change in total volume provides evidence for SMG ptosis rather than hypertrophy as a significant contributor to age-related submandibular fullness. The lack of any significant difference in total volume or height with aging emphasizes the role of glandular descent.
See the Commentary on this article .
Facial aesthetic surgery has evolved tremendously since what is considered to be the first facelift, performed approximately 120 years ago.1 Since then, facial and neck rejuvenation procedures have emerged from their initial, secretive, skin-centric roots to becoming the most common aesthetic procedures among adults 55 years and older, and attention has turned to deeper structures.2 However, the original criteria associated with a visually youthful neck, including a distinct mandibular border and characteristic cervicomental angle between 105° and 120° are as relevant today as when Ellenbogen and Karlin first described them.3,4 Although the etiology of submandibular fullness and a blunted cervicomental angle is multifactorial,5-10 the submandibular gland (SMG) has been implicated as a major contributor to aging. Nonetheless, a comprehensive understanding of the age-related changes of the SMG is lacking. Therefore, a better understanding of how aging and patient-specific factors affect the SMG is critical for surgical planning, intraoperative decision-making, and ultimately superior results.
Substantial debate exists surrounding the morphological evolution of the SMG with aging and how various demographic factors affect the glandular volume and subsequent submandibular fullness. This is secondary to conflicting findings and heterogeneous designs of previous studies.11-16 Unlike the macroscopic nature of the gland, the microscopic changes associated with aging have been well described.17-19 However, these age-associated histologic changes have not thus far been correlated with significant macroscopic outcomes.13-16,20-25
While the debate continues on the true impact of aging on the SMG, further controversy exists regarding targeted management of the SMG for aesthetic indications. There have been ample surgical techniques described in the literature promising improved aesthetic results (Figure 1). However, the reluctance to incorporate such techniques persists due to the inconclusive findings and potential risk to adjacent neurovascular structures. Ideally, a better understanding of the inframandibular (IM) volume of the SMG will equip surgeons to decide with confidence the best operative approach for each patient.
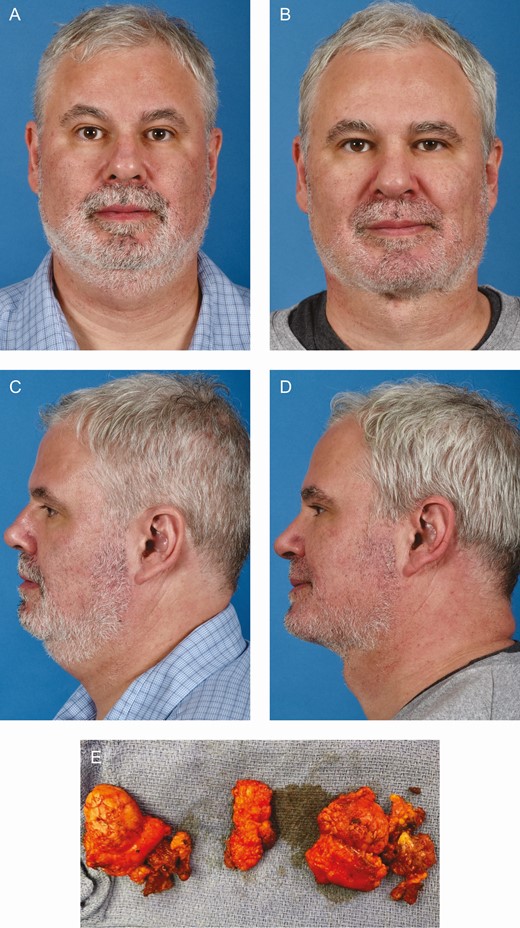
(A, C) Preoperative views of a 48-year-old male patient with cervical fullness and blunting of the mandibular border attributed to large and ptotic submandibular glands, subplatysmal fat, and digastric hypertrophy. (B, D) Four-month postoperative views following anterior open neck lift with deep neck work including submandibular gland and subplatysmal fat excision with a digastric shave. (E) Bilateral submandibular glands (a), subplatysmal fat (b, lateral; c, central), and digastric muscle (d) resected from the same patient.
The SMG plays an essential role in the appearance of the aging neck. Persistent submandibular fullness secondary to the SMG has been a common indication for revision after cervicoplasty. Therefore, the primary aim of this study was to identify whether SMG ptosis (descent) and/or hypertrophy is the primary etiology behind increased submandibular volume by describing the age-related changes of the IM and total volume of the SMG. Additionally, this study evaluated the relationship between demographic variables such as sex and BMI on glandular volume. We sought to determine age- and demographic-related changes to the SMG by employing volumetric MRI analysis. These findings will provide useful information for plastic surgeons to achieve optimal results and patient satisfaction.
METHODS
IRB approval was granted through the University of California, Los Angeles (Los Angeles, CA), as well as a Health Insurance Portability and Accountability Act waiver for this retrospective observational study. Written consent was provided by which the patients agreed to the use and analysis of their data. The study was conducted with data and images of patients who had undergone MRI of the head and neck region in the supine position through the Department of Radiology at the University of California, Los Angeles, between 2013 and 2020. Imaging was previously obtained as part of routine clinical care, not associated with this study. A database of patients was provided by the Department of Radiology in Microsoft Excel (Microsoft Corporation, Redmond, WA). Before the initial screening, simple randomization of the patients was performed by means of list of random numbers generated in Excel.
Patients more than 20 years old were initially included. To minimize confounding factors, electronic medical records were screened for the following exclusion criteria: comorbidities affecting the SMG, including cancer; current or previous clinical diagnosis of alcohol use disorder or eating disorders; any pathologies impacting the SMG and surrounding anatomy; congenital, traumatic, or surgical modifications altering craniofacial anatomy; or a history of radiation to the head or neck (Figure 2). Patient demographics, including age, sex, and BMI, were recorded.

Flow diagram detailing the review process to identify eligible study subjects. SMG, submandibular gland.
Image Analysis
All MRI studies were performed with either a Siemens 1.5-T or 3-T Sonato magnet (Siemens Medical Systems, South Iselin, NJ) at Ronald Reagan UCLA Medical Center. Before segmentation, imaging was screened for quality and to ensure the entire SMG was intact. The study coordinator and principal investigator reviewed questionable imaging, excluding any deemed unsuitable. Segmentation of the gland was conducted with Vital with Vitrea Advanced Visualization (Vital Images, Minnetonka, MN). Fat-suppressed T1-weighted MRIs with a maximum slice thickness of 3.0 mm were used for all measurements. Starting with coronal imaging, the IM portion of the gland was identified by taking the inferior border of the mandible as the starting landmark. Next, the gland was manually outlined, slice by slice, inferiorly until the entire IM portion was completed. The 3-dimensional volume was then calculated automatically by the imaging program. The total gland volume was then computed by tracing the SMG as a whole in the same fashion. Finally, the cranial-caudal height was measured. This was performed on both the right and left SMGs. Measurements were then performed on both the right and left SMGs based on the subject’s axial images (Figure 3). The inferior border of the mandible was first identified on the axial images and then confirmed by triangulation-based guidance from the previously measured coronal images. This served as the initial slice for measuring the IM portion of the SMG. All measurements were recorded in Microsoft Excel.


MRI segmentation of a 58-year-old male (BMI, 22.4 kg/m2). Axial and coronal fat-suppressed T1-weighted images were used to trace the 2-dimensional contour of the SMG, slice by slice, with Vital with Vitrea Advanced Visualization software. (A, B) Total and IM-SMG measured from coronal imaging with axial, sagittal, and 3-dimensional (3D) reconstructions. (C, D) Total and IM-SMG measured from axial imaging with coronal, sagittal, and 3D reconstructions. (E, F) Front view and (G, H) right lateral view of 3D reconstruction of the total and IM-SMG from coronal imaging. (I, J) Front view and (K, L) right lateral view of 3D reconstruction of the total and IM-SMG from axial imaging. IM, inframandibular; SMG, submandibular gland.
Statistical Analysis
Subjects were divided into 4 age-defined cohorts for clinical applicability based on the subject’s age at the time of imaging. The reference cohort included men and women between the ages of 20 and 44 years. Men and women were then divided into 3 cohorts: 45 to 54, 55 to 64, and ≥65 years old. Due to the heterogeneous composition and morphology of the gland, volumetric analyses were performed with multiple different dependent variables (Figure 4). Unilateral volumes were obtained from both axial and coronal images separately, and a unilateral average was calculated from these axial and coronal volumes. Additionally, an axial and coronal bilateral gland average was calculated from the left and right volumes. The bivariate association was tested with the chi-square test for categoric variables, such as sex, age group, and BMI class. In multivariable analyses assessing the association of laterality, age, gender, and BMI to unilateral volumes, mixed-effect models were used to account for the correlation between the left and right measurements. The average volume of the left and right measurements was analyzed with general linear models. The Dunnett-Hsu test was used to compare age groups with the reference age group as post hoc analysis adjusting for multiple comparisons. All analyses were done with SAS 9.4 (SAS Institute, Cary, NC).
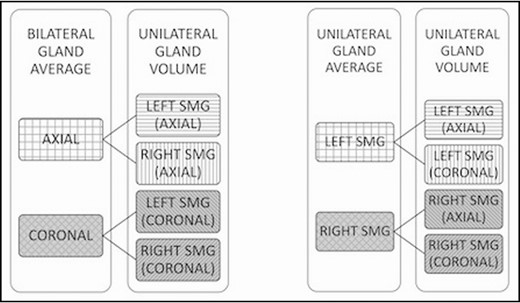
Dependent variables used for statistical analysis. Both left and right gland volumes were measured from axial and coronal imaging. The measured volumes were then used to calculate a bilateral gland average from the left and right volumes measured from axial and coronal images. A unilateral gland average was derived from the volume measured from axial and coronal images of the same gland.
RESULTS
This study included 129 subjects; 64 (49.6%) female, and 65 (50.4%) male. The mean age of the subjects was 52.57 years (range, 20-85 years), and their mean BMI was 25.33 kg/m2. The demographic data of each cohort are summarized in Table 1. The reference cohort included subjects between the ages of 20 and 44 years, 30 men and 22 women, 67.31% of whom were underweight or had normal BMI. The mean volume of the IM-SMG in the reference group was 6.29 cm3, and the mean total volume of the SMG was 8.82 cm3.
Subject Demographics
| Gender | BMI | Total by age | |||||
|---|---|---|---|---|---|---|---|
| Age group (years) | Male, N (%) | Female, N (%) | Underweight/normal, N (%) | Overweight/obese, N (%) | Unknown, N (%) | Count (N) | Percent |
| 20-44 | 30 (57.69) | 22 (42.31) | 35 (67.31) | 14 (26.92) | 3 (5.77) | 52 | 40.31 |
| 45-54 | 7 (50) | 7 (50) | 5 (35.71) | 9 (64.29) | 0 (0) | 14 | 10.85 |
| 55-65 | 11 (50) | 11 (50) | 9 (40.91) | 12 (54.44) | 1 (4.55) | 22 | 17.05 |
| ≥65 | 16 (39.02) | 16 (39.02) | 23 (56.10) | 16 (39.02) | 2 (4.88) | 41 | 31.78 |
| Total | 65 | 64 | 72 | 51 | 6 | 129 | 100 |
N (%) is the percentage from total subjects in respective age cohorts.
Total SMG Volume
Age
No significant difference in total SMG volume associated with age was observed. The reference cohort had a mean [standard error of the mean] total SMG volume of 8.77 [0.4] cm3 (95% CI, 7.93-9.62 cm3). The mean total SMG volumes for each cohort are detailed in Table 2.
Mean Total Submandibular Gland Volume Obtained from Axial and Coronal MRIs and Calculated Averages by Age
| Age (years) | Individual gland measurements | Bilateral gland averages | ||||||||
|---|---|---|---|---|---|---|---|---|---|---|
| Coronal volume (cm3) (95% CI) | P value | Axial volume (cm3) (95% CI) | P value | Average volume (cm3) (95% CI) | P value | Coronal volume (cm3) (95% CI) | P value | Axial volume (cm3) (95% CI) | P value | |
| 20-44 | 8.94 (8.01, 9.88) | Reference | 8.61 (7.77, 9.45) | Reference | 8.77 (7.93, 9.62) | Reference | 8.87 (7.94, 9.81) | Reference | 8.62 (7.78, 9.46) | Reference |
| 45-54 | 8.62 (7.10, 10.14) | 0.963 | 8.46 (7.10, 9.82) | 0.995 | 8.51 (7.15, 9.89) | 0.974 | 8.70 (7.18, 10.22) | 0.994 | 8.51 (7.15, 9.88) | 0.998 |
| 55-64 | 9.26 (8.03, 10.49) | 0.945 | 9.18 (8.08, 10.29) | 0.677 | 9.22 (8.11, 10.33) | 0.818 | 9.32 (8.10, 10.56) | 0.854 | 9.19 (8.08, 10.29) | 0.690 |
| ≥65 | 9.28 (8.29, 10.26) | 0.889 | 8.67 (7.79, 9.55) | 0.999 | 8.97 (7.93, 9.62) | 0.964 | 9.29 (8.31, 9.81) | 0.809 | 8.68 (7.80, 9.46) | 0.999 |
BMI
Compared with the reference group, the overweight or obese BMI class was associated with a significantly larger total SMG volume on all models (Table 3). The mean total volume of the reference group was 8.65 [0.31] cm3 (95% CI, 8.03-9.27 cm3) based on the unilateral gland average and 8.45 and 8.89 cm3 based on the bilateral axial and coronal averages, respectively.
Mean Total Submandibular Gland Volume obtained from Axial and Coronal T1-Weighted MRIs and Calculated Averages by Sex, BMI, and Laterality
| Individual gland measurements | Bilateral gland averages | |||||||||
|---|---|---|---|---|---|---|---|---|---|---|
| Coronal volume (cm3) (95% CI) | P value | Axial volume (cm3) (95% CI) | P value | Average volume (cm3) (95% CI) | P value | Coronal volume (cm3) (95% CI) | P value | Axial volume (cm3) (95% CI) | P value | |
| Sex | ||||||||||
| Female | 8.37 (7.41, 9.34) | Reference | 7.95 (7.09, 8.82) | Reference | 8.16 (7.29, 9.03) | Reference | 8.36 | Reference | 7.97 | Reference |
| Male | 9.68 (8.79, 10.56) | 0.006 | 9.51 (8.72, 10.30) | <0.001 | 9.58 (8.79, 10.38) | <0.001 | 9.74 | 0.004 | 9.53 | <0.001 |
| BMI | ||||||||||
| Underweight/normal | 8.85 (8.16, 9.53) | Reference | 8.46 (7.84, 9.07) | Reference | 8.65 (8.03, 9.27) | Reference | 8.89 | Reference | 8.45 | Reference |
| Overweight/obese | 10.02 (9.30, 10.73) | 0.018 | 9.45 (8.81, 10.09) | 0.024 | 9.73 (9.08, 10.37) | 0.016 | 10.00 | 0.024 | 9.46 | 0.022 |
| Laterality | ||||||||||
| Right | 9.08 (8.27, 9.89) | Reference | 8.83 (8.10, 9.55) | Reference | 8.95 (8.22, 9.67) | Reference | ||||
| Left | 8.97 (8.15, 9.79) | 0.451 | 8.64 (7.90, 9.37) | 0.141 | 8.79 (8.06, 9.53) | 0.206 |
Sex
Across all models, male sex was associated with a significantly larger total SMG volume (Table 3). Males had a mean total volume of 9.58 [0.40] cm3 (95% CI, 8.79-10.38 cm3) and females a mean total volume of 8.16 [0.44] cm3 (95% CI, 7.29-9.026 cm3) based on the unilateral gland average (P < 0.001).
Laterality
There was no significant difference between the left and right total SMG volumes across all models (Table 3). The right total SMG volume was consistently larger than the left SMG. Based on the unilateral gland average, the right total SMG volume was 8.94 [0.37] cm3 (95% CI, 8.22-9.67 cm3) and the left total SMG was 8.79 [0.37] cm3 (95% CI, 8.06-9.53cm3); however, this difference was not significant (P = 0.21).
Volume of the IM-SMG
Volumetric analysis of the IM-SMG demonstrated a significant relationship regarding age, sex, BMI, and laterality (Tables 4, 5).
Mean Inframandibular Submandibular Gland Volume Obtained from Axial and Coronal MRIs and Calculated Averages by Age
| Age (years) | Individual gland measurements | Bilateral gland averages | ||||||||
|---|---|---|---|---|---|---|---|---|---|---|
| Coronal volume (cm3) (95% CI) | P value | Axial volume (cm3) (95% CI) | P value | Average volume (cm3) (95% CI) | P value | Coronal volume (cm3) (95% CI) | P value | Axial volume (cm3) (95% CI) | P value | |
| 20-44 | 6.78 (5.82, 7.73) | Reference | 5.77 (4.94, 6.61) | Reference | 6.30 (5.49, 7.10) | Reference | 6.75 (5.79, 7.70) | Reference | 5.77 (4.93, 6.61) | Reference |
| 45-54 | 7.63 (6.08, 9.19) | 0.611 | 6.72 (5.36, 8.08) | 0.424 | 7.15 (5.84, 8.47) | 0.474 | 7.67 (6.11, 9.23) | 0.550 | 6.72 (5.36, 8.08) | 0.419 |
| 55-64 | 8.37 (7.11, 9.63) | 0.055 | 7.51 (6.40, 8.61) | 0.011 | 7.92 (6.85, 8.98) | 0.015 | 8.4 (7.14, 9.66) | 0.043 | 7.51 (6.41, 8.61) | 0.011 |
| ≥65 | 7.95 (6.95, 8.96) | 0.096 | 7.19 (6.31, 8.07) | 0.011 | 7.57 (6.72, 8.42) | 0.021 | 7.97 (6.96, 8.97) | 0.080 | 7.19 (6.31, 8.07) | 0.011 |
Mean Inframandibular Submandibular Gland Volume Obtained from Axial and Coronal T1-weighted MRIs and Calculated Averages by Sex, BMI, and Laterality
| Individual gland measurements | Bilateral gland averages | |||||||||
|---|---|---|---|---|---|---|---|---|---|---|
| Coronal volume (cm3) (95% CI) | P value | Axial volume (cm3) (95% CI) | P value | Average volume (cm3) (95% CI) | P value | Coronal volume (cm3) (95% CI) | P value | Axial volume (cm3) (95% CI) | P value | |
| Sex | ||||||||||
| Female | 7.12 (6.13, 8.10) | Reference | 5.88 (5.01, 6.74) | Reference | 6.50 (5.66, 7.33) | Reference | 7.11 | Reference | 5.88 | Reference |
| Male | 8.25 (7.35, 9.15) | 0.178 | 7.72 (6.93, 8.51) | <0.001 | 7.97 (7.21, 8.73) | <0.001 | 8.29 | 0.014 | 7.72 | <0.001 |
| BMI | ||||||||||
| Underweight/normal | 7.48 (6.78, 8.18) | Reference | 6.39 (5.78, 7.00) | Reference | 6.93 (6.34, 7.52) | Reference | 7.51 | Reference | 6.39 | Reference |
| Overweight/obese | 8.46 (7.73, 9.19) | 0.052 | 7.52 (6.88, 8.16) | 0.011 | 7.98 (7.37, 8.60) | 0.013 | 8.45 | 0.060 | 7.52 | 0.010 |
| Laterality | ||||||||||
| Right | 7.76 (6.93, 8.58 | Reference | 6.91 (6.19, 7.64) | Reference | 7.33 (6.63, 8.03) | Reference | ||||
| Left | 7.61 (6.78, 8.44) | 0.264 | 6.68 (5.95, 7.41) | 0.044 | 7.14 (6.43, 7.84) | 0.081 |
Age
Unilateral gland average:
The relationship between age and individual IM-SMG volume demonstrated that older age was associated with an increased IM-SMG volume vs the reference group (Table 4). The largest increase in volume was found in the 55- to 64-year cohort, with a mean volume of 7.91 cm3 (P = 0.005), followed by the ≥65-year cohort with a mean volume of 7.57 cm3 (P = 0.007), with the smallest increase in the 45- to 54-year cohort with a mean volume of 7.15 cm3 (P = 0.21). After adjusting for multiple comparisons, older age was associated with a significant increase in volume in both the 55- to 64-year and ≥65-year cohorts with a 13.63% and 20.22% increase in volume compared with the reference group (P = 0.01, P = 0.02). The 45- to 54-year cohort was associated with a 13.63% increase but was not significant (P = 0.47).
Bilateral gland average: axial imaging:
On examination of the bilateral IM-SMG average obtained from axial imaging, increased age was associated with a significant increase in volume in both the 55- to 64-year and ≥65-year cohorts after adjusting for multiple comparisons. The 45- to 54-year cohort was found to have a mean volume of 6.72 cm3 (P = 0.41) and the 55- to 64-year and ≥65-year cohorts mean volumes of 7.5 cm3 (P = 0.01) and 7.19 cm3 (P = 0.01), respectively.
Bilateral gland average: coronal imaging:
Analysis of the bilateral IM-SMG average from coronal imaging revealed that older age was associated with increased volume. The 55- to 64-year and ≥65-year cohorts had a significantly larger IM-SMG volume with mean volumes of 8.40 cm3 (P = 0.02) and 7.97 cm3 (P = 0.02), respectively. Similar to axial imaging, the 45- to 54-year cohort was observed to have an IM-SMG volume 20.2% larger than the reference group. However, this was not significant before (P = 0.25) or after (P = 0.55) adjusting for multiple comparisons. After adjusting for multiple comparisons, only the 55- to 64-year cohort had a significant increase in volume, approximately 24.62% greater than the reference group (P = 0.04). Both the 45- to 54-year and ≥65-year cohorts were associated with an increased volume, approximately 13.80% and 18.24% greater than the reference group, respectively (P = 0.55, P = 0.07).
BMI
BMI was also found to significantly impact the IM-SMG volume (Table 5). The reference group consisted of subjects with a BMI <25 kg/m2 and was found to have a mean IM-SMG volume of 6.93 [0.30] cm3 (95% CI, 6.34-7.52 cm3) based on the unilateral gland average, and 6.38 and 7.51 cm3 based on the bilateral gland average derived from axial and coronal imaging, respectively. Subjects with an overweight (25-30 kg/m2) or obese (>30 kg/m2) BMI had a mean volume of 7.52 cm3 (P = 0.01) based on the unilateral gland average. Based on the bilateral gland averages derived from axial and coronal imaging, the mean volumes were 7.52 cm3 (P = 0.01) and 8.45 cm3 (P = 0.06), respectively.
Sex
Female sex was used as the reference group when examining the relationship between sex and IM-SMG volume, and males were found to have a significantly larger IM-SMG volume on all models (Table 5). Females had a mean IMG-SMG volume of 6.49 [0.42] cm3 (95% CI, 5.66-7.33 cm3) and 5.88 cm3 based on axial unilateral and bilateral averages, respectively. The mean IM-SMG volume for men was 7.97 [0.38] cm3 (95% CI, 7.21-8.73 cm3) and 7.7 cm3 based on axial unilateral (P < 0.001) and bilateral (P < 0.001) averages, respectively.
Laterality
The relationship between laterality and IM-SMG volume was evaluated with left SMG assigned as the reference group (Table 5). The right IM-SMG volume was significantly larger (P = 0.04) on axial imaging. The IM-SMG volume of the right gland was also found to be larger than the left gland on coronal imaging (P = 0.26) and the unilateral gland average (P = 0.08) but the difference was not found to be significant.
SMG Cranial-Caudal Length
The relationships between the length of the gland and age, BMI, sex, and laterality were assessed, with the only significant difference being between males and females (Supplemental Table 1, available online at www.aestheticsurgeryjournal.com). The mean length was 35.71 mm. The 45- to 54-year cohort had the longest SMG length at 37.15 [1.84] mm (95% CI, 33.49-40.81 mm), compared with the reference cohort with a gland length of 35.68 [1.14] mm (95% CI, 33.43-37.93 mm) (P = 0.43). Males had a mean SMG length of 38.61 [1.07] mm (95% CI, 36.48-40.72 mm) compared with females with a mean length of 34.28 [1.17] mm (95% CI, 31.96-36.6 mm) (P < 0.001).
DISCUSSION
The demand for facial and cervical aesthetic contouring continues to be steadfast. As a result of the complex and dynamic changes associated with aging, it is critical to understand these anatomic alterations to the best of our ability. Our novel finding of a significantly larger IM volume with no change in overall SMG volume provides evidence for SMG ptosis rather than hypertrophy as a significant contributor to age-related submandibular fullness. Again, there is no significant difference in total gland volume or glandular height with aging, emphasizing glandular descent over hypertrophy. Additionally, our findings that male sex and a greater BMI were associated with larger SMG volumes are consistent with previous studies and help validate our methodology.
Although some of our findings are complemented by the literature, the current study isolated and measured the volume of the gland inferior to the mandible to characterize the portion of the gland most clinically relevant. We observed an increase in IM-SMG volume in all cohorts compared with the reference group, but only the 55- to 64-year and ≥65-year cohorts were significantly larger. Interestingly, the 55- to 64-year cohort was found to have the largest IM-SMG volume, followed by the ≥65-year cohort. In contrast, the total volume of the gland did not significantly differ between all age groups, nor did the craniocaudal height when compared with the reference cohort.
Subjects between the ages of 55 and 64 years were found to have the significantly largest IM-SMG volume. This unexpected finding may be explained by multiple factors. First, previous studies have demonstrated an increase in the total SMG volume throughout adulthood to a certain age.13,15 Although these studies only reported total gland volume, these findings align with the current study’s trend in increased IM-SMG volume. Second, histologic alterations to the SMG have been previously described.13,26,27 Dong revealed a 2.0 times increase in fat and 0.8 times increase in fibrous tissues in SMGs operatively removed from subjects 60 years and older compared with subjects 25 years and younger.26 Additionally, a study by Martinez-Madrigal and Micheau attributed age-related changes of the SMG to a result of “oncocyte proliferation, fatty infiltration, squamous mucous metaplasia, hyperplasia, atrophy, and regeneration,”27 which were similar to those observed by Saito et al.13 Although the specific explanation remains unclear, additional studies further stratifying this age group and ideally correlating imaging-derived volumes of the gland with histologic analysis may provide a better description of these changes.
There has been much debate regarding the evolution of the SMG with age and the role this plays in obscuring the desired youthful cervicomental angle and defined mandibular border. The inconclusive and discrepant nature of the current literature is multifactorial and due primarily to the limited number of heterogeneous studies. First, no study has previously isolated the inferior portion of the gland, which is the most important factor for the aesthetic surgeon. Second, several studies investigating the effects of age, BMI, and sex on the gland’s volume have demonstrated inconsistent findings or do not collectively examine the impact of these factors.11,14,15,17,25,28-30 In our study, we account for all of these factors. Additionally, by isolating the IM volume of the gland, this study provides the first descriptions of the portion of the gland that is most clinically relevant. Furthermore, it is difficult to correlate the current study’s findings with cadaveric studies12 or with those in which the mean cross-sectional area serves as a surrogate for volume.16,20 Moreover, when volumetric assessments were carried out with computed tomography and MRI segmentation simultaneously, the findings were conflicting14 or did not include variables such as sex or BMI.13 Lastly, the longitudinal study by Sawan et al provides a unique perspective based on volumes obtained from the same patient over a period of time and found that the majority of total SMG volume increase occurs before the fourth decade, especially in men, with BMI being a significant predictor of volume. However, clinical applicability is limited by its small size, insufficient BMI analysis, and a younger patient population, with >50% of the subjects being 50 years and younger.15 Therefore, whereas the current study’s reference cohort reflects the population studied previously, demonstrating a greater degree of overall volume change in adults 40 years and younger, this study aimed to highlight the aging population that routinely presents for face and neck rejuvenation. Future studies with a greater range of ages may complement the literature and the current study by more precisely identifying when glandular growth plateaus and ptosis begins.
Consequentially, these discrepancies contribute to the debate surrounding targeted interventions of the SMG during aesthetic procedures. Subtotal excisions, SMG suspensions, platysma cradles, and SMG release and repositioning techniques have been described as options to manage the SMG during rhytidectomy and cervicoplasty.31-34 However, some argue that these interventions carry unnecessary risk, and aggressive management of otherwise healthy glandular tissue should be avoided. The findings reported in this study confirm and expand the current understanding of the SMG and may help guide perioperative decision-making to achieve superior results (Figure 5). In addition, Feldman found that correction of a persistent SMG bulge was the second most common indication for revision following a neck lift.35 Therefore, by incorporating our findings, the surgeon may follow a more tailored approach to each patient to reduce the number of secondary procedures and provide a platform for future studies to identify further which patient populations would benefit most from targeted management of the SMG.
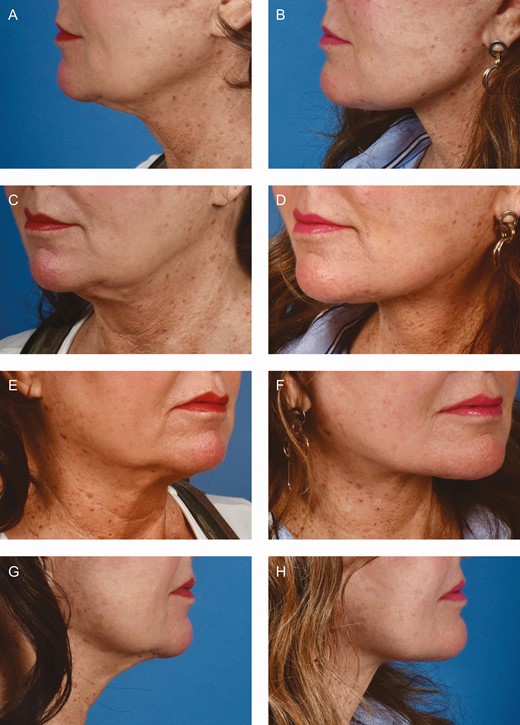
(A, C, E, G) Preoperative views of a 71-year-old female patient with persistent submandibular fullness after a previous facelift with anterior open neck platysmaplasty. (B, D, F, H) Three-month postoperative views following secondary facelift and neck lift with primary submandibular gland reduction.
The limitations of our study include the retrospective design, imaging acquisition, and the inherent variability associated with anatomic segmentation. As a result of studying MRIs obtained for reasons other than research, a standardized imaging protocol was not in place. Thus, minimizing variability such as subject positioning was outside of our control. Along these lines, head tilt in either the lateral or anteroposterior direction could have affected which portion of the SMG the measurer perceived as IM. Similarly, because the MRIs used in this study were taken from patients in the supine position, our study’s measurements do not account for gravity’s downward displacement of the SMG seen in patients seated in Fowler’s position. Also, although attempts were made to blind each measurer, due to the design of the segmentation software, it was not possible to remove all demographic data and conduct the study in a blinded fashion. However, each measurer was randomly assigned subjects of all ages. Furthermore, although the patient’s date of birth was visible on the initial screen before performing the measurements, the patient’s exact age at the time of the MRI was not available to the measurers. Other demographics were also not available to the measurer. We feel that this did not significantly impact our findings because they do not support our hypothesis that the oldest cohort would have the largest IM-SMG volume. Our findings demonstrated that this cohort of subjects had lower IM-SMG volumes. Further, although all subjects’ electronic medical records were screened, the possibility of inaccurate or outdated records exists. Additionally, all attempts were made to mitigate the magnitude of error associated with anatomic studies through extensive training, random accuracy checks, and obtaining measurements of the right and left glands separately in both axial and coronal planes. These measurements were then used to calculate multiple unilateral and bilateral gland averages to minimize observer bias. Previous studies have solely reported findings from axial imaging; 16 however, coronal imaging was also analyzed independently in the current study. Although coronal-derived volumes tended to be larger than axial-derived volumes, they were found to follow the same trends in IM-SMG and total SMG volumes observed on independent analysis of axial volumes (Supplemental Figures 1-5, available online at www.aestheticsurgeryjournal.com). However, unlike the independent analysis on axial volumes, analysis performed with only coronal-derived volumes was not significant in regard to age. Considering this, the previously described unilateral and bilateral gland averages were also used for analysis. This does not discredit our findings but rather strengthens our study. Multiple measurements were made on the same gland by a single measurer, more precisely identifying the inferior border of the mandible, improving accuracy, and ultimately demonstrating consistent trends across all models. Lastly, although this study reflects a large, diverse population, constructing BMI-controlled cohorts was not feasible. Although attempts were made to balance each cohort regarding BMI class, we do not believe this significantly impacts our findings, as one would expect to observe the largest volumes in the cohort with the greater number of overweight or obese subjects, which is not supported by our results. By utilizing BMI-balanced cohorts in the future, it may be possible to identify the precise contribution BMI exerts on glandular volumes. Future studies explicitly quantifying the relationship of the SMG to the inferior border of the mandible or the floor of the mouth may identify the degree of descent that occurs with aging and may specify which imaging plane facilitates more accurate segmentation. Additionally, segmentation of the mandible in future studies may provide insight into whether mandibular resorption as one ages results in a greater volume of exposed and clinically accessible glandular tissue.
Lastly, the current study may be differentiated from the literature because MRI segmentation was used to measure the IM and total volume of the SMG with a greater sample size (n = 129) based on multiple imaging planes acquired at the same time. Furthermore, age, sex, and BMI were accounted for to comprehensively understand their effects on the gland’s volume.
CONCLUSIONS
Achieving an aesthetically pleasing and youthful neck is often the patient’s primary purpose for seeking facial and cervical rejuvenation. The SMG plays an important role in the aging face and neck. However, the specific impact that aging plays on the SMG remains relatively inconclusive. This has resulted in debate over targeted management of the gland during rhytidectomy and cervicoplasty. Our findings support the concept of SMG descent or ptosis rather than hypertrophy as the etiology of the SMG’s contribution to submandibular fullness. We identified that whereas the total volume of the SMG does not significantly change with aging, the IM volume of the gland does in fact increase, most significantly in those 55 years and older. Further, the relationship between sex and higher BMI significantly contributes to the SMG’s volume.
Disclosures
The authors declared no potential conflicts of interest with respect to the research, authorship, and publication of this article. Dr Roostaeian is a clinical editor for Aesthetic Surgery Journal and a Rhinoplasty contributing editor for ASJ Open Forum.
Funding
The authors received no financial support for the research, authorship, and publication of this article.
REFERENCES

