


Abstract
Volumetric hand rejuvenation of the dorsal hands is increasingly applied for aged, skeletonized dorsal hand skin, with prominent veins, tendons, and joints due to volumetric loss of subcutaneous fat. However, the aging process of the fatty laminae remains unexplored.
The aim of this study was to investigate the impact of aging and potential determinants on the fatty laminae to improve the therapeutic effect of volumetric injection.
This cross-sectional study enrolled 105 Taiwanese participants aged ≥20 years, divided into 5 decade-based age groups. A single blinded practitioner measured the thicknesses of the dorsal superficial lamina (DSL), dorsal intermediate lamina (DIL), and dorsal deep lamina (DDL) by ultrasonography. The potential determining factors of the laminae thickness (age, sex, BMI, and hand dominance) were analyzed.
The thicknesses of the 3 laminae decreased with age, with the mean decrease in thickness from the 20s to >60 years of the DSL, DIL, and DDL being 0.21 mm (30.0%), 1.38 mm (63.89%), and 0.31 mm (20.95%), respectively. The decrease in DIL thickness was the greatest and most significant in subjects aged >30 years. Multiple linear regression analysis showed age to be the only determinant of thickness for the 3 laminae (all P < 0.001), although the DIL was significantly thicker in men (P < 0.001).
Volumetric fat loss was noted in the 3 fatty laminae of dorsal hands during aging; the DIL showed the greatest progressive fat loss after the age of 30. Volumetric rejuvenation of the 3 laminae may result in the most aesthetic appearance, especially in women.
See the Commentary on this article .
Although youthful appearance can be achieved through facial rejuvenation, the hands are also a good indicator of a person’s true age. The dorsum of the hand is often considered to be a woman’s “second face” due to its prominent aging process, resulting in the increasing popularity of dorsal hand rejuvenation. During the COVID-19 pandemic, wearing a face mask has become mandatory. Therefore, the hands become the most visible body part from which to estimate age. Aging of the hands involves the cutaneous, subcutaneous, and osseous structures, and is influenced by both intrinsic and extrinsic factors.1,2 Intrinsic aging, environmental exposures, and photodamage lead to epidermal changes and cutaneous pigmentation, which can be addressed by topical agents, chemical peels, and lasers.3 Loss of subcutaneous fat and muscle atrophy enhance the prominent tortuous veins, tendons, and joints beneath the skeletonized skin of the dorsal hands.3
Volume augmentation has been achieved with various dermal fillers or lipofilling, applied by different techniques based on physician experience.4 The dorsum of the hand comprises the skin, dorsal superficial lamina (DSL), dorsal superficial fascia (DSF), dorsal intermediate lamina (DIL), dorsal intermediate fascia (DIF), dorsal deep lamina (DDL), and dorsal deep fascia (DDF).5 The DSL is the uppermost layer of fat laminae between the dermis and the DSF. Because it contains few important structures, the DSL is the preferred option for filler injections.6-8 Although there are dorsal venous plexuses and sensory nerves in the DIL, this layer is regarded as a favorable target for treatment without the risk of serious adverse events.1,6,9 The DDL is the deepest fatty lamina, containing extensor tendons and overlying the interosseous muscles and metacarpals bounded by the DDF, and is seldom targeted alone in filler injections.1,6,7,9 However, a few studies have investigated anatomic changes in these fatty laminae during aging and the factors that influence fatty lamina thickness. It is necessary to understand the aging process of the dorsum of the hands to develop rejuvenation therapies that will yield the most aesthetic appearance. Thus, we conducted a cross-sectional study to analyze, by ultrasonography, the association between volume loss in the fatty laminae of dorsal hands and the aging process.
METHODS
Ethics Approval
This study was approved by the Chang Gung Medical Foundation Institutional Review Board (Taipei, Taiwan) (IRB No. 202101547B0). Written consent was obtained by which the patients agreed to the use and analysis of their data.
Data Sources and Study Participants
A total of 210 hands of 105 volunteers (power, 0.9) aged ≥20 years were included in this multicenter, cross-sectional study. Individuals with a history of psoriasis, rheumatic arthritis, skin diseases involving the hands, major hand trauma, limb edema, recent significant weight changes, or previous filler injection to the dorsal hands, and those receiving intravenous catheter insertion and hemodialysis via the forearms or hands were excluded.
Measures and Outcomes
We divided the patients into 5 age groups: Group 1 (20-30 years), Group 2 (31-40 years), Group 3 (41-50 years), Group 4 (51-60 years), and Group 5 (>60 years). For ultrasound imaging, both hands were placed in a relaxed, upright position with the 5 fingers separated loosely. Ultrasound examination was performed with a 10-MHz linear transducer (LeSono LU700L, Leltek, Inc., New Taipei City, Taiwan). The transducer was placed centrally on the point where the extensor tendon of the middle finger crosses the line connecting the metacarpophalangeal joints of the thumb and little finger (Figure 1). The physician performing the ultrasound examination was blinded to the real age of each participant. The transducer was lightly placed on the examined area with a large amount of gel to avoid compression. The thicknesses of the 3 fatty laminae between the metacarpal bones were measured (Figure 2). Age, medical history, hand dominance, and BMI data were collected. The participants were also grouped based on their BMI: underweight (≤18.5 kg/m2), normal (18.5-24.9 kg/m2), overweight (25.0-29.9 kg/m2), and obese (≥30.0 kg/m2).
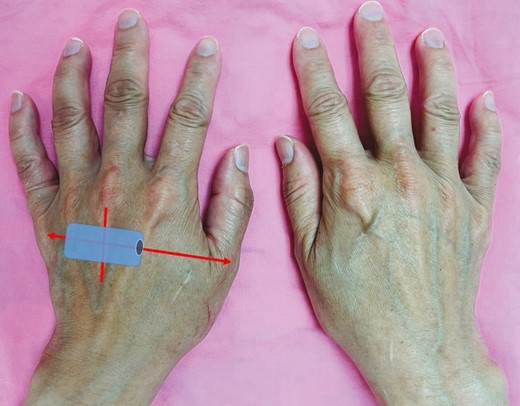
Illustration of sonographic transducer positioning on the dorsum of the hand in a 40-year-old female patient. The aging dorsal hands show visible extensor tendons and bulging veins.
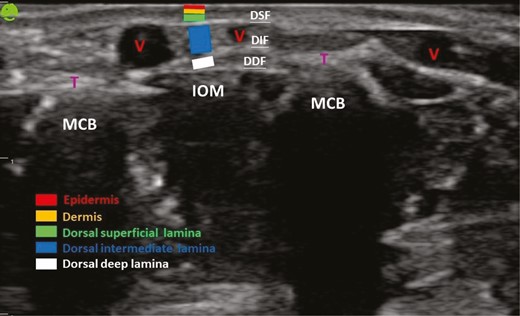
Anatomic structures of the dorsum of the hand through ultrasound examination. DDF, dorsal deep fascia; DIF, dorsal intermediate fascia; DSF, dorsal superficial fascia; IOM, interosseous muscle; MCB, metacarpal bone; T, extensor tendon; V, vein.
Statistical Analyses
The thicknesses of the 3 fatty laminae among different age and BMI groups were compared by one-way analysis of variance (ANOVA) with Tukey’s post-hoc test and then 2 independent-sample t tests to compare them between the sexes and hand dominance. The associations between the thicknesses of the 3 fatty laminae and age, sex, BMI, and hand dominance were assessed by multiple linear regression analysis. Statistical analyses were performed with SPSS, version 20.0 (IBM, Corp., Armonk, NY). A 2-tailed P value of <0.05 was considered statistically significant.
RESULTS
Demographic Characteristics
This study included 64 women and 41 men. All participants were Taiwanese, and belonged to the Fitzpatrick skin types III and IV. The mean ages of all individuals, men, and women were 47.72 years (range, 20-80 years), 47.63 years (range, 20-80 years), and 47.78 years (range, 25-76 years), respectively. The average BMI was 23.29 kg/m2 (range, 16.0-47.60 kg/m2) (Table 1). All individuals were right-handed. Each group comprised 20 volunteers, except for Group 5, which had 25 volunteers. Photographs of the dorsal hands of the different age groups showed that the extensor tendons and veins became increasingly visible and bulged with age (Figures 1, 3A,B). Volumetric loss in the fatty laminae, especially in the DIL, was remarkable in the dorsum of the aged hand in ultrasound examination (Figure 3C,D).
Demographic Data
| Demographics | All patients (n = 105) | Group 1b (n = 20) | Group 2b (n = 20) | Group 3b (n = 20) | Group 4b (n = 20) | Group 5b (n = 25) |
|---|---|---|---|---|---|---|
| Age, years | 47.72 [16.46] | 26.05 [2.61) | 34.90 [3.21] | 45.25 [2.90] | 56.85 [2.83] | 70.00 [5.22] |
| Sex, n (%) | ||||||
| Female | 64 (60.95) | 10 (50) | 13 (65) | 14 (70) | 14 (70) | 13 (52) |
| Male | 41 (39.05) | 10 (50) | 7 (35) | 6 (30) | 6 (30) | 12 (48) |
| Body mass index, kg/m2 | 23.29 [4.49] | 20.71 [2.58] | 23.89 [6.47] | 22.72 [3.28] | 25.35 [5.08] | 23.68 [3.22] |
| Underweight, n (%) | 6 (5.71) | 2 (10) | 2 (10) | 1 (5) | 1 (5) | 0 |
| Normal, n (%) | 61 (58.10) | 17 (85) | 9 (45) | 11 (55) | 8 (40) | 16 (64) |
| Overweight, n (%) | 24 (22.86) | 0 | 7 (35) | 7 (35) | 5 (25) | 5 (20) |
| Obese, n (%) | 14 (13.33) | 1 (5) | 2 (10) | 1 (5) | 6 (30) | 4 (16) |
| Comorbidity, n (%) | ||||||
| Hypertension | 10 (9.52) | 0 | 0 | 2 (10) | 3 (15) | 5 (20) |
| Diabetes mellitus | 6(5.71) | 0 | 0 | 1 (5) | 4 (20) | 1 (4) |
| Cardiovascular disease | 1 (0.95) | 0 | 0 | 0 | 1 (5) | 0 |
| Chronic kidney diseasea | 4 (3.81) | 0 | 0 | 0 | 1 (5) | 3 (12) |
| Malignancy | 12 (11.43) | 0 | 1 (5) | 1 (5) | 4 (20) | 6 (24) |
Values are mean [standard deviation] or n (%).
aNo hemodialysis or peritoneal dialysis.
bAge groups: Group 1, 20 to 30 years; Group 2, 31 to 40 years; Group 3, 41 to 50 years; Group 4, 51 to 60 years; Group 5, >60 years.
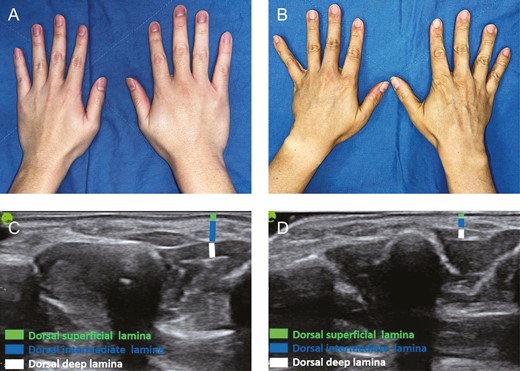
(A) Youthful appearance of the dorsum of the hand in a 23-year-old male showing supple soft tissues obscuring the subcutaneous structures. (B) Aged appearance of the dorsum of the hand in a 48-year-old male showing dominant wrinkles, prominent tendons, bulging veins, and volumetric loss in the sunken thenar and hypothenar eminence. (C) Ultrasound examination of the dorsum of the hand in a 23-year-old male patient. (D) Ultrasound examination of the dorsum of the hand in a 48-year-old male patient, showing volumetric loss in the 3 fatty laminae, especially the dorsal intermediate lamina.
One-way ANOVA and t Test of the Thickness of Each Fatty Lamina in Different Groups
The average thickness (mean [standard deviation]) of each lamina decreased from Group 1 (DSL, 0.70 [0.11] mm; DIL, 2.16 [0.26] mm; DDL, 1.48 [0.27] mm) to Group 5 (DSL, 0.49 [0.12] mm; DIL, 0.78 [0.22] mm; DDL, 1.17 [0.27] mm) (Table 2). The mean decrease in thickness from Group 1 to Group 5 in DSL, DIL, and DDL was 0.21 mm (30.0%), 1.38 mm (63.89%), and 0.31 mm (20.95%), respectively (Table 2). One-way ANOVA showed that the thicknesses of DSL, DIL, and DDL were significantly different among the various age groups (all P < 0.001) (Table 2). Post-hoc testing was performed to assess the sequential changes in each decade (Figure 4). Regardless of the layers of laminae, their thickness tended to decrease with age. Among the 3 fatty laminae, DIL thickness was significantly reduced at each decade (P < 0.05), except during the transition between the 30s and 40s (Figure 4). DSL thickness significantly decreased every 2 decades (P < 0.05) after the 40s (Group 3) (Figure 4). The volumetric loss in DDL was not significant until >60 years of age (Group 5) (Figure 4). Among the different BMI groups, the thicknesses of DSL and DIL achieved significant differences (P = 0.002 and 0.033, respectively) (Table 2). The DIL in men was significantly thicker than that in women (P = 0.009). Furthermore, hand dominance did not affect the thicknesses of the three laminae (Table 2).
One-way Analysis of Variance and t Test for the Thickness of Each Fatty Lamina in Different Groups
| Characteristics | Dorsal superficial lamina thickness | Dorsal intermediate lamina thickness | Dorsal deep lamina thickness | |||
|---|---|---|---|---|---|---|
| Mean [SD], mm | P value | Mean [SD], mm | P value | Mean [SD], mm | P value | |
| Age, yearsa | ||||||
| 20-30 | 0.70 [0.11] | <0.001 | 2.16 [0.26] | <0.001 | 1.48 [0.27] | <0.001 |
| 31-40 | 0.66 [0.13] | 1.44 [0.27] | 1.42 [0.26] | |||
| 41-50 | 0.62 [0.13] | 1.29 [0.33] | 1.40 [0.29] | |||
| 51-60 | 0.55 [0.12] | 0.95 [0.18] | 1.33 [0.31] | |||
| >60 | 0.49 [0.12] | 0.78 [0.22] | 1.17 [0.27] | |||
| BMIa | ||||||
| Underweight | 0.73 [0.12] | 0.002 | 1.42 [0.58] | 0.033 | 1.41 [0.28] | 0.686 |
| Normal | 0.60 [0.14] | 1.37 [0.60] | 1.35 [0.30] | |||
| Overweight | 0.58 [0.14] | 1.23 [0.42] | 1.38 [0.35] | |||
| Obese | 0.54 [0.14] | 1.06 [0.39] | 1.30 [0.23] | |||
| Sexb | ||||||
| Male | 0.60 [0.14] | 0.960 | 1.42 [0.60] | 0.009 | 1.35 [0.28] | 0.977 |
| Female | 0.60 [0.15] | 1.22 [0.50] | 1.35 [0.32] | |||
| Hand dominanceb | ||||||
| Dominant | 0.61 [0.15] | 0.284 | 1.32 [0.53] | 0.577 | 1.34 [0.30] | 0.682 |
| Nondominant | 0.59 [0.14] | 1.28 [0.56] | 1.36 [0.30] | |||
SD, standard deviation.
aOne-way analysis of variance.
bTwo independent-sample t tests.
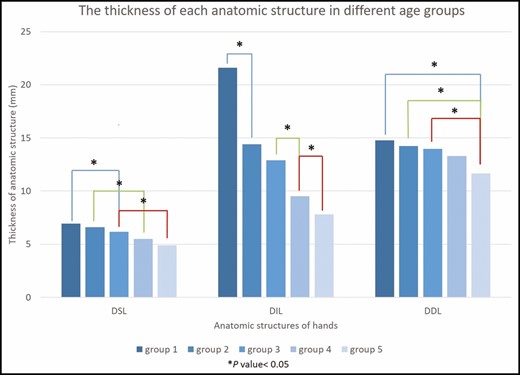
The thicknesses of the three fatty laminae in different age groups after one-way analysis of variance post-hoc test. Age groups: Group 1, 20 to 30 years; Group 2, 31 to 40 years; Group 3, 41 to 50 years; Group 4, 51 to 60 years; Group 5, >60 years. DDL, dorsal deep lamina; DIL, dorsal intermediate lamina; DSL, dorsal superficial lamina.
Multiple Linear Regression Analysis of Factors Affecting the Thickness of Each Fatty Lamina
In the multiple linear regression analysis, age was the only independent factor associated with volumetric loss in the 3 laminae (all P < 0.001) (Table 3). No associations between hand dominance and BMI and the thicknesses of the 3 laminae were evident. However, DIL thickness in men was significantly greater than that in women (Table 3).
Multiple Linear Regression Analysis
| Dorsal superficial lamina | Dorsal intermediate lamina | Dorsal deep lamina | |||||||||||||
|---|---|---|---|---|---|---|---|---|---|---|---|---|---|---|---|
| Unstandardized coefficients | Standardized coefficients β | t | P value | Unstandardized coefficients | Standardized coefficients β | t | P value | Unstandardized coefficients | Standardized coefficients β | t | P value | ||||
| B | SE | B | SE | B | SE | ||||||||||
| Agea | –0.005 | 0.001 | –0.545 | –9.116 | <0.001 | –0.027 | 0.001 | –0.811 | –20.889 | <0.001 | –0.007 | 0.001 | –0.360 | –5.374 | <0.001 |
| BMIb | –0.001 | 0.002 | –0.020 | –0.325 | 0.746 | –0.005 | 0.005 | –0.040 | –1.029 | 0.305 | 0.001 | 0.005 | 0.010 | 0.154 | 0.878 |
| Sexc | 0.001 | 0.017 | 0.004 | 0.067 | 0.947 | 0.204 | 0.043 | 0.183 | 4.789 | <0.001 | –0.001 | 0.040 | –0.001 | –0.017 | 0.987 |
| Hand dominanced | 0.021 | 0.017 | 0.074 | 1.279 | 0.202 | 0.042 | 0.041 | 0.039 | 1.027 | 0.306 | –0.017 | 0.039 | –0.028 | –0.436 | 0.663 |
SE, standard error.
aPer year.
bPer 1 kg/m2.
c0 = female, 1 = male.
d0 = non-dominant hand, 1 = dominant hand.
DISCUSSION
Studies on the chronological aging process of the dorsal hands are needed to improve rejuvenation methods. A youthful hand, rich in soft tissue, appears elastic and supple, and contains minimal wrinkles apart from flexion creases over the joints of fingers. Conversely, an aged hand is characterized by prominent wrinkles, visible joints and veins, atrophied skin, deformity, and spots.10 One study analyzing digital photographs of hands of individuals of all ages revealed that the apparent aging process starts in the 40s because bony and subcutaneous structures are hidden beneath soft tissues in the 30s.2 In contrast, our study demonstrated that volumetric loss of subcutaneous fat in the DIL began as early as the 30s. Surprisingly, the aging process occurs earlier than expected although changes in the clinical appearance may not be so noticeable during this period. Individuals desiring a youthful appearance of the dorsal hands are encouraged to seek early cosmetic treatment.
During the aging process, a dorsal wrinkling pattern develops from the proximal wrist aspect to the entire dorsum due to progressive loss of skin elasticity, gradual volumetric loss of the intrinsic muscles and subcutaneous fat, and an increase in the number of age spots, prominent dorsal veins, and visible tendons.2 Hand aging involves multiple changes of the skin, and of subcutaneous, muscular, and osseous structures. In one 3-dimensional stereophotogrammetry study, dorsal hands of younger individuals were smoother than those of older individuals in terms of surface change, but the changes were not statistically significant. Further, soft tissue reduction was significantly found in the center of the dorsal hand in older indivuals.11 In addition to aging, sun exposure contributes to skin texture changes, as shown in the evaluation of skin surface topography and digital photography.12,13 The skin texture changes with age are significant for the dorsal hand and nose, but not for other sun-exposed sites; moreover, the dorsal hand skin exhibits the greatest roughness over the age of 40 years.13 Among numerous aging changes, prominent veins may be one of the most important factors affecting aesthetics.10 Altering the digital images of the aging hands by removing veins to represent ongoing volume rejuvenation results in younger-looking hands, which is more effective than erasing skin blemishes to simulate a chemical peel, nail varnish, and addition of jewelry.10 The volumetric loss of subcutaneous fat and soft tissues results in incomplete emptying of the dorsal veins due to the lack of compression effects and the increasingly tortuous courses of the veins.2 Visible veins, tendons, and bones cannot be improved merely by topical agents, chemical peels, lasers, or radiofrequency treatments. Volumetric loss requires replenishment by filler injections or fat grafting. In cases where prominent veins remain apparent following optimum filler volume, sclerotherapy or endovenous laser ablation can be considered as an adjunct, but these treatments are associated with the risk of acute ischemic events and burn injuries.3
The effect of hand volumetric rejuvenation is evident in many studies; however, the optimal target (from the dermis to the DDL) for filler deposition remains inconclusive. Skin thickness decreases as aging progresses due to a decline in collagen and elastin in the dermis and depletion of endogenous hyaluronic acid, and its physiological function is observed in the extracellular matrix of the skin. Intradermal injection of very low G′ fillers, such as Juvéderm Volite (Allergan Inc., Irvine, CA) and Restylane Vital Light (Q-Med AB, Uppsala, Sweden), is suitable for skin boosting and hydration to improve skin elasticity and surface roughness.6,14 However, the skin thickness of the dorsal hand (0.2-0.9 mm) is far less than that of the face (2.0-3.0 mm), making intradermal injection unreliable and possibly resulting in a cobblestone-like appearance.15 Vigorously moulding and massaging after injection, or diluting with collagen stimulators, such as poly-l-lactic acid (Sculptra Aesthetic, Valeant Aesthetics, Bridgewater, NJ), before injection can mitigate surface irregularity. Regarding the subcutaneous tissues, filler injection to the DSL is advocated to avoid injuring the veins, nerves, and tendons located beneath this layer.1,6-9,16,17 The tight adhesions between the dermis and DSF and the very narrow spacing between the 3 laminae make DSL injection somewhat difficult and unpredictable, even with skin tenting.7,8,16 Bruising, swelling, and pain are often secondary to the force of rigorous massage following DSL injection to evenly distribute the injected material, due to compartmentalization of DSL by the spanning fascial septa.16,18 Although the occurrence of unsightly subcutaneous lumps and irregular surfaces following volumetric rejuvenation is rare, it may theoretically be more likely to develop with deposition of filler materials in the DSL. The DIL is the second most optimal injection layer due to the risk of large-sized dorsal venous puncture.17 However, the veins are embedded in different levels of the laminae to form an interconnecting vascular network that is not restricted to the DIL.8 The risk of injuries to the vessels can be reduced by precise injection under real-time imaging guidance, not merely dependent on skin pitching or blind attempts.19 Dorsal veins have an average diameter of 1.27 mm,6 and the risk of venipuncture during filler injections and fat grafting may theoretically be reduced by utilizing a large-gauge cannula, such as 18 or 16 gauge (1.3 and 1.8 mm in external diameter). Massive filler deposition in the DDL is not optimal due to potentially harmful effects on the movement of tendons, unreliable ability to change the outer dorsal appearance of the hand from the deepest location, and unknown longevity within constantly mobile tissues overlying the interosseous muscles and metacarpals.8 In general, some physicians advocate volumetric rejuvenation in all 3 laminae,20 some favor the DSL and DIL,1,9,21 or the DSL and DDL,7 whereas others only focus on the DSL.22-26 Despite the trend of decreasing thickness in the 3 laminae with age, the DIL appears to be the layer where fat loss is the most significant, initiating earliest, after the age of 30 years. Volume correction in the 3 laminae, especially the DIL, may achieve the most aesthetic appearance. Volume expansion in the DIL can also directly compress nearby vessels.
In addition to age, BMI was anecdotally correlated with DSL thickness, with a greater amount of fat in the DSF of cadavers with a BMI >30 kg/m2.18,26 However, a significant impact of BMI on the thicknesses of the 3 dorsal laminae was not observed in this study after multiple linear regression analyses. The impact on the laminae thickness of BMI in the t test (Table 2) may be attributed to more individuals with higher BMI in the older age groups (Table 1). For example, the average age of the underweight group is 34.57 years, and the average age of the obese group is 54 years. Because the dominant hand is mainly responsible for manual labor, accelerated aging is reasonable. However, in our results, the thickness of the fatty laminae was not associated with the appearance of the dominant hand. The hands of men appear more square and muscular with visible outlines of intrinsic hand muscles and tendons, which are possibly associated with less subcutaneous fat.27 Interestingly, the DIL in women was significantly thinner than that in men after multivariate analysis in our study, which may result in greater demand for hand rejuvenation in women.
Investigation of the chronological and structural changes in the dorsal hand cannot keep pace with the rapid development and clinical application of volumetric rejuvenation of the dorsal hand. Most existing studies only describe the gross changes in skin texture and hand volume. Although previous cadaveric studies introduced the concept of 3 dorsal fatty laminae, chronological changes and volume loss pattern have not been demonstrated.
The limitations of this study include a smaller population size as well as a lack of ethnic diversity and individual information about sun-exposure history, smoking and drinking, occupation, and socioeconomic status. The correlation of photodamage degree with aging and hand volumetric fat loss should be investigated in future studies. The measurement of soft tissues other than fat, such as tendons and ligaments, was not assessed. Nevertheless, fat replenishment is the most accessible and common treatment target by filler injection or fat grafting. Finally, ultrasound examination is recommended before volumetric rejuvenation due to a potential difference of anatomic structures between different individuals. Further research is needed to explore the structural and functional changes of aging dorsal hands to optimize rejuvenation treatment.
CONCLUSIONS
This is the first large-scale study to apply multivariate analyses to investigate the pattern of volumetric loss from the dorsal hand. Aging plays a crucial role in the volumetric loss of the 3 dorsal fatty laminae (DSL, DIL, and DDL), with DIL, the thickest fatty lamina, significantly losing the greatest fat content after the age of 30 years. Women, who tend to have a thinner DIL, and individuals aged >30 years are encouraged to seek cosmetic treatment on the dorsum of the hands. Understanding the aging pattern of the dorsal hand is beneficial to correct the signs of aging.
Disclosures
The authors declared no potential conflicts of interest with respect to the research, authorship, and publication of this article.
Funding
The authors received no financial support for the research, authorship, and publication of this article.

