


Abstract
The fundamental tenets of facial aesthetic surgery education have not changed in centuries. Research is beginning to demonstrate that the Neoclassical Canons and the Golden Ratio, Phi, have limited utilization in populations other than those of White European extraction.
The purpose of this study was to analyze comparable raw data in the literature to determine (1) if there is interethnic variability in Neoclassical Canon and Phi measurements, and (2) if the measurements in these representative samples differ from the “ideal.”
A PubMed/Scopus search was performed. Manuscripts with raw data and individuals aged ≥16 were included. Measurements were extracted and employed to calculate the Neoclassical Canons and Phi. One-way analysis of variance (ANOVA) tests were conducted to compare mean measurements across 6 ethnic groups (P < 0.05).
Twenty-seven articles were included. Every continent was represented except Antarctica and Australia. Men were less commonly studied than women. Participant ages ranged from 16 to 56. Averaged Canons 2, 6-8 measurements had significant interethnic differences in males, whereas Canons 5-8 had significant differences across ethnicities in females. For men, there was significant interethnic variability in measurements of Phi 2, 5, 8, 10, and 17. For women, Phi 1, 2, 5, 8, 10, and 17 varied across ethnicities. No ethnic/gender group showed consistent approximation of the “ideal” for both the Neoclassical Canons and Phi.
Today, the utility of the Neoclassical Canons and Phi is limited. It is incumbent on our field to systematically study and define the anthropometric measures that define the “ideal.”
When attempting to define “beauty,” the line between art and science is seldom more blurred.1 In fact, it was the ancient Greeks who first ventured to describe “beauty” as a state of harmony or observed symmetry often found in nature.2 Circa 450 to 420 BC, sculptor Polycleitus took these Grecian concepts one step further, combining them with Egyptian principles to derive 11 facial proportions meant to capture the aesthetic “ideal.” 3 Later, in 90 to 20 BC, Marcus Vitruvius Pollio, a Roman architect and engineer, authored the book entitled De Architectura. His book followed the practices of the Greeks to employ proportions to capture both aesthetics and practicality in his designs.4,5 These historical proportions, termed the Neoclassical Canons, were subsequently propagated by many artists later in history. They became particularly popular among Renaissance painters such as Leonardo Da Vinci, Johann Georg Bergmüller, Albercht Dürer, and Johann Sigismund Elsholtz.6-11
Da Vinci was also instrumental in aiding the development of the concept of the Golden Ratio, or Phi, as he served as illustrator for the mathematics book written by Luca Pacioli. This book, entitled De Divina Proportione, was the first record in history to link the calculation of Phi with facial aesthetics.8,12 The calculations employed within this concept define Phi as the ratio obtained when a line with points A, B, and C is divided, such that AB/AC = BC/AB. These calculations should equal 1.618.7
The Neoclassical Canons and the Golden Ratio, Phi, are historical tools that represent what was once thought to be the “ideal.” Contemporary studies have sought to validate these concepts, attempting to reinforce the utilization of the Canons and Phi in modern aesthetics training. However, many studies have drawn conclusions erroneously or have designs rife with sampling error, exclusively studying faces of White European persuasion.13,14
However, in 1985, a groundbreaking paper published by Farkas et al was the first study to question the application of these historical tools in a diverse population. This paper provided evidence that the application of the Neoclassical Canon paradigm is limited outside of its utilization in a small subset of North American Whites.15,16 This called into question the foundations of aesthetics training and proved that the studies that came before it should be regarded with skepticism. Fang et al then built on the work of Dr Farkas and conducted a systematic review of the literature seeking to describe interethnic variability in facial dimensions. They concluded that, for 11 measurements based on the Neoclassical Canons, there were different levels of interethnic variability. Interethnically, the greatest variability was seen in forehead height, intraocular distance, and nasal width.17 Therefore, these “ideal” values should not be utilized by plastic surgeons to guide aesthetic refinements without first taking into consideration how interethnic variability impacts a particular facial feature. The research put forth by Farkas et al and Fang et al has encouraged many others to question the roots of their aesthetics training regarding the treatment of ethnically diverse populations.
Although subsequent papers have demonstrated a consistent nonadherence to the Neoclassical Canons and/or Phi, there is no standardized approach to the measurements, data collection, or analyses of anthropometric data. The purpose of this study was to critically analyze the comparable raw data found through systematic review of the literature. As a result, we hope to quantify the interethnic variability in the Neoclassical Canon and Phi measurements. We hypothesize that each ethnic group will have different average anthropomorphic measurements and that the facial features of no group, other than the group of Caucasian/European descent, are well approximated by these historical tools.
METHODS
Systematic Review of the Literature and Ideal Measurements
This study was deemed exempt by the institutional review board and thus no consent was needed. PubMed and Scopus searches were performed by N.K. from September to November 2019 according to Preferred Reporting Items for Systematic Review and Meta-Analysis (PRISMA) guidelines utilizing a search string that included the following terms: “vertical and horizontal proportions” or “neoclassical canons” or “golden ratio” or “phi” or “divine proportions” or “anthropometric norms” or “aesthetic analysis” and face (human) (Figure 1). Only manuscripts that included raw data and examined individuals aged 16 years or older were included for statistical analysis. Manuscripts published between 1980 and 2018 were included.
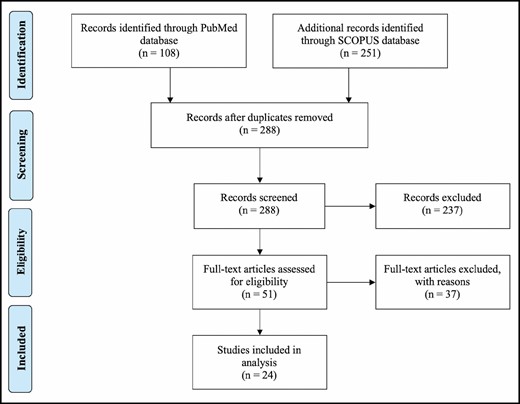
PRISMA flow diagram.
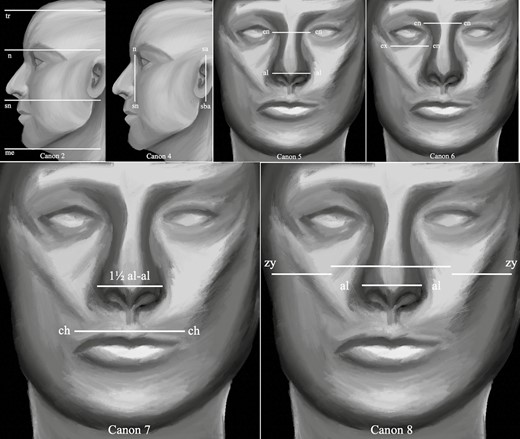
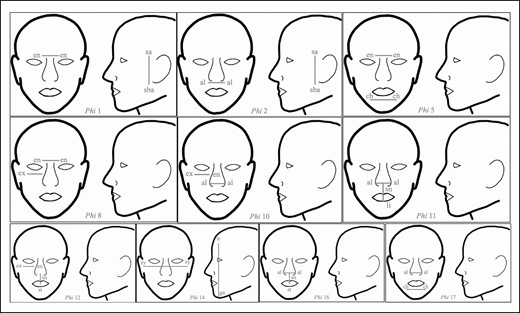
Raw, unprocessed measurements of different anthropometric landmarks were collected by N.K. from each study (Figures 2, 3). Neoclassical Canon measurements included those only made measurable by the raw data (Table 1). This was because the Neoclassical Canons were manipulated by subtracting 1 side of the equation by the other. For example, Canon 4, which states that the length of the ear is equal to the length of the nose, is defined as n-sn = sa-sba. We rewrote this as (n-sn)-(sa-sba) and solved the equation by inserting raw measurements. The ideal should always equal zero, meaning that a negative or positive number represents deviation from the ideal. Phi calculations were based on those most frequently cited in the literature (Schmid) (Table 2).
The Neoclassical Canons
| Canon | Anthropometric proportion |
|---|---|
| 1. The head can be divided into equal halves at a horizontal line through the eyes. | v-en = en-gn |
| 2. The face can be divided into equal thirds, with the nose occupying the middle third. | tr-n = n-sn = sn-gn |
| 3. The head can be divided into equal quarters, with the middle quarters being the forehead and nose, respectively. | v-tr = tr-g = g-sn = sn-gn |
| 4. The length of the ear is equal to the length of the nose. | n-sn = sa-sba |
| 5. The distance between the eyes is equal to the width of the nose. | en-en = al-al |
| 6. The distance between the eyes is equal to the width of each eye (the face width here can be thus divided into equal fifths). | en-en = ex-en |
| 7. The width of the mouth is 1 and one-half times the width of the nose. | ch-ch = 1.5*al-al |
| 8. The width of the nose is one-fourth the width of the face. | al-al = 0.25*zy-zy |
| 9. The nasal bridge inclination is the same as the ear inclination. | nose incl = ear incl |
| 10. The lower face can be divided into equal thirds. | sn-st = st-sl = sl-gn |
| 11. The lower face can be divided into equal quarters. |
Golden Ratio (Phi) Calculations
| Phi Calculations | |
|---|---|
| Φ 1x | Φ 10 |
| Φ 2 | Φ 11 |
| Φ 3 | Φ 12 |
| Φ 4 | Φ 13 |
| Φ 5 | Φ 14 |
| Φ 6 | Φ 15 |
| Φ 7 | Φ 16 |
| Φ 8 | Φ 17 |
| Φ 9 |
| Phi Calculations | |
|---|---|
| Φ 1x | Φ 10 |
| Φ 2 | Φ 11 |
| Φ 3 | Φ 12 |
| Φ 4 | Φ 13 |
| Φ 5 | Φ 14 |
| Φ 6 | Φ 15 |
| Φ 7 | Φ 16 |
| Φ 8 | Φ 17 |
| Φ 9 |
The neoclassical canons.
The golden ratios.
Statistical Analysis
One-way analysis of variance (ANOVA) tests were conducted to compare the mean measurements of the Neoclassical Canons and Phi across 6 independent, ethnic groups. All statistics were performed employing IBM SPSS Statistics for Windows, Version 24 (Armonk, NY, USA). Alpha was set at 0.05.
RESULTS
Included Studies
Two hundred eighty-eight articles were identified utilizing the search string, and title/abstract filtering yielded 51 full-text articles to be reviewed. Of these, 24 articles met the inclusion criteria and were included in the analysis (Table 3). Every continent was represented except for Antarctica and Australia. Men were less commonly studied than women, with an average sample size of 55.6 vs 63.2, respectively. The ages analyzed ranged from 16 to 56 years, with the majority of the cohorts ranging in age from 18 to 30 years.
Characteristics of Studies Included in This Analysis
| Canon measurements included | Phi measurements included | ||||||||||||||||||
|---|---|---|---|---|---|---|---|---|---|---|---|---|---|---|---|---|---|---|---|
| ID | Study | Country of origin | Ethnicity studied | 2 | 4 | 5 | 6 | 7 | 8 | 1 | 2 | 5 | 8 | 10 | 11 | 12 | 14 | 16 | Phi 17 |
| 1 | Lundström et al, 1992 | Canada, USA | White | ✓ | ✓ | ✓ | ✓ | ✓ | ✓ | ✓ | ✓ | ✓ | ✓ | ✓ | ✓ | ✓ | |||
| 2 | Jeffries et al, 1995 | USA | Black | ✓ | ✓ | ✓ | ✓ | ✓ | ✓ | ✓ | ✓ | ✓ | ✓ | ✓ | ✓ | ||||
| 3 | Ferrario et al, 1996 | Italy | White | ✓ | |||||||||||||||
| 4 | Milgrim et al, 1996 | Colombia, Costa Rica, Dominican Republic, Ecuador, El Salvador, Nicaragua, Peru, Puerto Rico, USA, Venezuela, | Hispanic/Latino, Black, White | ✓ | |||||||||||||||
| 5 | Borman et al, 1999 | Turkey | Middle Eastern | ✓ | ✓ | ✓ | ✓ | ✓ | ✓ | ✓ | ✓ | ✓ | ✓ | ✓ | ✓ | ||||
| 6 | Porter and Olson, 2001 | USA | Black | ✓ | ✓ | ✓ | ✓ | ✓ | ✓ | ✓ | ✓ | ✓ | ✓ | ✓ | ✓ | ||||
| 7 | Le et al, 2002 | Canada, Singapore, Thailand, USA, Vietnam | White, Asian | ✓ | ✓ | ✓ | ✓ | ✓ | ✓ | ✓ | ✓ | ✓ | ✓ | ✓ | ✓ | ||||
| 8 | Bozkir et al, 2004 | Turkey | Middle Eastern | ✓ | ✓ | ✓ | ✓ | ✓ | ✓ | ✓ | ✓ | ✓ | ✓ | ✓ | |||||
| 9 | Choe et al, 2004 | Canada, Korea, USA | White, Asian | ✓ | ✓ | ✓ | ✓ | ✓ | ✓ | ✓ | ✓ | ✓ | |||||||
| 10 | Porter 2004 | USA | Black | ✓ | ✓ | ✓ | ✓ | ✓ | ✓ | ✓ | ✓ | ✓ | ✓ | ✓ | ✓ | ||||
| 11 | Farkas et al, 2005 | 26 Countriesa | All except Hispanic/Latino | ✓ | ✓ | ✓ | ✓ | ✓ | ✓ | ✓ | ✓ | ✓ | ✓ | ✓ | ✓ | ✓ | |||
| 12 | Saraswathi 2007 | India | Asian | ✓ | |||||||||||||||
| 13 | Arslan et al, 2008 | Turkey | Middle Eastern | ✓ | ✓ | ✓ | ✓ | ✓ | ✓ | ✓ | ✓ | ✓ | ✓ | ||||||
| 14 | Ngeow et al, 2009 | Malaysia | Asian | ✓ | ✓ | ✓ | ✓ | ✓ | ✓ | ✓ | ✓ | ✓ | ✓ | ✓ | ✓ | ||||
| 15 | Husein et al, 2010 | Canada, USA | White | ✓ | ✓ | ✓ | ✓ | ✓ | ✓ | ✓ | ✓ | ✓ | ✓ | ✓ | ✓ | ✓ | |||
| 16 | Packiriswamy et al, 2012 | India | Asian | ✓ | |||||||||||||||
| 17 | Jayaratne et al, 2013 | Hong Kong | Asian | ✓ | ✓ | ||||||||||||||
| 18 | Al-Sebaei 2015 | Saudi Arabia | Middle Eastern | ✓ | ✓ | ✓ | ✓ | ✓ | ✓ | ||||||||||
| 19 | Alam et al, 2015 | Malaysia | Asian | ✓ | |||||||||||||||
| 20 | Kusugal et al, 2015 | India | Asian | ✓ | ✓ | ✓ | ✓ | ✓ | ✓ | ✓ | ✓ | ✓ | ✓ | ✓ | ✓ | ✓ | ✓ | ✓ | ✓ |
| 21 | Saygili et al, 2016 | Turkey | Middle Eastern | ✓ | ✓ | ✓ | ✓ | ✓ | ✓ | ✓ | ✓ | ✓ | ✓ | ✓ | ✓ | ||||
| 22 | Jang et al, 2017 | Korea | Asian | ✓ | ✓ | ✓ | ✓ | ✓ | ✓ | ✓ | ✓ | ||||||||
| 23 | Ozdemir et al, 2017 | Turkey | Middle Eastern | ✓ | ✓ | ||||||||||||||
| 24 | Olusanya et al, 2018 | Nigeria | Black | ✓ | ✓ | ✓ | ✓ | ✓ | ✓ | ✓ | ✓ | ✓ | ✓ |
aAngola, Azerbaijan, Bulgaria, Canada, Croatia, Czech Republic, Egypt, Germany, Greece, Hungary, India, Iran, Italy, Japan, Poland, Portugal, Russia, Slovakia, Slovenia, Thailand, Tonga, Turkey, Singapore, USA, Vietnam, Zulu.
The Neoclassical Canons
For males representing 6 distinct ethnic groups, Canons 2, 6, 7, and 8 differed significantly. Canon 2, the rule that states that the face can be divided into equal thirds with the nose occupying the middle third, varied between ethnic groups (P = 0.033) and from the ideal value. On average, all male faces had a larger upper face compared with the midface. Likewise, average length of the male lower face was greater than the length of the midface. These values did not closely approximate the ideal, and averaged values differed across all groups (P < 0.001).
Canon 6, the rule that declares that the distance between the eyes should be equal to the width of each eye, differed between all ethnic groups and from the ideal. Whereas White and Middle Eastern eyes were measured to be wider than the distance between the eyes, Black, Asian, and Pacific Islander eyes were found to narrower and/or spaced further apart (P < 0.001).
The rule that states that the width of the mouth is equal to 1.5 times the width of the nose, Canon 7, was not consistent across ethnicities. White, Black, Asian, Pacific Islander, and Middle Eastern mouths were smaller than 1.5 times the width of the nose (P < 0.001). The values did not match the ideal.
Canon 8 states that one-quarter the width of the face equals the width of the nose, which was not observed in any of the raw data analyzed among the various ethnicities. Middle Eastern faces best approximated the ideal, whereas Pacific Islander faces had measurements furthest from the ideal. Notably, 1 consistent finding was that all ethnicities studied had faces narrower than 4 times the width of the nose (P = 0.023) (Table 4).
One-way ANOVA of the Neoclassical Canons
| Neoclassical Canon | White | Black | Asian | Pacific Islander | Middle Eastern | Hispanic, Latino | P |
|---|---|---|---|---|---|---|---|
| Male | |||||||
| Canon 2 | 12.5 ± 6.1 | 16.3 ± 5.0 | 13.6 ± 3.5 | 13.5 ± 0.0 | 6.0 ± 7.9 | — | 0.033 |
| Tr-n = sn-gn | −0.2 ± 5.0 | −3.4 ± 2.5 | −3.5 ± 3.1 | −3.3 ± 0.0 | −5.3 ± 6.4 | — | 0.142 |
| n-sn = sn-gn | −13.7 ± 3.1 | −19.7 ± 5.0 | −17.0 ± 2.3 | −16.8 ± 0.0 | −11.4 ± 3.7 | — | <0.001 |
| Canon 4 | −8.9 ± 2.4 | −7.9 ± 4.0 | −9.9 ± 2.5 | −6.6 ± 0.0 | −6.1 ± 4.3 | — | 0.178 |
| Canon 5 | −4.7 ± 4.3 | −8.7 ± 1.9 | −4.6 ± 4.0 | −9.2 ± 0.0 | −4.3 ± 2.7 | — | 0.138 |
| Canon 6 | −1.8 ± 3.1 | 2.5 ± 2.8 | 6.0 ± 4.2 | 6.8 ± 0.0 | −1.5 ± 4.0 | — | <0.001 |
| Canon 7 | −2.2 ± 6.7 | −10.1 ± 2.9 | −10.7 ± 2.3 | −12.8 ± 0.0 | −2.2 ± 2.3 | — | <0.001 |
| Canon 8 | 2.0 ± 4.8 | 9.6 ± 2.3 | 9.3 ± 11.0 | 10.7 ± 0.0 | 0.4 ± 2.1 | — | 0.023 |
| Female | |||||||
| Canon 2 | 11.8 ± 5.5 | 13.5 ± 9.1 | 14.7 ± 4.8 | — | 7.7 ± 7.6 | — | 0.207 |
| Tr-n = sn-gn | 1.7 ± 4.6 | 0.4 ± 3.2 | 4.9 ± 6.0 | — | −1.4 ± 5.4 | — | 0.115 |
| n-sn = sn-gn | −11.1 ± 3.4 | −15.8 ± 6.7 | −9.8 ± 5.9 | — | −9.3 ± 3.4 | — | 0.092 |
| Canon 4 | −7.4 ± 3.1 | −8.2 ± 1.1 | −7.4 ± 4.8 | — | −6.6 ± 3.7 | — | 0.921 |
| Canon 5 | −1.8 ± 1.7 | −5.1 ± 1.2 | −2.6 ± 2.1 | — | −2.1 ± 2.6 | −4.0 ± 2.8 | 0.022 |
| Canon 6 | −2.3 ± 2.9 | 3.0 ± 4.5 | 4.4 ± 5.1 | — | −0.2 ± 2.2 | — | <0.001 |
| Canon 7 | 0.6 ± 2.3 | −6.0 ± 1.4 | −7.2 ± 4.1 | — | −0.8 ± 2.2 | — | <0.001 |
| Canon 8 | −0.4 ± 1.4 | 6.9 ± 1.9 | 2.8 ± 1.8 | — | −1.1 ± 1.4 | — | <0.001 |
For females representing the 6 ethnic categories, measurements for Neoclassical Canons 5, 6, 7, and 8 differed across groups. Canon 5 states that the distance between the eyes is equal to the width of the nose. White, Black, Asian, Middle Eastern, and Hispanic/Latino females had, on average, wider noses than the width between their eyes (P = 0.022).
Canons 6, 7, and 8 also varied across ethnic cohorts (all P < 0.05). With regards to Canon 6, White and Middle Eastern female eyes were found to be wider or spaced closer together, whereas Black and Asian eyes were found to be narrower or spaced further apart. Canon 7 measurements revealed that most ethnicities had noses wider than two-thirds of their mouths. The exception was White female mouths, which were found to be narrower. Finally, analysis of Canon 8 demonstrated that White and Middle Eastern faces were wider than 4 times the width of the nose, whereas Asian and Black faces were narrower. All averaged measurements for Canons 5, 6, 7, and 8 varied from the ideal (Table 4).
The Golden Ratio, Phi
In males, the interethnic differences in average measurements of Phi 2, 5, 8, 10, and 17 (all P < 0.05) were significant across all groups. Phi 2 states that the length of the ear is 1.618 times the width of the nose. White and Middle Eastern noses are narrower, and Black, Asian, and Pacific Islander noses are wider in relation to this proportion. Phi 5 indicates that the distance between the mouth should be 1.618 times the distance between the eyes. White eyes were spaced closer together, Black and Middle Eastern eyes represented the ideal, and Asian and Pacific Islander eyes were further apart. Phi 8 says that the distance between the eyes is equivalent to 1.618 times the width of the eye itself. All ethnicities had eyes that were approximately the same size as the distance between the eyes, making the ratio 1:1. Phi 10 states that the width of the nose equals 1.618 times the width of the eye. Whereas Pacific Islanders’ features closely matched this ideal, other ethnicities’ features varied such that the width of the eye was approximately equal to the width of the nose. Finally, Phi 17 represents the proportion of the width of the mouth equaling 1.618 times the width of the nose. All ethnicities had noses wider than they should be according to this ideal. No group consistently approximated the ideal of 1.618 across all measurements (Table 5).
One-way ANOVA of the Golden Ratio, Phi
| Phi Calculation | White | Black | Asian | Pacific Islander | Middle Eastern | P |
|---|---|---|---|---|---|---|
| Male | ||||||
| Phi 1 | 1.1 ± 0.1 | 1.2 ± 0.1 | 1.1 ± 0.2 | 1.3 ± 0.0 | 1.1 ± 0.1 | 0.434 |
| Phi 2 | 1.8 ± 0.2 | 1.3 ± 0.1 | 1.6 ± 0.1 | 1.3 ± 0.0 | 1.8 ± 0.1 | <0.001 |
| Phi 5 | 1.7 ± 0.1 | 1.6 ± 0.1 | 1.4 ± 0.2 | 1.5 ± 0.0 | 1.6 ± 0.1 | <0.001 |
| Phi 8 | 1.0 ± 0.1 | 1.1 ± 0.1 | 1.2 ± 0.2 | 1.2 ± 0.0 | 1.0 ± 0.1 | <0.001 |
| Phi 10 | 1.1 ± 0.2 | 1.3 ± 0.2 | 1.3 ± 0.1 | 1.6 ± 0.0 | 1.1 ± 0.1 | <0.001 |
| Phi 14 | 1.3 ± 0.1 | 1.4 ± 0.1 | 1.4 ± 0.1 | 1.2 ± 0.0 | 1.3 ± 0.0 | 0.258 |
| Phi 17 | 1.5 ± 0.1 | 1.3 ± 0.1 | 1.2 ± 0.1 | 1.2 ± 0.0 | 1.4 ± 0.1 | <0.001 |
| Female | ||||||
| Phi 1 | 2.0 ± 0.1 | 1.7 ± 0.1 | 1.7 ± 0.2 | — | 2.0 ± 0.2 | <0.001 |
| Phi 2 | 1.8 ± 0.1 | 1.4 ± 0.1 | 1.6 ± 0.1 | — | 1.9 ± 0.1 | <0.001 |
| Phi 5 | 1.6 ± 0.1 | 1.6 ± 0.1 | 1.4 ± 0.1 | — | 1.6 ± 0.1 | <0.001 |
| Phi 8 | 0.9 ± 0.1 | 1.1 ± 0.2 | 1.2 ± 0.2 | — | 1.0 ± 0.1 | <0.001 |
| Phi 10 | 1.0 ± 0.1 | 1.3 ± 0.2 | 1.2 ± 0.1 | — | 1.1 ± 0.1 | <0.001 |
| Phi 11 | 15.7 ± 0.0 | — | 4.4 ± 5.8 | — | — | 0.234 |
| Phi 12 | 1.6 ± 0.0 | — | 1.7 ± 0.2 | — | — | 0.487 |
| Phi 14 | 1.3 ± 0.1 | 1.2 ± 0.3 | 1.4 ± 0.1 | — | 1.3 ± 0.1 | 0.057 |
| Phi 16 | 1.6 ± 0.0 | — | 1.7 ± 0.2 | — | — | 0.487 |
| Phi 17 | 1.5 ± 0.1 | 1.3 ± 0.0 | 1.3 ± 0.1 | — | 1.5 ± 0.1 | <0.001 |
In females, the interethnic differences in average measurements of Phi 1, 2, 5, 8, 10, and 17 (all P < 0.05) were significant across all groups. Phi 1 states that the length of the vertical ear equals 1.618 times the distance between the eyes. All ethnicities had ears longer than 1.618 times the distance between their eyes. Phi 2, as mentioned previously, says that the length of the ear is 1.618 times the width of the nose. Similar to the trend seen in males, White and Middle Eastern noses were narrower than expected and other ethnicities’ noses were wider. Phi 5 indicates that the distance between the mouth should be 1.618 times the distance between the eyes. White, Black, and Middle Eastern proportions reflected the ideal in this scenario, unlike in male faces. Phi 8 says that the distance between the eyes is equivalent to 1.618 times the width of the eye itself. Like male faces, the ratio decreased to around 1:1 distance between the eyes to width of the eye itself. Phi 10 claims that the width of the nose equals 1.618 times the width of the eye. Again, this ratio decreased closer to 1:1. Finally, Phi 17 represents the proportion of the width of the mouth equaling 1.618 times the width of the nose. All ethnicities had wider noses than expected. Similar to males, no female group consistently approximated the ideal ratio of 1.618 across all measurements (Table 5).
Discussion
Ancient Greek artists and mathematicians were the first to describe the beauty of the face as the result of harmony between the proportions of the nose, lips, and eyes.18 Since then, the concept of attractiveness being synonymous with close approximation of idealized proportions has formed the pillar of facial aesthetics education.19 The Neoclassical Canons and the Golden Ratio Phi have determined today’s “standards of facial beauty” despite resulting from analysis of only a subset of North American Whites.16
For instance, Dr Stephen Marquardt, creator of the “Phi Mask,” employed the concept of the Golden Ratio into his design.13,20 The “Phi Mask” is a prototypical template that can be overlaid and compared with an individual’s face to highlight deviations from the ideal. Institutions around the world have adopted the utilization of the Phi Mask to both shape surgical decision-making and to objectively determine if the results of a surgery were successful.21 However, Marquardt himself utilized only the faces of White European models as the basis for the Phi Mask’s anchor points. This should limit its applicability both in the male sex and in ethnicities outside of those with White European extraction.20
In an attempt to prove that the Phi Mask may be employed as a universal, objective measurement system for facial beauty, Bashour et al evaluated the utilization of this tool on university students. Students were digitally photographed, and composite images of 2, 4, 8, 16, and 32 faces were created and compared with the Phi Mask. Students and clinic patients were then asked to rate the images based on their attractiveness on a scale of 1 (extremely unattractive) to 10 (extremely attractive). It was found that there was a negative correlation between deviation from the Phi Mask and attractiveness ratings. Thus, closer approximation of the Phi Mask, or of the average, mathematical face was considered the most “beautiful.” 13 However, it is important to note that the conclusion Bashour et al drew that the Phi Mask does represent the ideal is not applicable to the general population because this study was performed exclusively utilizing the faces of White European students.
In another effort to validate these historical tools in facial aesthetics, Schmid et al concluded that 5 Neoclassical Canons had a significant association with attractiveness. Utilizing images with frontal views of Caucasian faces from the Facial Recognition Technology Database along with images of 32 well-known movie personalities, participants were asked to rate the faces based on a scale of 1 to 10 facial attractiveness. The scores given to each image by these 36 participants, students and employees of the University of Nebraska-Lincoln, and the time it took for them to provide a score were inserted into computations to examine their association with the Neoclassical Canons, Phi, and facial symmetry. This study found that the Neoclassical Canons and Phi played a much more important role in attractiveness than other predictive models, such as the concept of symmetry.14 However, the findings from Schmid et al are inherently limited because the authors of the study selected images that were not representative of a larger population.
Beginning around 40 years ago, the principles of the Neoclassical Canons and Phi began to be challenged as preliminary research revealed their limitations in diverse populations.15-17,22-26 The present study contributes to the literature on the interethnic limitations of the Neoclassical Canons and Phi with a raw data systematic review and analysis. Our results show significant variation in these principles across ethnicities compared with the ideal, such that not even modern-day White faces are well approximated by these centuries-old rules. This is likely due to the fact that human genetics have rapidly co-mingled in the 5 centuries since Da Vinci was alive. Our findings are consistent with the findings of Holland et al, in which 3-dimensional computerized images were created from the Phi Mask. Sample faces were then compared with these images to demonstrate how they differed from Marquardt’s mask and therefore how they differed from the Golden Ratio. Holland et al found that not even among individuals of European ancestry did the mask appear to outline the features of any typical woman or man.27 In our increasingly heterogenous world,28 the applications of the Neoclassical Canons and Phi may grow even more antiquated as humans continue to evolve and change.
Our results also show that the Neoclassical Canon and Phi measurements vary significantly among 6 different ethnicities. This contributes to the growing body of work that was seeded by the findings of Farkas et al and Fang et al. These pioneers were the first to conclude that the pillars of facial aesthetics training may not benefit individuals of every race and ethnicity. Following in their footsteps, Saygili et al assessed the validity of 8 Neoclassical Canons in 200 young, healthy Turkish adults. This study found that these ratios are rarely applicable to Turkish adults and that surgeons should consider population specific factors during their surgical and non-surgical treatments.22 Anand et al found no correlation between Phi and the measured proportions taken from 50 females and 50 males from Northern India.23 On comparing the anthropometric measures and application of the Neoclassical Canons in African American males and females compared with their Caucasian counterparts, Porter et al found a number of significant differences between the ethnicities.24,25 Together with these studies, the findings in this paper further illustrate the need for a reliable system that plastic surgeons may utilize to tailor a procedure to the beauty standards of a patient’s ethnic group.17 Whether or not this reliable system will involve Marquardt’s Phi Mask, which he is currently attempting to reconfigure into 3 dimensions, developing a system such as this will allow both the patient and surgeon to experience greater satisfaction with their outcomes.29
Conclusions from this study cannot be made without first discussing its limitations. One limitation comes from the available data, such that population anthropometric studies utilize 2-dimensional measurements to describe 3-dimensional features. This will likely lead to underestimated measurements of facial features. Additionally, included participants were young and all ethnic cohorts were represented by similar age groups. Conclusions from this study do not necessarily apply to both younger and older populations, and aging cannot be discussed as a factor that influences attractiveness in the context of our findings. Regarding these demographics, average participant age could not be reported in this study because only 3 of the included papers documented the mean age of the cohort. The majority of the studies utilized for data extraction reported participants’ ages as minimums and maximums, and thus analyzed ages could only be stated as a range. Moreover, there was significant variability in the collection of anthropometric data, and some studies included very limited measurements of interest (Table 3). This created limitations in our analysis and our ability to generalize interethnic results. Finally, whereas certain countries, and specifically certain ethnic groups, were overrepresented in this study, others were not represented at all. To comprehensively study interethnic variability, efforts should be made to study ethnic groups in all countries.
Conclusions
In the era of evidence-based medicine and with increasing demand across the globe for aesthetics procedures, it is imperative that we make every effort to systematically study and define ideal anthropometric measurements. Through well-designed, multi-disciplinary, multi-center studies with standardized protocols, we may get one step closer to objectively understanding the complexities of “beauty.” The hope is that our results communicate to both surgeons and society alike that there is beauty in all races and ethnicities even when they do not fit with preconceived notions on what is “ideal.” Scientific research should aim to demonstrate that many ethnicities have very different facial features and that every individual can be beautiful without assimilating or adopting a single aesthetic.
Tables 1 to 5 were presented at: Plastic Surgery The Meeting (virtual) in October 2020.
Disclosures
The authors declared no potential conflicts of interest with respect to the research, authorship, and publication of this article.
Funding
The authors received no financial support for the research, authorship, and publication of this article.
References

