


Abstract
To date, studies on periareolar dermis release have recorded the areola sensitivity as a mean. Despite being clinically reported by patients, specific points of the areola may present sensitivities not detected when researchers only consider mean values.
The aim of this study was to determine the pressure sensitivity at specific points of the nipple-areola complex and compare these values with the mean value measured in the areolas of patients undergoing reduction mammaplasty with periareolar dermis release.
This is a prospective, randomized controlled trial of 39 consecutive patients (78 breasts) who underwent surgery for treatment of breast hypertrophy; the same surgical technique was used for all patients. In each patient, 1 breast was assigned to a control group and the other to an experimental group. The periareolar dermis release was performed in the experimental group (39 breasts). Pressure sensitivity was tested with Semmes-Weinstein monofilaments on the papilla and at 4 specific points of the areola. The evaluations were conducted preoperatively and at 3 weeks, 6 weeks, and 1 year postoperatively.
The group comparisons show a statistically significant difference in sensitivity at the medial point of the areola and in the papilla at 3 weeks postoperation. This difference disappeared in the 1-year evaluation. This recovery profile also occurs when areola sensitivity corresponds to a mean value. The sensitivity significantly decreased at the lower point of the areola up to 1 year postoperation in the control and experimental groups.
The periareolar dermis release did not compromise the pressure sensitivity at the points evaluated in the nipple-areola complex. The mean areola sensitivity differed from the sensitivity at the lower point of the areola.

Reduction mammaplasty is one of the most common procedures in plastic surgery.1 Patients with breast hypertrophy and ptosis may suffer from physical and emotional disorders. The main complaints are back pain, difficulty with practicing physical activities, and limited choice of clothing. Embarrassment over their condition may affect their social life and cause low self-esteem.2-4
The first reports of breast reduction date from 625 AD, when Paulus of Aegina removed excess tissue through the mammary fold.5 Several reduction mammaplasty techniques have been developed over the past century to improve the aesthetics of breasts by achieving the smallest scar possible, the best shape, and lasting results while maintaining the vascular nutrition of the tissues.5-12 Schwarzmann promoted an important advance in surgical technique in 1930 when he introduced the concept of de-epithelization of the nipple-areola complex (NAC) with the aim of achieving better vascularization.5 As important as the final aesthetic appearance, the maintenance and, if possible, the improvement of sensitivity began to arouse interest and several relevant studies have been published on this topic.3,13-16
The supply of sensitivity and the nerve pathways to the NAC have been a topic of discussion in the specialized literature.13-16 Most studies converge on the fourth intercostal nerve as being principally responsible for NAC innervation, not only for the lateral division of the anterior cutaneous branch, but also for the anterior division of the lateral cutaneous branch.3,13-16 Regarding the rest of the skin lining the breast, studies report that innervation comes from the lateral and medial branches of the second to sixth intercostal nerves and from the supraclavicular cutaneous branches in the upper part of the breast.3,13-16
Studies on periareolar dermis release have shown the effectiveness of this technique for promoting greater NAC mobility without impairing vascular viability.17-20 Regarding sensitivity, there is no damage to a specific nerve because the innervation distributes in a subdermal plane and randomly around the NAC.17-20 de Sá et al reported recovery of sensitivity of the nipple and areola of patients at 1 year after periareolar dermis release.19 Despite these findings, clinical follow-up shows that some patients complain of altered sensitivity in parts of the areola, especially in the lower half, at 1 year after surgery. de Sá et al only reported how the sensitivity evolved in the areola as a whole and not at specific points.19 In view of the contrast between clinical signs and scientific reports, it is likely that the clinical manifestation of sensitivity at a given point may differ from a mean value that represents the entire areola.
This study analyzes whether periareolar dermis release causes pressure sensitivity changes in the nipple and areola at specific points in patients undergoing reduction mammaplasty. Regarding the recovery of sensitivity, this study also assesses whether the mean value of sensitivity in the areola accurately represents the individual values from specific points.
METHODS
This is a prospective, randomized controlled trial conducted in a single health center between August 2013 and August 2015. The study was previously approved by the Ethics Committee of the Federal University of Pernambuco (UFPE) (CAAE number 05351312.3.0000.5208, Clinical Trials registry number NCT 01789450 [ClinicalTrials.gov]). All ethical guidelines of the Declaration of Helsinki were strictly followed. Informed consent was obtained from all patients involved.
Patients underwent general anesthesia and were operated on by the same surgeon in charge of the research. The surgical technique of dermofatty pedicle flaps with an upper base was applied to all patients to ensure viability of the NAC. The resection was at the bottom and keel-shaped portion of the central part of the breast. The final scar in all patients was an inverted T shape.7
This research included 39 patients (78 breasts) complaining of breast hypertrophy from the plastic surgery outpatient clinic of the Hospital das Clínicas, Federal University of Pernambuco, Brazil. The patients included in the study were aged between 21 and 50 years. They had a BMI of 19 to 30 kg/m2 and were not postmenopausal. Patients presenting with severe anemia, neurologic, cardiovascular, metabolic (ie, diabetes mellitus), autoimmune or collagen diseases, menopause, psychological disorders (evaluated by the MiniMental test) and patients who had previously undergone breast surgery, had given birth or had been breastfeeding for less than 1 year were excluded from the study. Because the dermis release technique is still an experimental procedure, we restricted ourselves to studying only 39 patients because this was the number of patients the Ethics Committee of our institution approved.
Pressure sensitivity was tested at 5 points of the NAC with Semmes-Weinstein monofilaments21 (INPI.7.102.105; Sorri-Bauru, Bauru, Brazil,). All patients were submitted to evaluation on 4 different occasions: preoperative (occasion 1), 3 weeks postoperative (occasion 2), 6 weeks postoperative (occasion 3), and 1 year postoperative (occasion 4). The points were evaluated at the following sites: papilla, medial areola, upper areola, lateral areola, and lower areola. Monofilaments of increasing strength were tested at each point until the patient reported a touch. Each point was evaluated 5 times. Maximum and minimum values were neglected. The final value of each point was calculated as the arithmetic mean of 3 intermediate values. The points tested were those in the transition between the areola and the surrounding mammary skin in a quarter-hour configuration (Figure 1). The arithmetic mean of values recorded in the 4 points was calculated to obtain a single representative value for the areola. The follow-up lasted 12 months. In that 12-month period, we lost 2 patients to follow-up, and these were therefore not counted in the final statistics. No additional measures were performed to increase adherence to follow-up.
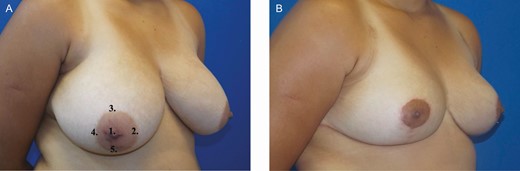
The right nipple-areola complex of a 22-year-old female. (A) Site of sensitivity assessment and the respective points. (B) Final aspect 1 year postoperative.
In each patient, 1 breast was from the control group and the other from the experimental group. A table numbered from 1 to 39 was prepared with the entry number of each patient in the study. The terms “right breast” and “left breast” were placed next to the numbers. For randomization purposes, the letter A corresponded to the control breast and the letter B to the experimental breast. This data arrangement was transferred to a computer and a list from 1 to 39 was generated with Random.Org software by placing the letters A or B randomly at the location corresponding to the right and left breast. Thus, breasts were randomly allocated to either the control or the experimental group.
The experimental group consisted of 39 breasts that underwent periareolar dermis release, and the control group consisted of 39 breasts that did not undergo this procedure.
Pre- and postoperative examinations of NAC sensitivity were performed by the same independent researcher, who was blind to the groups. The surgeon in charge of the research only had access to the results on the sensitivity of the NAC at the end of the research, after all patients had been evaluated. The “blind” researcher in this study was responsible for assessing the sensitivity of NAC on the pre- and postoperative occasions. The reason for designating a “blind” researcher was to avoid any bias in data collection. The team in charge of the surgery and monitoring each patient was responsible for all medical support in the postoperative period. The team itself was not “blind,” but it did not perform any sensitivity assessment of patients.
De-epithelization was performed prior to the operation in a site previously delimited by a surgical mark.7 The periareolar dermis release was performed about 0.5 cm parallel to the cranial margin of the upper limit of the de-epidermized area. The dermis was incised through all its thickness, preserving the integrity of the subdermal vessels (Figure 2).
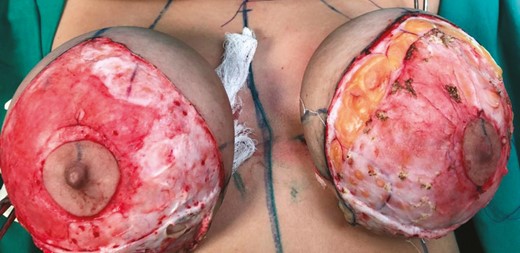
Section of the periareolar dermis of a 22-year-old female with preservation of subdermal vessels. Comparison between the intraoperative aspect of the control (right breast) and experimental (left breast) groups.
Statistical Analysis
Values recorded for areola and papilla sensitivity between groups at each time, and between times for each group were compared by fitting logistic regression models for which the parameters were estimated with generalized estimation equations. The generalized estimation equation method considers a possible correlation of observations over time. Thus, it provides a correct estimate for standard errors of parameter estimates that were used in Wald tests for comparisons of areola and papilla sensitivity. In all tests, the significance level was 0.05. All statistical analyses were performed with the software Stata 12.1 SE (StataCorp, College Station, TX). The Semmes-Weinstein monofilaments were applied, and the results were interpreted according to the following criteria:
Semmes-Weinstein monofilaments, although extremely accessible, are represented by values with a very wide variation, from 0.05 to 300 gF.
For purposes of statistical analysis, the response variable for sensitivity in this study was “yes” or “no.”
Therefore, patients who responded positively only to the magenta filament (300 gF) were considered as a “no” to sensitivity. Patients with a positive response to sensitivity for green to orange monofilaments (from 0.05 to 10 gF) were considered as a “yes” to sensitivity.
Thus, the values showed in the tables are percentages of the presence of sensitivity.
RESULTS
A total of 39 patients (78 breasts) were studied. Surgical wound dehiscence (9 cases), at the intersection of the vertical and horizontal scars, was the most common complication. The youngest patient was 21 and the oldest was 50 years. The average age of the participants was 35.5 years. The patients’ mean BMI was 26 kg/m2 (range, 22.5-29.5 kg/m2). The smallest mass removed from each breast was 50 g and the largest was 1.275 g. The mean mass removed from each breast was 662.5 g. Systemic arterial hypertension (5 cases) was the most observed comorbidity among patients who underwent surgery. The follow-up was 12 months. Patients who missed follow-up sessions were excluded from the final analysis (n = 41). There were no cases of partial or total necrosis of areolas.
Papilla Sensitivity Analysis—Point 1
Preoperative sensitivity did not differ significantly from those at postoperative occasions in the control group (P = 0.237; Wald test).
Sensitivity was significantly lower on occasion 2 (3 weeks postoperative) than on occasion 1 (preoperative, P = 0.022; Wald test) for the experimental group. On the other postoperative occasions, the sensitivity was not significantly different from those on the preoperative occasions (at 6 weeks postoperative: P = 0.661; at 1 year postoperative: P = 0.661; Wald test).
Comparison of control and experimental groups shows a significant difference (P = 0.038; Wald test) only on occasion 2 (3 weeks postoperative). Table 1 shows results for papilla sensitivity.
Percentage of Sensitivity in the Papilla (Point 1) Among Occasions and According to Groups
| Group | Occasion 1 (preoperative) | Occasion 2 (3 weeks) | Occasion 3 (6 weeks) | Occasion 4 (12 months) |
|---|---|---|---|---|
| Control (%) | 94.9 | 89.7 | 82.1 | 92.3 |
| Experimental (%) | 94.9 | 71.8 | 92.3 | 92.3 |
| Group | Occasion 1 (preoperative) | Occasion 2 (3 weeks) | Occasion 3 (6 weeks) | Occasion 4 (12 months) |
|---|---|---|---|---|
| Control (%) | 94.9 | 89.7 | 82.1 | 92.3 |
| Experimental (%) | 94.9 | 71.8 | 92.3 | 92.3 |
Medial Areola Sensitivity Analysis—Point 2
In the control group, the sensitivity at point 2 on postoperative occasions did not differ significantly from those on preoperative occasions (P = 0.250; Wald test). In the experimental group, the sensitivity on occasion 2 (3 weeks postoperative) was significantly lower than that on occasion 1 (preoperative, P = 0.003; Wald test). However, the sensitivity on the other preoperative occasions was not significantly different from the those on postoperative occasions (at 6 weeks postoperative: P = 0.427; at 1 year postoperative: P = 0.275; Wald test). The comparison between the control and experimental groups shows that only occasion 2 (3 weeks after surgery) has differed significantly (P = 0.010; Wald test). Table 2 shows results for sensitivity of medial areola.
Percentage of Sensitivity on Point 2 (Medial) Among Occasions and According to Groups
| Group | Occasion 1 (preoperative) | Occasion 2 (3 weeks) | Occasion 3 (6 weeks) | Occasion 4 (12 months) |
|---|---|---|---|---|
| Control (%) | 97.4 | 84.6 | 92.3 | 89.7 |
| Experimental (%) | 94.9 | 64.1 | 89.7 | 87.2 |
| Group | Occasion 1 (preoperative) | Occasion 2 (3 weeks) | Occasion 3 (6 weeks) | Occasion 4 (12 months) |
|---|---|---|---|---|
| Control (%) | 97.4 | 84.6 | 92.3 | 89.7 |
| Experimental (%) | 94.9 | 64.1 | 89.7 | 87.2 |
Upper Areola Sensitivity Analysis—Point 3
In the control group, the sensitivity on occasion 2 (3 weeks postoperative) was significantly lower than that on occasion 1 (preoperative, P = 0.009; Wald test). However, on the other postoperative occasions, the sensitivity was not significantly different from those on preoperative occasions (at 6 weeks postoperative: P = 0.490; at 1 year postoperative: P = 0.191; Wald test).
In the experimental group, the sensitivity on occasion 2 (3 weeks postoperative) was also significantly lower than that on occasion 1 (preoperative, P = 0.003; Wald test). However, on the other postoperative occasions, the sensitivity was also not significantly different from the those on preoperative occasions (at 6 weeks postoperative: P = 0.479; at 1 year postoperative: P = 0.476; Wald test).
The comparison between the control and experimental groups shows no statistically significant difference in sensitivity on any pair of occasions (P = 0.428; Wald test). Table 3 shows results for sensitivity of upper areola.
Percentage of Sensitivity on Point 3 (Upper) Among Occasions and According to Groups
| Group | Occasion 1 (preoperative) | Occasion 2 (3 weeks) | Occasion 3 (6 weeks) | Occasion 4 (12 months) |
|---|---|---|---|---|
| Control (%) | 100.0 | 84.6 | 94.9 | 92.3 |
| Experimental (%) | 97.4 | 76.9 | 92.3 | 92.3 |
| Group | Occasion 1 (preoperative) | Occasion 2 (3 weeks) | Occasion 3 (6 weeks) | Occasion 4 (12 months) |
|---|---|---|---|---|
| Control (%) | 100.0 | 84.6 | 94.9 | 92.3 |
| Experimental (%) | 97.4 | 76.9 | 92.3 | 92.3 |
Lateral Areola Sensitivity Analysis—Point 4
In the control group, the sensitivity on occasion 2 (3 weeks postoperative) was significantly lower than that on occasion 1 (preoperative, P = 0.005; Wald test). However, on the other postoperative occasions, the sensitivity was not significantly different from the those on preoperative occasions (at 6 weeks postoperative: P = 0.115; at 1 year postoperative: P = 0.116; Wald test).
In the experimental group, the sensitivity on occasion 2 (3 weeks postoperative) was significantly lower than that on occasion 1 (preoperative, P = 0.004; Wald test). However, on the other postoperative occasions, the sensitivity was not significantly different from the those on preoperative occasions (at 6 weeks postoperative: P = 0.096; at 1 year postoperative: P = 0.220; Wald test).
The comparison between the control and experimental groups shows no statistically significant difference in sensitivity on any pair of occasions (P = 0.817; Wald test). Table 4 shows results for sensitivity of lateral areola.
Percentage of Sensitivity on Point 4 (Lateral) Among Occasions and According to Groups
| Group | Occasion 1 (preoperative) | Occasion 2 (3 weeks) | Occasion 3 (6 weeks) | Occasion 4 (12 months) |
|---|---|---|---|---|
| Control (%) | 94.9 | 66.7 | 82.1 | 84.6 |
| Experimental (%) | 92.3 | 61.5 | 76.9 | 82.1 |
| Group | Occasion 1 (preoperative) | Occasion 2 (3 weeks) | Occasion 3 (6 weeks) | Occasion 4 (12 months) |
|---|---|---|---|---|
| Control (%) | 94.9 | 66.7 | 82.1 | 84.6 |
| Experimental (%) | 92.3 | 61.5 | 76.9 | 82.1 |
Lower Areola Sensitivity Analysis—Point 5
In the control group, the sensitivity on occasion 1 (preoperative) was significantly higher than those on each postoperative occasion: preoperative vs 3 weeks postoperative (P < 0.001; Wald test), preoperative vs 6 weeks postoperative (P = 0.002; Wald test), preoperative vs 1 year postoperative (P = 0.017; Wald test).
In the experimental group, sensitivity values were very close to those observed in the control group, making the analysis virtually the same. The sensitivity on occasion 1 (preoperative) was significantly higher than that on each postoperative occasion: preoperative vs three weeks postoperative (P < 0.001; Wald test), preoperative vs 6 weeks postoperative (P = 0.002; Wald test), preoperative vs 1 year postoperative (P = 0.017; Wald test).
The comparison between the control and experimental groups shows no statistically significant difference in sensitivity on any pair of occasions (P = 0.845; Wald test). Table 5 shows results for sensitivity of lower areola.
Percentage of Sensitivity on Point 5 (Lower) Among Occasions and According to Groups
| Group | Occasion 1 (preoperative) | Occasion 2 (3 weeks) | Occasion 3 (6 weeks) | Occasion 4 (12 months) |
|---|---|---|---|---|
| Control (%) | 94.9 | 46.2 | 66.7 | 79.5 |
| Experimental (%) | 94.9 | 41.0 | 61.5 | 74.4 |
| Group | Occasion 1 (preoperative) | Occasion 2 (3 weeks) | Occasion 3 (6 weeks) | Occasion 4 (12 months) |
|---|---|---|---|---|
| Control (%) | 94.9 | 46.2 | 66.7 | 79.5 |
| Experimental (%) | 94.9 | 41.0 | 61.5 | 74.4 |
Areola Sensitivity Analysis—Mean Value
The sensitivity percentage as a mean value did not show any statistically significant difference between any occasions in the control group and in the experimental group (P = 0.310; Wald test). There was also no statistically significant difference between the control and experimental groups on any occasion (P = 0.666; Wald test). Table 6 shows results for areola sensitivity as a mean value.
Percentage of Sensitivity in the Areola Between Occasions and According to Groups Represented by a Mean Value
| Group | Occasion 1 (preoperative) | Occasion 2 (3 weeks) | Occasion 3 (6 weeks) | Occasion 4 (12 months) |
|---|---|---|---|---|
| Control (%) | 100.0 | 94.9 | 97.4 | 97.4 |
| Experimental (%) | 94.9 | 89.7 | 97.4 | 97.4 |
| Group | Occasion 1 (preoperative) | Occasion 2 (3 weeks) | Occasion 3 (6 weeks) | Occasion 4 (12 months) |
|---|---|---|---|---|
| Control (%) | 100.0 | 94.9 | 97.4 | 97.4 |
| Experimental (%) | 94.9 | 89.7 | 97.4 | 97.4 |
Discussion
Breast reduction surgery has followed the history of plastic surgery over the years. Initially proposed for the relief of symptoms of physical pain, it is currently performed also for personal satisfaction of patients regardless of the amount to be removed from the breast. Such popularization of breast reduction surgery became possible not only due to the evolution of surgical techniques, anesthesia, and better control and understanding of main complications, but also due to the increased number of plastic surgeons and reduced costs involved in this surgery.
In the past century, a large number of researchers have been creative in developing surgical techniques that offer a good shape, a smaller scar, the preservation of sensitivity, and lasting results from breast reduction surgery.5-12 Currently, good results can be achieved with several surgical techniques. However, this fact strengthens the hypothesis that a good result depends on factors such as the quality of the tissues the surgeon is working with, but mainly on the surgeon’s experience with a particular surgical technique.
Despite the familiarity with a surgical technique, the surgeon faces challenges. The performance of certain maneuvers facilitates and favorably impacts the outcome of surgery. Experience with a surgical technique does not mean repeating the same technique for years. It rather means developing one’s own means to be able to overcome obstacles resulting from the use of that technique. This study does not aim to present a new technique, but rather an easy-to-perform surgical maneuver, which is fast and safe and aids the surgeon in the performance of the chosen technique.
Some studies have been published on the dermal release maneuver, relating it to histology, volume of breast removed, preservation of sensitivity, safety of the NAC, and correction of breast ptosis.17-20 de Sá et al presented the results of NAC sensitivity in terms of the arithmetic mean of values obtained at specific points of the areola.19 This study differs from those above because, instead of assessing the NAC sensitivity as a whole, it analyzes in detail what happens to the sensitivity in each areola quadrant. This allowed us to reveal a different dataset, not detected in previous studies.
The total number of complications was 25.6%, contrasting with Pitanguy et al who reported a 17.7% complication rate.7 This study has considered immediate complications (2 cases of epidermolysis and 5 cases of dehiscence) and these were solved at 2 weeks after conservative treatment. These cases accounted for 28% of all complications in this study. All cases were solved in outpatient follow-up sessions without recourse to surgery. Two cases of epidermolysis diagnosed 5 days after surgery were observed, 1 in each group. Both cases showed complete recovery by Day 12 of postoperative care. Tissue tension due to edemas surrounding the NAC could have been the principal cause, even in the group where the dermis was freed. There were 3 cases of hematoma, 2 in the experimental group diagnosed by clinical examination on Day 5 of postoperative care. The diagnosis was confirmed by puncture, which also served as treatment in the 3 cases. As originally suggested by de Sá et al, 3 factors are credited with the fact that there was no case of total or partial necrosis of the areola: maintenance of a layer at least 2 cm below the NAC, release of tension on the NAC achieved through the periareolar dermis section, and the careful preservation of the subdermal plexus.19
Papilla Sensitivity—Point 1
The control group had its sensitivity value decreased on occasion 3, although not significantly. In the experimental group, on occasion 2, the sensitivity value decreased significantly. However, there was recovery of sensitivity values over time to the point of almost returning to the preoperative conditions in 1 year. In the evaluation between groups, there is a significant difference only on occasion 2, which disappears after the third week. One year after the operation, the values are exactly the same for both groups. According to the data, the performance of the dermal release maneuver does not compromise papilla sensitivity.
Medial Areola Sensitivity—Point 2
The sensitivity value decreased on occasion 2 of the control group, although not significantly. On the other hand, sensitivity decrease on occasion 2 was significant in the experimental group. There was recovery over time, and the difference no longer existed on occasion 3. Regarding the groups, the significant difference on occasion 2 disappears in the next assessment. Therefore, according to these data, the dermal release maneuver does not compromise medial areola sensitivity.
Upper Areola Sensitivity—Point 3
When analyzing control and experimental groups separately, sensitivity significantly decreases on occasion 2. These differences disappear in the following assessments of both groups. The comparison of sensitivity between groups shows no significant difference at any time. The dermal release maneuver does not interfere with the upper areola sensitivity.
Lateral Areola Sensitivity—Point 4
The results of statistical analysis of sensitivity values in the lateral areola are similar to those in the upper areola. There was also similarity in the separate analysis of groups and in the comparison between them. Therefore, the dermal release maneuver also does not interfere with lateral areola sensitivity.
Lower Areola Sensitivity—Point 5
The evaluation of sensitivity behavior at this point differs from all the other points evaluated. There is a statistically significant difference between preoperative values and all postoperative values, including at the 1-year evaluation. This finding is observed in the control and experimental groups. As for the analysis comparing the 2 groups, there was never a statistically significant difference. Therefore, because there is no difference between the groups, the dermal release maneuver does not interfere with lower areola sensitivity.
Areola Sensitivity Represented by a Mean Value
In this case, the areola sensitivity corresponds to a single value calculated as the arithmetic mean of 4 values at medial, upper, lateral, and lower points of the areola. There is a decreased sensitivity value on occasion 2 in both groups, although this is not statistically significant. The sensitivity recovered on occasions 3 and 4, where the values were close to those recorded on preoperative occasion. The comparison between groups showed no significant differences at any occasions. Even when the areola corresponded to a mean value, the periareolar dermis release did not interfere with sensitivity.
The recovery of sensitivity at the lower point of the areola differed from that at the other points evaluated, and from that when sensitivity corresponded to a mean value. This is because there was no recovery of sensitivity at this point, specifically, over 1 year of evaluation. These results were observed for the control and experimental groups. This finding may explain why some patients complain of decreased sensitivity in the lower part of the areola. However, the study of de Sá et al reported complete recovery of sensitivity at 1 year after surgery.19 This occurs when the sensitivity value at a given point can be “diluted” by values recorded in other sites. This is probably the reason why the mean value does not express what the patient clinically manifests at the lower point of the areola.
The significantly low sensitivity scores at the lower point of the areola at 1 year after evaluation are attributed to the surgical technique used and not to the periareolar dermis release. This is because both groups were affected. However, further studies are needed to prove this finding. With a longer evaluation, a complete recovery of sensitivity may occur at all points analyzed. This information can better inform patients about the time to recover NAC sensitivity after undergoing the surgical technique described here.
Comments
In this work we used a set of 6 Semmes-Weinstein monofilaments (0.05, 0.2, 2.0, 4.0, 10, 300 gf). Bearing in mind that these values are very different and do not have a normal or approximate normal distribution, we chose to classify the presence of sensitivity by 2 categories (yes/no). We consider the use of Student’s t test to be questionable for comparing these scores. Olaiya et al chose a similar procedure to study peripheral neuropathy (PN) with 3 graded Semmes-Weinstein monofilaments and defining 4 PN levels: 0 (no PN; felt all 3 filaments), 1 (subclinical PN; insensate to 1-g filament), 2 (insensate to 10-g filament), or 3 (insensate to 75-g filament). Levels 2 to 3 were considered as clinical PN. Associations with PN were determined by ordinal logistic regression.
It is worth mentioning that few studies on periareolar dermis release have been reported. This limited data comparison between our study and those of other authors. It would also be interesting to use the dermis release along with other surgical techniques to compare the safety and effectiveness of this procedure with other techniques as well.
We highlight some limitations in this study, such as the low number of participants and the short period (1 year of assessment). The specimens of Semmes-Weinstein monofilaments present a wide range of force variation (0.02-300 gf), whose consideration as a quantitative variable could lead to biased results. Therefore, the analysis of sensitivity as a qualitative and not a quantitative variable is another issue to be considered.
Conclusions
Periareolar dermis release does not interfere with pressure sensitivity at the points tested in the NAC. At its lower point, the areola’s sensitivity differed significantly from its mean value.
Disclosures
The authors declared no potential conflicts of interest with respect to the research, authorship, and publication of this article.
Funding
The authors received no financial support for the research, authorship, and publication of this article.
References

