


Abstract
Many therapeutic options are currently available for facial skin rejuvenation, but little evidence exists about the efficacy of combining such procedures.
The aim of this study was to assess and investigate the synergistic effect of hyaluronic acid (HA) and autologous platelet-rich plasma (a-PRP) injections on facial skin rejuvenation.
For this randomized controlled prospective study, 93 eligible patients were enrolled and randomized into 3 intervention groups to undergo a series of 3 treatment sessions with either a-PRP, HA, or a mixture of a-PRP and HA (Cellular Matrix; Regen Lab) injected into facial cheeks.
A total of 93 patients were included. Treatment with Cellular Matrix led to a very significant improvement in the overall facial appearance compared with treatment with a-PRP or HA alone (P < 0.0001). Participants treated with Cellular Matrix showed a 20%, 24%, and 17% increase in FACE-Q score at 1, 3, and 6 months posttreatment, respectively. For the HA group, the improvement in FACE-Q score was 12%, 11%, and 6% at 1, 3, and 6 months posttreatment, respectively, whereas for the a-PRP group the improvement was 9%, 11%, and 8% at 1, 3, and 6 months posttreatment, respectively. Biophysical measurements showed significantly improved skin elasticity for the Cellular Matrix group compared with the groups receiving a-PRP or HA alone. No serious adverse events were reported.
Combining a-PRP and HA seems to be a promising treatment for facial rejuvenation with a highly significant improvement in facial appearance and skin elasticity compared with a-PRP or HA alone.

With the aging of the world population, the demand for aesthetic procedures is increasing. Aging of the skin is influenced by both intrinsic factors, such as chronologic age, and by extrinsic factors, such as chronic ultraviolet exposure and smoking. Facial skin aging is clinically associated with a number of features, including changes in skin elasticity and firmness, and reduced hydration.1
Several procedures for the treatment of skin aging are available. Mesotherapy is a minimally invasive medical technique that consists of administering intradermal injections of pharmacologic substances, such as nutrients, vitamins, or enzymes into the region to be treated.2-4 This technique causes the release of growth factors and induces the stimulation and migration of fibroblasts to naturally activate the synthesis of collagen and elastin fibers and new hair. It appears that metalloproteinases, enzymes secreted by the cells into the extracellular space after induction by cytokines and growth factors during wound healing or inflammation, play a role in cell proliferation and thus stimulate angiogenesis.5
Mesotherapy for skin aging has developed over the last decade due to the accelerated growth of cosmetic medical products. It is indicated in both young people for biorevitalization of the skin (skin becomes radiant, wrinkles are reduced, and the skin structure is restored) as well as in older people to restore the elasticity and firmness of the skin.
Hyaluronic acid (HA), one of the main components of the extracellular matrix in humans, stimulates cell signaling and plays an important role in the tissue regeneration process. Decreased HA levels have been shown to correlate with skin aging and photoaging.6,7 Thus, intradermal HA injections have become one of the most popular treatments currently used in aesthetic dermatology for skin rejuvenation.4,8
Studies have shown that an intradermal injection of HA stimulates fibroblast activity and increases water retention in tissues.9,10 Thus, HA stimulation could increase type I collagen expression in fibroblasts.11 Platelet-rich plasma (PRP) has been widely used in various medical fields for many years and has been used in aesthetic medicine since 2006 for skin rejuvenation as well as for correcting facial aging.12-15 Indeed, the principle of PRP therapy is based on its ability to reproduce natural healing and cell regeneration through the sequential release of different growth factors, namely, platelet-derived growth factor, transforming growth factor β, epidermal growth factor, vascular endothelial growth factor, insulin-like growth factor, and basic fibroblast growth factor.16,17 These factors stimulate cell proliferation and differentiation, and angiogenesis, as well as synthesis of a new extracellular matrix. An in vitro study has shown a dose-response relation between platelet concentrations and adult mesenchymal stem cell proliferation, fibroblast proliferation, and type I collagen production.18 An in vivo study on a mouse ultraviolet-induced aging model has shown that wrinkles were significantly reduced in the group treated with PRP compared with the control group. It was also found that the dermal layer was thicker in the PRP group.19
Pilot studies have reported the effect of PRP on facial rejuvenation. The results of a study conducted in 23 patients have shown that PRP injected monthly for 3 months was effective and safe, especially for treating the face and neck areas.13 Moreover, Yuksel et al assessed the effects of PRP on facial skin but only used scales to assess general appearance, wrinkle state, and pigmentation disorder. The results showed that PRP is effective for facial skin rejuvenation.20
In a pilot study,21 we reported preliminary results showing that a combination of autologous PRP (a-PRP) and HA significantly improved the net elasticity of the skin and the overall facial appearance at 6 months compared with baseline as assessed with the FACE-Q scale.22
In this study, we compared 3 treatment groups: a-PRP alone, HA alone, and a combination of a-PRP and HA (Cellular Matrix; Regen Lab SA, Le Mont sur Lausanne, Switzerland). We assessed the efficacy of each product on the firmness and elasticity of skin based on clinical and paraclinical assessments in order to compare the effect of each product and to determine if the use of a-PRP combined with HA has synergistic and additive effects.
METHODS
Ethics Statement
The study was approved by the French health authority (Agence Nationale de Sécurité du Médicament), and ethical approval was obtained from CPP Ile-de-France VI; ID RCB: 2014-A00718-39. This trial was registered in the ClinicalTrials.gov database as NCT02832583.
Study Design
We enrolled 93 patients (31 patients for each treatment group) with Fitzpatrick skin phototypes I to IV. The CONSORT diagram of participant recruitment is shown in Figure 1. The study took place between December 2014 and December 2018. The inclusion criteria were patients aged over 40 years with chronologic aging, characterized by wrinkles, and dull and dry skin with loss of elasticity and firmness. Exclusion criteria were patients who had received treatment for skin rejuvenation in the 6 months prior to the enrollment, patients who had a known hypersensitivity to HA, an active skin disease (eg, infection, eczema), or had any autoimmune disorder or cancer. All patients provided written informed consent, and the ethics committee of Ile de France IV approved the study protocol.
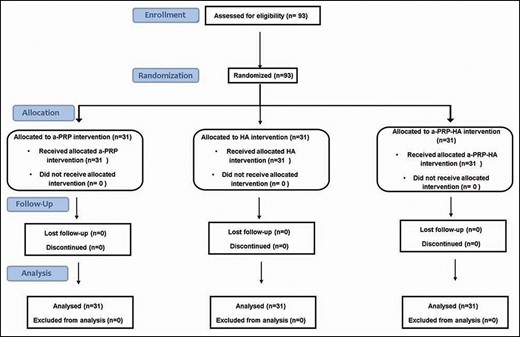
CONSORT diagram of participant recruitment and flow.
Randomization
Randomization was performed by placing treatment group assignments into presealed envelopes. Each patient was randomly assigned to receive 3 applications of 1 type of treatment (a-PRP, HA, or Cellular Matrix) with an interval of 1 month between each application.
Preparation of a-PRP, HA and Cellular Matrix
Preparation of a-PRP
RegenKit-BCT-3 tubes (Regen Lab) were used to collect the blood for a-PRP preparation. We collected 8 mL of blood into each RegenKit-BCT-3 tube, which allowed the preparation of 4.5 mL of PRP after centrifugation (1500g for 5 minutes) (Figure 2A). The average platelet concentration is around 340 to 400 million platelets/mL with an average of 347 million/mL (data on file, Regen Lab). All devices are CE-marked medical devices.
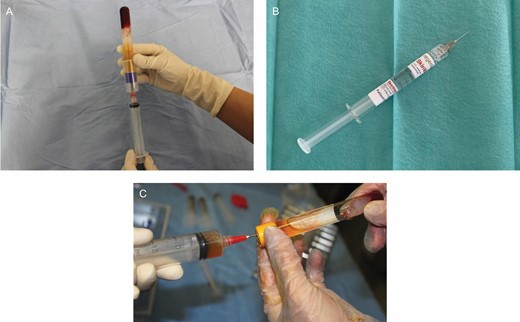
Illustration of different treatments prepared according to the manufacturer’s instructions. (A) a-PRP prepared with RegenKit-BCT-3, (B) SkinVisc (HA), and (C) a-PRP combined with HA prepared with Cellular Matrix BCT-HA. a-PRP, autologous platelet-rich plasma; HA, hyaluronic acid.
HA (SkinVisc)
SkinVisc (Regen Lab) is a sterile and nonpyrogenic formulation of natural, highly concentrated, high-molecular-weight HA from bacterial fermentation in a physiologic phosphate buffer. A 2-mL aliquot contains 40 mg of HA (MW, 1500-2000 kDa) concentrated at 2% in phosphate buffer and water for injection (Figure 2B).
Preparation of Cellular Matrix
The Cellular Matrix BCT-HA device (Regen Lab) comprises sterile and nonpyrogenic tubes and is designed to prepare a mix containing equal amounts of PRP and HA (2 mL of each) within the same tube (40 mg of noncrosslinked natural HA per tube; 1550 kDa HA obtained from bacterial fermentation and concentrated at 2% in phosphate buffer). The peripheral blood was collected into 2 Cellular Matrix tubes; 8 mL of blood was drawn for each donor (4 mL per tube). The a-PRP mixed with 2 mL of HA was collected after centrifugation at 1500g for 5 minutes (Figure 2C).
Injection of Treatment
A topical anesthesia (EMLA cream 5%, AstraZeneca AB, Sodertalje, Sweden) was applied for 30 minutes before injection and then completely removed prior to injection. Mesotherapy was performed in 2 steps. The first step consisted of intradermal injections of 3 mL of the treatment, administered with a 1-mL insulin syringe with a 32-gauge sterilized needle (length, 4 mm) every 5 mm per cheek. The second step consisted of spreading 1 mL of the mixture per cheek according to a grid, followed by intradermal punctures every 1 mm with a 1-mm SkinRoller (Aesthetic Group, Puiseux-le-Hauberger, France).
Each patient was given bilateral injections into the cheeks at 0, 1, and 2 months. During each treatment session, patients received approximately 4 mL of a-PRP, HA, or Cellular Matrix on each cheek.
Clinical Assessment
The main efficacy criterion was overall facial appearance as assessed by FACE-Q questionnaires22 carried out at baseline (before treatment) and at 1, 3, and 6 months after the last injection session.
The secondary criterion was improvement of skin elasticity and firmness as assessed with a Cutometer (MPA 580; Courage+Khazaka electronic GmbH, Cologne, Germany) at preinjection at baseline, and at 1, 3, and 6 months after the last injection session. Safety was assessed through reporting of adverse events.
The FACE-Q and Cutometer results before treatment (baseline) showed no statistical difference between the 3 treatment groups (see Results).
Objective Measurements
Cutometer measurements performed by a blinded assessor were used to evaluate skin elasticity and changes in skin viscoelasticity of the inspected area. A 2-mm-diameter measuring probe was used and a constant suction of 450 mbar for 1 second followed by a relaxation time of 1 second was applied and repeated 3 times. The Cutometer measures the elasticity and viscoelastic proprieties of the skin in vivo based on the principle of suction elongation.
Measurements were made on the right and left cheeks at the same point for each assessment. The mechanical parameters R2, R5, R6, and R7 were subsequently calculated. R2 refers to the gross elasticity of the skin including viscous deformation. R5 refers to the net elasticity without viscous deformation and is represented by the “immediate retraction”/“immediate distention” ratio: R5 = Ur/Ue, where the closer to 1 (100%) the value is, the more elastic the skin is. R6 represents the portion of the viscoelasticity on the elastic part of the curve and is represented by the “viscoelastic”/“elastic distension” ratio: R6 = Uv/Ue. Because R6 measures the stretching capacity of the skin, negative values reflect an improved skin condition. R7 refers to recovery after deformation and corresponds to the portion of elasticity compared with the final distension. It is represented by the “immediate retraction”/“final distension” ratio: R7 = Ur/Uf, where the closer to 1 (100%) the value is, the more elastic the skin is.
Subjective Evaluation
Photography
Standardized digital photographs (taken with a Canon DS126231 camera with a macro lens) were taken at baseline and during each posttreatment visit, and treatment responses were assessed by comparing photographs pretreatment and at 1, 3, and 6 months after 3 sessions of treatment. The photography conditions remained constant throughout the trial.
FACE-Q
Patients were asked to complete a FACE-Q questionnaire to assess their satisfaction with their facial appearance.22 A paper version of the FACE-Q questionnaire was used. The survey was not anonymous. The assessor who distributed the survey was different from the practitioner who performed the injections. Scores were assessed for each domain, with higher scores indicating greater satisfaction with appearance. This scale has been translated into French by the Mapi Research Trust.
Adverse Effects
Adverse events, including bruising and papules, were assessed by questioning patients and observing skin responses.
Follow-Up
Evaluations of skin elasticity, assessment of the response to the treatment (FACE-Q), and digital photography were carried out at baseline and at months 1, 3, and 6.
Statistical Analysis
The measured skin elasticities obtained for the different parameters were analyzed with Prism version 7 (GraphPad, San Diego, CA). Student’s t test was used to compare the mean values at each time point with baseline values. P < 0.05 was considered statistically significant. Analysis of variance with leverage t test, one-tailed paired t test, and multiple linear regression analysis were used to compare data on age, BMI, and skin elasticity parameters. All statistical analyses were performed with JMP 12 software (SAS Institute Inc, Cary, NC).
RESULTS
Clinical and Demographic Data
Ninety-three patients were included and assessed in this comparative clinical study. The mean [standard deviation] follow-up time was 184 [3.4] days (range, 181-190 days).
The clinical demographic characteristics of the study subjects are summarized in Table 1. The mean age of patients in the HA group was 49 [9.5] years (range, 40-64 years) (3 males, 29 females), in the a-PRP group 50 [7.5] years (range, 40-68 years) (1 male, 30 females), and in the Cellular Matrix group 51 [8.5] years (range, 40-69 years) (2 males, 29 females). The mean BMIs for the a-PRP, HA, and Cellular Matrix groups were 23.8 [2.7] kg/m2 (range, 18.5-32.74 kg/m2), 24.2 [3.3] kg/m2 (range, 18.9-33.05 kg/m2), and 24.5 [3.5] kg/m2 (range, 19.15-32.87 kg/m2), respectively (Table 1). The majority of the study subjects had a BMI between 19 and 25 kg/m2 and had Fitzpatrick phototypes of II or III. The mean platelet count of a-PRP group patients was 236.44 [72.77] × 103/mm3 and the mean platelet count of Cellular Matrix group patients was 223.62 [60.03] × 103/mm3. At baseline, the mean FACE-Q scores for the a-PRP, HA, and Cellular Matrix groups were 43.88 [8.0] (range, 23-56), 44.9 [11.6] (range, 18-53), and 44.3 [3.5] (range, 21-61), respectively, and there were no significant differences between the different treatment groups (Table 1). There were also no statistical differences between the treatment groups regarding the skin elasticity parameters (R2, R5, R6, and R7).
Patients’ Demographics and Baseline Clinical Characteristics for Each Treatment Group
| a-PRP | HA | Cellular Matrix | P | |
|---|---|---|---|---|
| Age, years | 50 [7.5] (40-68) | 49 [9.5] (40-64) | 51 [8.5] (40–690 | NS |
| Sex, F:M (%) | 30:1 (97:3) | 28:3 (90:10) | 29:2 (93:7) | |
| BMI, kg/m2 | 23.8 [2.7] (18.5-32.74) | 24.2 [3.3] (18.9-33.05) | 24.5 [3.5] (19.15-32.87) | |
| 19–25 kg/m2 | 25 (81%) | 26 (84%) | 22 (77%) | |
| >25 kg/m2 | 6 (19%) | 5 (16%) | 7 (23%) | |
| Fitzpatrick phototype | ||||
| I | — | 1 (3%) | 1 (3%) | |
| II | 14 (45%) | 11 (35%) | 10 (32%) | |
| III | 12 (39%) | 13 (42%) | 14 (45%) | |
| IV | 4 (13%) | 3 (10% | 4 (13%) | |
| V | 1 (3%) | 3 (10%) | 2 (7%) | |
| Baseline FACE-Q score | 43.88 [1.53] (23-56) | 44.92 [2.12] (18-53) | 44.3 [1.9] (21-61) | NS |
Unless otherwise indicated, values are mean [standard deviation] (range) or n (%). a-PRP, autologous platelet-rich plasma; Cellular Matrix, combination of a-PRP and HA; HA, hyaluronic acid; NS, not significant.
Assessment and Comparison of Overall Facial Appearance With the FACE-Q Scale
Patients were asked to express their opinion by completing the FACE-Q self-questionnaire.
The group that received the Cellular Matrix treatment showed a very significant improvement in overall facial appearance at 1, 3, and 6 months after treatment compared with groups treated with a-PRP or HA alone (P < 0.0001) (Figure 3; Table 2). At 1 month posttreatment, the overall facial appearance was significantly increased in the HA group compared with the a-PRP group (P = 0.005) (Table 2).
Comparison of FACE-Q Score of Different Treatment Groups (a-PRP, HA, and Cellular Matrix) in the Follow-Up
| a-PRP vs HA | a-PRP vs Cellular Matrix | HA vs Cellular Matrix | |
|---|---|---|---|
| 1 month | 0.005** | <0.0001**** | <0.0001**** |
| 3 months | NS | <0.0001**** | <0.0001**** |
| 6 months | NS | <0.0001**** | <0.0001**** |
| a-PRP vs HA | a-PRP vs Cellular Matrix | HA vs Cellular Matrix | |
|---|---|---|---|
| 1 month | 0.005** | <0.0001**** | <0.0001**** |
| 3 months | NS | <0.0001**** | <0.0001**** |
| 6 months | NS | <0.0001**** | <0.0001**** |
P, one-tailed t test. a-PRP, autologous platelet-rich plasma; Cellular Matrix, combination of a-PRP and HA; HA, hyaluronic acid; NS, not significant.
****P < 0.0001; ***P < 0.001; **P < 0.01; *P < 0.05.
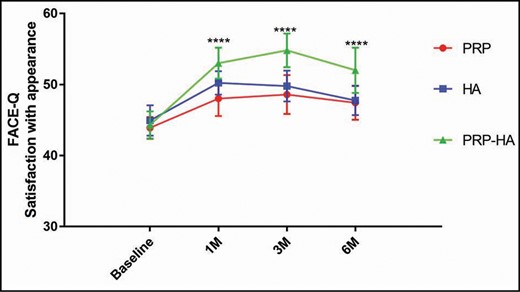
FACE-Q satisfaction score for the overall facial appearance of the 3 treatments (a-PRP, HA, and Cellular Matrix) at baseline, and at 1, 3, and 6 months posttreatment. The group of patients treated with Cellular Matrix showed significant improvement in overall facial appearance (especially in facial radiance and the rested appearance of the face) at 1, 3, and 6 months posttreatment compared with the a-PRP and HA groups. Error bars refer to the standard deviation. a-PRP, autologous platelet-rich plasma; HA, hyaluronic acid.
Examples of participants from each treatment group are shown in Figures 4-6. These photographs were not used to determine the results.
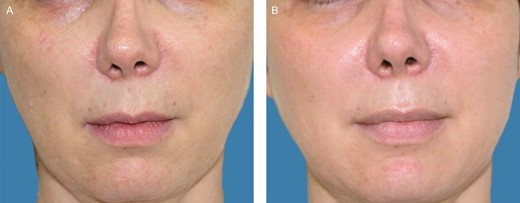
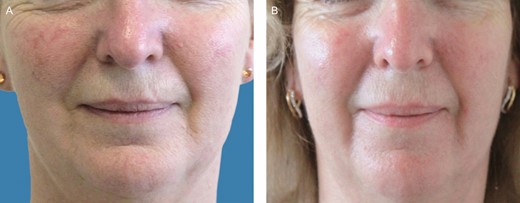
(A) A 47-year-old female patient before treatment with Cellular Matrix. (B) Six months posttreatment.
(A) A 55-year-old female patient before treatment with autologous platelet-rich plasma. (B) Six months posttreatment.
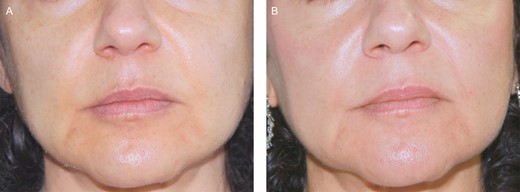
(A) A 51-year-old female patient before treatment with hyaluronic acid. (B) Six months posttreatment.
Participants treated with Cellular Matrix showed a 20%, 24%, and 17% increase in FACE-Q score at 1, 3, and 6 months posttreatment, respectively. For the HA group, the improvement of FACE-Q score was 12%, 11%, and 6% at 1, 3, and 6 months posttreatment, respectively, whereas for the a-PRP group the improvement was 9%, 11%, and 8% at 1, 3, and 6 months posttreatment, respectively (Table 3).
Percentage of Improvement of FACE-Q Score for Each Treatment Group (a-PRP, HA, and Cellular Matrix)
| a-PRP (%) | HA (%) | Cellular Matrix (%) | |
|---|---|---|---|
| 1 month | 9 | 12 | 20 |
| 3 months | 11 | 11 | 24 |
| 6 months | 8 | 6 | 17 |
| a-PRP (%) | HA (%) | Cellular Matrix (%) | |
|---|---|---|---|
| 1 month | 9 | 12 | 20 |
| 3 months | 11 | 11 | 24 |
| 6 months | 8 | 6 | 17 |
a-PRP, autologous platelet-rich plasma; Cellular Matrix, combination of a-PRP and HA; HA, hyaluronic acid.
Biomechanical Assessment of the Skin
The Cutometric parameters of skin elasticity were assessed and are reported in Figure 7. Globally, the gross elasticity R2 was improved at 1, 3, and 6 months for the 3 treatment groups. Although R2 was increased in the group treated with Cellular Matrix compared with both other groups (a-PRP and HA), there was no statistical difference between the 3 groups (Figure 7A). At 3 months posttreatment, a significant improvement of net elasticity R5 was observed for the Cellular Matrix group compared with the a-PRP group (P < 0.001), and compared with patients treated with HA, net elasticity R5 was very significantly improved at 3 and 6 months (P < 0.0001) (Figure 7B).
![Mean values of R2 (gross elasticity) (A), R5 (net elasticity) (B), R6 (viscoelasticity ratio) (C), and R7 (biological elasticity) (D) parameters at baseline and at 1, 3, and 6 months posttreatment. Values are means [standard errors of the mean], two-way analysis of variance.](https://oup.silverchair-cdn.com/oup/backfile/Content_public/Journal/asj/41/7/10.1093_asj_sjab061/3/m_sjab061_fig7.jpeg?Expires=1750181670&Signature=RCMUfjSM8YSS6kFxNjXcphLTPRJz6RHm1QffavNli6PIrEEwlubLI14YvZen-msOp3fGY4WcF~Ac3DGn~fZ8kHgbYLjBJzREIaWA5wHPM-~0lxL5FIpM1LyQeK7vjInTZhK87Ix5L5yCl6yvW23jjR8j~IOdg7S3H4R83r2XO4lx6F~bzWpZAHiy2FuEpJfiCdT4FIY6urMLlBW-2AsIa9vZm-FtK-oKRa6m0599uNqJLIriZAR8y4p82kV1rvSy7~vPpPphFsiNWRVYVgMYFYbQ02LzDNgx5O4eFAFC8sIqjg0tW4mNmC1iA8pAuG2be3Qq9zhRusX8q6tMejIpZA__&Key-Pair-Id=APKAIE5G5CRDK6RD3PGA)
Mean values of R2 (gross elasticity) (A), R5 (net elasticity) (B), R6 (viscoelasticity ratio) (C), and R7 (biological elasticity) (D) parameters at baseline and at 1, 3, and 6 months posttreatment. Values are means [standard errors of the mean], two-way analysis of variance.
A significant decrease of R6 (viscoelastic portion) was observed at 3 months for the Cellular Matrix group compared with the a-PRP group (P < 0.001) (Figure 7C). The decrease in R6 reflected improved skin elasticity (viscoelastic deformation/elastic deformation ratio). Last but not least, the R7 parameter was significantly improved for the group treated with Cellular Matrix compared with a-PRP at 3 months (P = 0.03) (Figure 7D).
There were no statistical differences at any time point between the 3 treatment groups regarding changes in gross elasticity (R2). However, statistically significant differences for net elasticity R5 between the a-PRP group and the Cellular Matrix group (P = 0.0001) and the HA and the Cellular Matrix groups (P < 0.0001) at 3 and 6 months posttreatment were found (Table 4). At 3 and 6 months posttreatment a very significant difference was found between the a-PRP and HA groups vs the Cellular Matrix group (P < 0.0001) (Table 4).
Comparison of Elasticity Parameters (R5, R2, R6, and R7) for Each Group Treatment in the Follow-Up
| R2 | R5 | R6 | R7 | |
|---|---|---|---|---|
| 1 month | ||||
| a-PRP vs HA | NS | NS | P < 0.0001**** | NS |
| a-PRP vs Cellular Matrix | NS | NS | P = 0.0029** | NS |
| HA vs Cellular Matrix | NS | NS | NS | NS |
| 3 months | ||||
| a-PRP vs HA | NS | NS | NS | NS |
| a-PRP vs Cellular Matrix | NS | P = 0.0001*** | P < 0.0001**** | P = 0.03* |
| HA vs Cellular Matrix | NS | P < 0.0001**** | P < 0.0001**** | NS |
| 6 months | ||||
| a-PRP vs HA | NS | NS | NS | NS |
| a-PRP vs Cellular Matrix | NS | NS | P < 0.0001**** | NS |
| HA vs Cellular Matrix | NS | P < 0.0001**** | P < 0.0001**** | NS |
P, one-tailed t test. a-PRP, autologous platelet-rich plasma; Cellular Matrix, combination of a-PRP and HA; HA, hyaluronic acid; NS, not significant.
****P < 0.0001; ***P < 0.001; **P < 0.01; *P < 0.05.
Multiple Variance Analysis of Cutometric Parameters Based on Age and BMI
A multiple variance analysis was used to determine if the treatment effect of Cellular Matrix was correlated with age and BMI. The results of this analysis showed a significant positive correlation between R6 and BMI at 3 months (P = 0.031*, where * denotes P < 0.05): the lower the BMI, the smaller was R6, reflecting an improvement in skin elasticity. The parameter R7 was also significantly positively associated with age 3 months after treatment (P = 0.0437*). For the other skin elasticity parameters (R2, R5), no correlation was observed with age and BMI.
Adverse Events
There was no difference in the occurrence of adverse events between the 3 treatment groups. Immediate or delayed mild bruising occurred in 12 (39%) PRP group participants, in 16 (35%) HA group participants, and in 14 (45%) Cellular Matrix group participants, and lasted on average 4 to 5 days. Bruising only occurred during the first injection session.
DISCUSSION
Tissue regeneration and cell stimulation “tissular induction” are promising noninvasive treatments for facial rejuvenation. Recently, there has been much interest in the use of these new therapies, including tissular bioinductors and a-PRP and HA treatment, which aim to stimulate cell regeneration. Unfortunately, there is a lack of articles with a high level of evidence to demonstrate the true efficacy of these products.
In this comparative clinical study, we assessed the efficacy of a-PRP, HA, and the combination of both (Cellular Matrix) as mesotherapy for facial rejuvenation. Our assessment relied on a patient-reported outcome that is widely used in plastic surgery and on objective measurement of skin biomechanical parameters. No previous study has compared and examined the effect of a-PRP and HA alone and in combination.
The results of our study showed that the group of patients treated with Cellular Matrix exhibited a very significant improvement in overall facial appearance, which lasted 6 months after the intervention, compared with the a-PRP group and HA groups. Patients were satisfied overall and noted a marked improvement in face radiance (healthy-glow effect), better skin hydration, and an improved rested appearance of the face. As reported in Table 3, it appears that the effects of a-PRP and HA are additive, which may explain the better results obtained with the treatment that combines these 2 agents. Only 1 noncontrolled study has reported the same results, showing rejuvenation of the face with significant correction of wrinkles. In fact, the study by Ulusal, which examined the effect of PRP-HA on 94 patients with varying degrees of facial aging, reported significant improvements in general appearance, skin firmness-sagging, and skin texture.23
Although a better effect of HA treatment alone was observed at 1 month compared with a-PRP-alone treatment, this difference was no longer present at 3 and 6 months. A longer follow-up would reveal the extent of the regenerative effect of the a-PRP.
It appeared that combining a-PRP and HA improved skin elasticity, firmness, and radiance. Our results showed maximum effect and significant improvement in skin firmness and elasticity at 3 months posttreatment compared with the a-PRP and HA groups. At 6 months, treatment with Cellular Matrix continued to show significant improvements in viscoelastic and net elasticity parameters compared with each treatment alone.
Thus, the combination of a-PRP and HA seems to have an additive effect and, we also hypothesize, a synergistic effect on facial rejuvenation. Indeed, according to the literature, combining a-PRP and HA may be beneficial because they employ similar cellular and biological mechanisms in tissue regeneration.
In fact, HA may be used as scaffold for tissue regeneration by facilitating the recruitment of a large number of cells to the injection site. However, HA reportedly results in varying degrees of resorption and requires additional injections. Thus, the combination of a-PRP and HA may overcome this problem of rapid resorption.
The principle of a treatment combining a-PRP and HA is based on its ability to reproduce the natural healing mechanisms through the sequential release of numerous growth factors that stimulate cell proliferation, differentiation, and activation of collagen and elastin fiber synthesis. This process ultimately leads to the restoration of an extracellular matrix able to sustain cell proliferation and differentiation for tissue regeneration. Moreover, it has been shown that PRP obtained with RegenKit-BCT continues to release in situ the main growth factors involved in tissue repair, and maintains stable levels of these growth factors for over 1 week.24
The addition of HA to a-PRP may allow the growth factors released by a-PRP to be trapped and prolong the activation of the synthesis of collagen and other matrix components by stimulating the activation of fibroblasts and thus skin rejuvenation.
In clinical practice, various studies have reported the effectiveness of PRP and HA alone on facial aging. In a recent randomized controlled study, Alam et al reported the effectiveness of PRP injection for facial rejuvenation particularly for textural improvement of photoaged skin.25
A study including 22 Korean patients has shown that PRP combined with fractional laser treatment improved skin elasticity and reduced erythema. Histologic analyses showed that PRP increased the length of the dermal-epidermal junction, the amount of collagen, and the number of fibroblasts.15 Indeed, histologic analysis is the gold standard to assess the effect of these products on the cellular structure of the skin. However, this method is not acceptable and not ethical to use for cosmetic research because noninvasive tools such as confocal microscopy are available.26 Two other noncontrolled studies reported the efficacy of PRP injection for skin rejuvenation. The first showed that 3 sessions of PRP injections at 1-month intervals resulted in significant improvements in skin elasticity.27 The second study reported the effectiveness of a single injection of PRP on facial wrinkles but with a short follow-up of only 2 months.28
It should be noted that PRP is an autologous product and may thus differ in the quality and quantity of platelets depending on the donor.29 In this sense, treatment with PRP might show variable efficacy depending on the patient/donor.
The average platelet concentration of a-PRP used in our study is around 340 to 400 million platelets/mL with an average of 347 million/mL (a concentration factor of 1.6-fold). Indeed, we did not use a-PRP with higher platelet concentrations. Numerous studies have shown that high growth factor concentrations can have a negative effect:30-32 when the amount of growth factors is greater than the amount of receptors, the receptors become overactive and negatively affect the functioning of the cells.33
HA plays a significant role in the tissue regeneration process. Two studies have reported the effectiveness of mesotherapy with HA to improve skin texture. Tedeschi et al showed that mesotherapy with HA can effectively improve skin aging and photaging.3 Moreover, nonreticulated HA-based mesotherapy significantly improves skin elasticity and complexion radiance.2
PRP is also known to accelerate HA production, and can increase skin elasticity.34 Our clinical results obtained by assessing skin elasticity on the cheeks demonstrated a significant increase in the elasticity parameters R2–R5 and R7 and a significant decrease in R6 (viscoelasticity), showing improved skin elasticity and firmness after treatment, lasting for up to 6 months postinjection. Studies on the correlation between skin biomechanical parameters and skin aging have shown a negative correlation between R2, R5, and R7 and age, and therefore these parameters are considered optimal parameters for the in vivo assessment of skin aging.35,36 We also investigated whether there was a treatment effect depending on age or BMI. The results of the multivariate analysis for each time point (1, 3, and 6 months), taking into account the changes in Cutometric parameters, showed an age effect on R7 at 3 months. This finding suggests that skin firmness was increasingly improved in patients in their fifties and sixties. Another quite interesting result was the significant correlation between R6 and BMI at 3 months. Thus, it appeared that the treatment was more effective in patients with low BMI. These results are in line with previous studies showing that fat layer thickness negatively correlates with skin elasticity parameters.37
Regarding the adverse events, immediate or delayed mild bruising occurred only during the first injection session. Our hypothesis is that the untreated women presented skin fragility, which resulted in the presence of bruising at the first injection. After the first treatment session, the dermis strengthened and a process of cell regeneration and neoangiogenesis took place. Although it has been reported that hypersensitivity can occur after repeated PRP applications for androgenetic alopecia,38 in our study no participant showed hypersensitivity after repeated injections of a-PRP or Cellular Matrix.
One of the limitations of this study was that the follow-up was too short (6 months). Further well-designed investigations with a longer follow-up are needed to confirm these findings. Another limitation was the lack of internal control, which could be achieved with a split-face study. Although this is indeed the best design, ethically it is difficult to ask participants to be included in a study where half of their face will be treated and the other half will receive placebo or another treatment, resulting in different outcomes on the same face.
CONCLUSIONS
Combining a-PRP and HA in mesotherapy seems to be a promising treatment for facial rejuvenation with an improvement in skin elasticity and firmness and may have additive and synergistic effects. Thus, HA was used here as an a-PRP vehicle and moisturizing agent to give better outcomes in skin facial rejuvenation.
Disclosures
Dr SidAhmed-Mezi obtained a grant from Regen Lab SA (Lausanne, Switzerland) for performing her research duties. The other authors declared no potential conflicts of interest with respect to the research, authorship, and publication of this article.
Funding
The authors received no financial support for the research, authorship, and publication of this article.
REFERENCES

