


Abstract
In the biological response to biomaterials, the implant shell plays a key role in immune and inflammatory reactions. We hypothesized that the capsules formed around nanotextured implants exhibit an immunohistochemical behavior different to those formed around polyurethane implants.
The aim of this study was to evaluate through immunohistochemistry markers the capsules formed around nanotextured and polyurethane implants.
Sixty albino female Wistar rats were divided into 2 groups (nanotextured and polyurethane), with 30 animals in each group. A mini silicone implant was inserted on the back of the animals. After a predetermined period, the animals were killed, and the capsules formed around the implants were studied. The capsules in the 30-, 60-, and 90-day subgroups were analyzed via immunohistochemistry to detect markers for fibroblast α smooth muscle actin (α-SMA), transforming growth factor β (TGF-β), cluster of differentiation 34 (CD34), and CD68, via picrosirius staining to determine the density of type I and III collagen fibers and via hematoxylin and eosin staining to assess capsule thickness. A Wilcoxon-Mann-Whitney test was used to compare the groups, and a Kruskal-Wallis test was used to compare the subgroups.
Lower α-SMA, TGF-β, CD34 and CD68 immunoexpression was observed in the nanotextured 30- and 60-day subgroups than in the corresponding polyurethane subgroups. In the 90-day subgroup, more pronounced α-SMA and CD34 immunoexpression was observed in the nanotextured group; however, TGF-β and CD68 immunoexpression remained lower. The nanotextured implants showed reduced capsular thickness and greater formation of type I collagen in all the analyzed subgroups.
Nanotextured implants led to reduced immune and inflammatory reactions compared with polyurethane implants according to all analyzed variables.
Silicone breast implants were introduced into the plastic surgery arsenal in 1964; since then, their shells have undergone numerous modifications, with the goal of reducing tissue reactions and allowing greater biocompatibility.1 Improvements in protective barriers to reduce transudation and increase silicone gel cohesion and shell texturing have reduced the incidence of complications, including capsular contracture.2
Regarding shell coatings, polyurethane foam is associated with the lowest incidence of capsular contracture according to a recent systematic review by Duxbury and Harvey,3 who found a low capsular contracture rate of 0.4% to 1% in polyurethane implants at 6 years, whereas in other implants, the rate ranged from 2% to 15%.3 In another study analyzing the histologic behavior of the capsules formed around polyurethane foam–coated silicone implants, complete absorption of the foam was observed within up to 20 years after implantation.4 More recently, another type of shell texturing, nanotexture coating, was created; this was developed to reduce the short-term inflammatory response and the capsular contracture rate through a reduction in fibroblast adhesion activity.5 A recent in vitro study concluded that nanotextured implants have a smaller contact surface, resulting in lower bacterial adhesion than found with macrotextured implants6 and a lower incidence of anaplastic large cell lymphoma.7 Currently, the geometric consequences of surface irregularities and wettability are thought to be more important than the implant surface area because the physical interaction is not the main factor that affects cell behavior.8
In the biological response to biomaterials, the implant shell may or may not absorb proteins and, together with the coagulation cascade, trigger immune and inflammatory reactions, thus playing a significant role in this response.8,9 We hypothesized that the capsules formed around nanotextured implants would exhibit immunohistochemical behavior different from those around polyurethane implants. Our aim was to evaluate through immunohistochemistry markers the capsules formed around implants. The immunohistochemical behavior10 of the capsules formed around silicone implants with a nanotextured surface and those formed around implants coated with polyurethane foam was evaluated by analysis of the following immunomarkers: fibroblast α smooth muscle actin (α-SMA), transforming growth factor β (TGF-β), cluster of differentiation 34 (CD34), and CD68. Collagen formation was also evaluated with picrosirius staining and capsule thickness with hematoxylin and eosin (HE) staining.
METHODS
The study was conducted in the experimental surgery vivarium of the State University of Ponta Grossa (Universidade Estadual de Ponta Grossa, UEPG), in partnership with the State University of Rio de Janeiro (Universidade Estadual do Rio de Janeiro, UERJ). The study was approved by the Committee on Ethics of Animal Use (CEUA) of UEPG under CEUA process number 041/2018 and UEPG protocol number 16450/2018. All procedures strictly followed the existing regulations for animal research.
The study design was a preclinical study (biomodel in rat). A total of 60 albino female rats (Rattus norvegicus albinus), weighing 190 to 250 g and aged 30 to 60 days old, were used in the study. The animals had free access to water, were fed a specific diet for the species, and were kept at room temperature under a 12-h circadian cycle. They were randomly divided into 2 groups of 30 animals for each silicone implant type (nanotextured and polyurethane foam) and subdivided into 3 subgroups according to the time point at which they were killed (30, 60, or 90 days). For antisepsis, a chlorhexidine gluconate 2% solution was used with subsequent fixation with a 0.5% chlorhexidine in 70% alcohol solution. The procedures on the rats were carried out between February and May 2019 and the analysis of the samples was carried out from May to September 2019.
A nanotextured surface implant (Silimed, Rio de Janeiro, Brazil) was inserted in the back of the animals in the nanotextured group (n = 30) and a polyurethane foam–coated implant (Silimed) in the back of the animals in the polyurethane group (n = 30). The implanted materials had the same layers as a human silicone breast implant and were discoid shaped. The nanotextured surface implants measured 22 [1] mm (mean [standard deviation]) in diameter and 9 [1] mm in height, and the polyurethane foam–coated implants measured 24 [1] mm in diameter and 11 [1] mm in height. The height was defined as the point of greatest projection of the implant on the vertical axis (Figure 1). The pores on the surface of the nanotextured implants had the following dimensions: diameter, 0.3 to 8.7 μm; mean roughness (Ra), 4.12 μm; and depth, 3.08 to 10.74 μm. In the polyurethane foam–coated implants, the pores had the following dimensions: diameter, 120 to 320 μm; Ra, 1500 μm; and depth, 480 to 1200 μm.
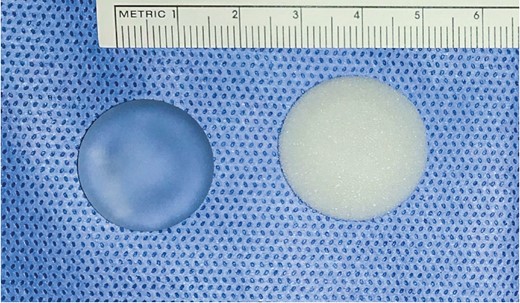
Nanotextured implant (left) and polyurethane foam–covered implant (right).
After allocation to the groups, the rats were randomly removed from the cages and anesthetized via intraperitoneal injection with a combination of 1% ketamine hydrochloride (Dopalen, Hertape, Belo Horizonte, Brazil) at a dose of 40 mg/kg and 2% xylazine hydrochloride (Dopaser, Hertape) at a dose of 8 mg/kg according to the Guide for Anesthesia and Analgesia of Laboratory Animals.11 The effectiveness of anesthesia was assessed by the absence of movement, corneal-palpebral reflex, and motor reaction after pinching the fat pad of one of the hind paws, in addition to a good ventilatory pattern.
With the rats placed in the prone position, their hair was shaved in the dorsal region, followed by antisepsis and placement of a sterile surgical drape. The incision was delimited by taking a horizontal subcostal line as a reference, following the posterior-inferior costal margin, which met the midsagittal line. With a #3 scalpel handle coupled with a #15 blade, a 20-mm horizontal incision was made at the intersection of these reference lines. The implant pocket was made in the retromuscular plane (below the panniculus carnosus), and the implant was subsequently inserted in a vertical direction according to the group (nanotextured or polyurethane) and positioned horizontally. Careful dissection was performed, and new surgical instruments were used for each rat with a change of gloves and nonpowdered gloves. The exposure time of the implants before inclusion in the pocket was minimized. Implants were also minimally manipulated after positioning. Layer closure was performed and no drain was used. The skin was sutured intradermally with 5-0 mononylon (Ethicon) with buried knots. No stitch removal or dressing placement was necessary in the postoperative period, and the surgical wound was kept exposed. Postoperative analgesia was performed with a single intramuscular application of sodium dipyrone (20 mg/kg) in the lateral region of the posterior limb.
The animals were killed in 30-, 60-, and 90-day subgroups by administration of 4 times the therapeutic dose of Dopalen and Dopaser and subsequent cervical dislocation. No premature death, surgical site infection, or implant extrusion occurred, and thus none of the rats were excluded from the analysis (Videos 1 and 2).
Histologic material was obtained through en bloc resection from the skin to the muscle layer, with the surgical margins of the anatomic specimens extending 5 mm beyond the edge of the discoid implants (Figure 2). Neither the pathologist nor the researcher had access to the identification of the experimental animals at the time of immunohistochemical and histologic evaluation. During analysis of the results, the best photomicrographs were selected for photomicrographic documentation.
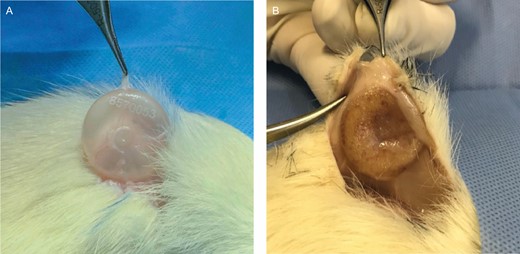
(A) A nanotextured explant not adhered to the adjacent tissue. Note the thickness of the nanotextured implant capsule on the clamp. (B) A polyurethane foam–covered explant adhered to the adjacent tissue.
In the present study, skin samples for histological and immunohistochemical evaluation were fixed in 10% diluted formaldehyde. After fixation, they were embedded in paraffin for the purpose of acquiring the histological cuts.12,13 To perform immunohistochemistry analysis, the histologic sections were mounted on electrically charged slides (Starfrost, Knittel, Bielefeld, Germany), and the following primary antibodies were used: rabbit anti-human α-SMA polyclonal antibody (anti α-SMA, 1:600; clone, ab5694; Abcam, Cambridge, UK); rabbit anti-human TGF-β1 polyclonal antibody (anti-TGF-β1; 1:600; clone, NA; Spring Bioscience, Pleasanton, CA); mouse anti-human CD34 monoclonal antibody (anti-CD34, 1:600; clone, QBEnd/10; Bio SB, Santa Barbara, CA); and mouse anti-human CD68 monoclonal antibody (anti-CD68, 1:400; clone, KP-1; Bio SB).
The following structures were evaluated for expression of the following immunomarkers: α-SMA, myofibroblasts; TGF-β and CD68, macrophages; and CD34, blood vessels. The immunohistochemical reactions were read with a slide scanner (Axio Scan.Z1, Zeiss, Oberkochen, Germany), and digital images were captured in a high-power field (HPF) in Tagged Image File Format (TIF) with a total area of 144,073.3 μm2. The software used for this measurement was Image-Pro Plus (Media Cybernetics, Rockville, MD). An image showing adequate positivity for each primary antibody studied was chosen for mask definition. The mask was then superimposed on the digital images, and based on the ideal immunopositivity, the software found the immunopositive areas, providing the data in μm2. The area in μm2 was then divided by the constant 144,073.3 μm2, which was the total area of the field under evaluation, generating an immunopositive area percentage in the HPF. At least 10 HPFs were analyzed per slide, and cells with brown cytoplasmic immunostaining were considered positive. A mean immunopositive area percentage per HPF was calculated for each case for each primary antibody. After the measurements were taken, the results expressed as a percentage were automatically transferred to a spreadsheet for statistical calculations.
The density of young (type III) and mature (type I) collagen fibers in each group was calculated from picrosirius staining (Sirius Red). For this purpose, the picrosirius-stained slides were photographed with the same imaging system described for immunohistochemistry. The images were obtained in HPF and stored as TIFFs. Image-Pro Plus software was used for this measurement, only this time with the color morphometry function. After the measurements were taken, the results expressed as a percentage were automatically transferred to a spreadsheet for statistical calculations.
Capsular thickness was measured with HE staining, and the slides were photographed with the same imaging system described for picrosirius staining. After the images were acquired, multiple capsular thickness measurements were taken along the capsule, numbered from 1 to 20 in the dorsal region of the implant and from 21 to 40 in the ventral region of the implant. The results of these measurements were expressed in μm2 and automatically transferred to a spreadsheet for statistical calculations.
A nonparametric Wilcoxon-Mann-Whitney test was used to compare the groups (nanotextured and polyurethane) by subgroup (30-, 60-, and 90-day). A nonparametric Kruskal-Wallis test was used to compare the subgroups within each group. Values of P < 0.05 indicate statistical significance. The data were analyzed with R software, version 3.5.1.
RESULTS
The nanotextured and polyurethane groups were compared with regard to each analyzed variable in the 30-, 60-, and 90-day subgroups.
Immunoexpression of α-SMA
The 30- and 60-day nanotextured subgroups showed significantly lower α-SMA immunoexpression than the corresponding polyurethane subgroups. However, when comparing the median of the 90-day subgroups, the difference was not significant (Figures 3 and 4).
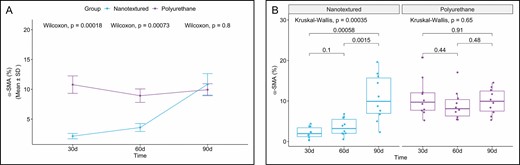
(A) Within-group comparison of α-SMA in the capsules of nanotextured (blue) and polyurethane foam-covered implants (purple) over time. (B) Intergroup comparison of the amount of α-SMA at each time point. α-SMA, α smooth muscle actin.


(A, B, D) Immunohistochemistry for α-SMA in the capsules of nanotextured implants at 30, 60, and 90 days, respectively (×20 magnification). (B, E, H) Immunohistochemistry for α-SMA in the capsules of polyurethane implants at 30, 60, and 90 days, respectively (×20 magnification). (C, F, I) Bar graph representation of the α-SMA percentage for both implant types at 30, 60, and 90 days, respectively. α-SMA, α smooth muscle actin.
When the 3 subgroups were compared within each group, a significant difference was observed only for the nanotextured group (P = 0.00035). The 90-day nanotextured subgroup showed higher α-SMA immunoexpression than the 30-day (P = 0.00058) and 60-day (P = 0.0028) subgroups (Figure 3).
Immunoexpression of TGF-β
The nanotextured group showed significantly lower TGF-β immunoexpression than the polyurethane group in all the evaluated subgroups (Figures 5 and 6).
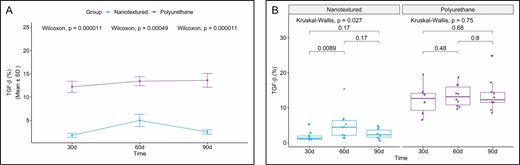
(A) Within-group comparison of TGF-β in the capsules of nanotextured (blue) and polyurethane foam–covered implants (purple) over time. (B) Intergroup comparison of the amount of TGF-β at each time point. TGF-β, transforming growth factor β.


(A, D, G) Immunohistochemistry for TGF-β in the capsules of nanotextured implants at 30, 60, and 90 days, respectively (×20 magnification). (B, E, H) Immunohistochemistry for TGF-β in the capsules of polyurethane implants at 30, 60, and 90 days, respectively (×20 magnification). (C, F, I) Bar graph representation of the TGF-β percentage for both implant types at 30, 60, and 90 days, respectively. TGF-β, transforming growth factor β.
When comparing the subgroups within each group, a significant difference was only found for the nanotextured group (P = 0.027). Further analysis indicated that the 60-day subgroup shower higher TGF-β immunoexpression (P = 0.011) than the 30-day subgroup (Figure 5).
Immunoexpression of CD34
When CD34 immunoexpression was evaluated, an inversely proportional curve was observed between the nanotextured and polyurethane groups in the 3 subgroups. Comparing the 30-day subgroups, the nanotextured group showed lower CD34 immunoexpression (P = 0.038), whereas in the 90-day subgroups, the immunoexpression of this marker was more intense in the nanotextured group (P = 0.045) (Figures 7 and 8).
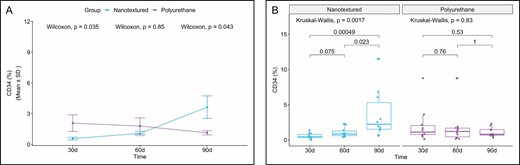
(A) Within-group comparison of CD34 in the capsules of nanotextured (blue) and polyurethane foam–covered implants (purple) over time. (B) Intergroup comparison of the amount of CD34 at each time point. CD34, cluster of differentiation 34.


(A, D, G) Immunohistochemistry for CD34 in the capsules of nanotextured implants at 30, 60, and 90 days, respectively (×20 magnification). (B, E, F) Immunohistochemistry for CD34 in the capsules of polyurethane implants at 30, 60, and 90 days, respectively (×20 magnification). (C, F, I) Bar graph representation of the CD34 percentage for both implant types at 30, 60, and 90 days, respectively. CD34, cluster of differentiation 34.
When the 3 subgroups were compared within each group, a significant difference was observed only in the nanotextured group (P = 0.0017). When comparing the nanotextured subgroups, higher CD34 immunoexpression was observed in the 90-day subgroup than in the 30-day (P = 0.0013) and 60-day (P = 0.026) subgroups (Figure 7).
Immunoexpression of CD68
CD68 immunoexpression was significantly less intense in all the nanotextured subgroups. However, importantly, a considerable increase in CD68 immunoexpression was observed in the 60-day polyurethane subgroup (Figures 9 and 10).
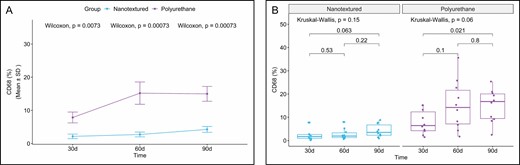
(A) Within-group comparison of CD68 in the capsules of nanotextured (blue) and polyurethane foam–covered implants (purple) over time. (B) Intergroup comparison of the amount of CD68 at each time. CD68, cluster of differentiation 68.


(A, D, G) Immunohistochemistry for CD68 in the capsules of nanotextured implants at 30, 60, and 90 days, respectively (×20 magnification). (B, E, H) Immunohistochemistry for CD68 in the capsules of polyurethane implants at 30, 60, and 90 days, respectively (×20 magnification). (C, F, I) Bar graph representation of the CD68 percentage for both implant types at 30, 60, and 90 days, respectively. CD68, cluster of differentiation 68.
When comparing the subgroups within each group, a significant difference was found only between the 30- and 90-day polyurethane subgroups, with higher CD68 immunoexpression in the 90-day subgroup (P = 0.021) (Figure 9).
Percentage of Types I and III Collagen
Type I collagen production was higher in all the nanotextured subgroups than in the polyurethane subgroups, although the difference was only significant in the 90-day subgroup (P = 0.031). Moreover, an increase in the production of type I collagen over time was found in both groups, which peaked in the 60-day subgroups and decreased thereafter (Figures 11-13).
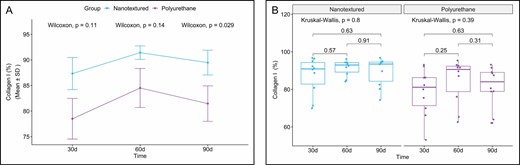
(A) Within-group comparison of type I collagen in the capsules of nanotextured (blue) and polyurethane foam–covered implants (purple) over time. (B) Intergroup comparison of the amount of type I collagen at each time.
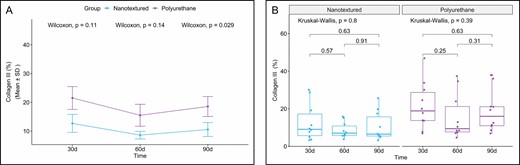
(A) Within-group comparison of type III collagen in the capsules of nanotextured (blue) and polyurethane foam–covered implants (purple) over time. (B) Intergroup comparison of the amount of type III collagen at each time point.


(A, E, I) Picrosirius red–stained images of implant capsules of nanotextured implants at 30, 60, and 90 days, respectively (×20 magnification). (B, F, J) Picrosirius red–stained images of implant capsules of polyurethane implants at 30, 60, and 90 days, respectively (×20 magnification). (C, G, K) Bar graph representation of collagen type I percentage for both implant types at 30, 60, and 90 days, respectively. (D, H, L) Bar graph representation of collagen type III percentage for each implant type at 30, 60, and 90 days, respectively.
When comparing the subgroups within each group, no significant difference was observed.
Capsular Thickness
The 30-, 60- and 90-day nanotextured subgroups showed significantly lower capsular thickness than the corresponding polyurethane subgroups (Figures 14 and 15).
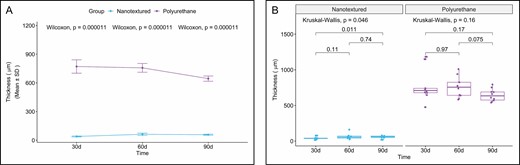
(A) Within-group comparison of capsular thickness in the capsules of nanotextured (blue) and polyurethane foam–covered implants (purple) over time. (B) Intergroup comparison of the capsular thickness at each time point.


(A, D, G) Panoramic view of HE staining for the capsules of nanotextured implants at 30, 60, and 90 days, respectively. (B, E, H) Panoramic view of HE staining for the capsules of polyurethane implants at 30, 60, and 90 days, respectively. (C, F, I) Bar graph representation of capsular thickness at 30, 60, and 90 days, respectively. HE, hematoxylin-eosin.
When the 3 subgroups were compared within each group, a significant difference was found only for the nanotextured group (P = 0.046). When comparing the nanotextured subgroups, higher capsular thickness was observed in the 90-day subgroup than in the 30-day subgroup (P = 0.014) (Figure 14).
Figure 16 shows the irregularity of the capsule formed around the nanotextured implants, indicating that its surface is not completely smooth.
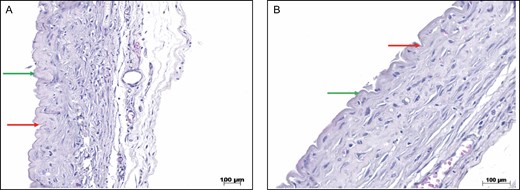
(A) HE staining of the capsules of nanotextured implants. The green arrows show the peaks, and the red arrows show the valleys (×10 magnification). (B) HE staining of the capsules of nanotextured implants. The green arrows show the peaks, and the red arrows show the valleys (×20 magnification). HE, hematoxylin-eosin.
DISCUSSION
Female rats were chosen as an experimental model in the present study due to their high applicability in research and because they exhibit skin healing very similar to that in humans when surgical wounds are sutured for first intention healing.14,15 The time point at which the animals were killed was determined based on the corresponding lifetime of rats in relation to humans, ie, in rats, 90 days of life corresponds to approximately 10 years in humans.16 The inflammatory processes in R. norvegicus albinus are well known for research, thus facilitating the understanding of the responses in this work that can be extrapolated to humans. The results found can be extrapolated to chronic responses in humans taking into account that each period of 1 month in rats corresponds to 3 to 4 years of humans.17
The physiological healing process includes inflammatory, proliferative, and remodeling phases. These phases see the release of different cytokines and biochemical markers that characterize each phase and aid in tissue repair.18 The healing response to the implant is initiated by recruitment of polymorphonuclear leukocytes that secrete leukotrienes and potent inflammatory mediators that stimulate fibroblast migration and proliferation. In addition, mast cells, platelets, and macrophages secrete TGF-β, which binds to its receptors on fibroblasts, thus stimulating fibroblast differentiation into myofibroblasts and resulting in type III collagen degradation and type I collagen synthesis.19-21
Myofibroblasts are critical cells in scar contraction. A recent study by Darby et al21 showed that after biochemical stimuli, myofibroblasts develop bundles of muscle fibrils called α-SMA, which is a marker that can be identified through immunohistochemistry. During physiological peri-implant healing, after tissue repair, cells enter apoptosis, ending the inflammatory reaction; however, in cases of exacerbated collagen production and deposition, perpetuation of the inflammatory phase may occur, leading to capsular contracture.22 Prophylaxis through administration of zafirlukast and montelukast has been attempted, and these leukotriene antagonists have shown good results, but this measure cannot yet be considered a definitive solution to curb the complex and still obscure capsular contracture mechanism.23,24
Recently, in an experimental study with female rats, Lombardo et al25 showed a reduction in capsular contracture with oral use of omega-3 fatty acids. Intake of these fatty acids has been shown to reduce the amount of substrate available for synthesis of proinflammatory eicosanoids, resulting in a decrease in capsular contracture rates.25 Previous experiments, such as application of anti-Fas antibodies directly on the implant surface, showed a significant decrease in TGF-β and CD68 expression and an increase in type III collagen, thus indicating that the implant surface is fundamental in the antibody-antigen response.26 Ludolph et al27 found that the use of acellular porcine dermis as an implant shell in rats reduced the formation of fibrotic tissue. Similar results were observed by Liu et al28 in a recent meta-analysis of the application of acellular dermal matrix on implant surfaces, resulting in decreased capsular contracture rates.
According to the latest ISO 14607 revision, which addresses the surface roughness of breast implants, implants are classified as smooth when the roughness is below 10 μm; as microtextured between 10 and 50 μm; and as macrotextured at above 50 μm. Thus, nanotexture should be considered a smooth surface and polyurethane a macrotexture.29 In a previous study on the relation between myofibroblasts and capsular thickness, Bui et al30 found high levels of α-SMA and greater alignment of collagen fibers in contracted capsules around smooth implants than in noncontracted capsules around textured implants. The authors concluded that when capsular contracture occurs, there is a thickening of the capsule, greater alignment of collagen fibers, and a higher presence of contractile myofibroblasts. Our findings partially agree with those of Vieira et al31 and Silva et al,32,33 who studied textured and polyurethane implants in rats and found a smaller number of myofibroblasts visualized by HE staining and lower α-SMA immunoexpression in 30- and 50-day textured subgroups; however, the results for the 70- and 90-day subgroups of those studies diverged from our results.
Notably, in the present study, α-SMA immunoexpression underwent a quantitative inversion in both groups (nanotextured and polyurethane) after the 90-day time point, ie, after this period, the results differed from those of Vieira et al31 and Silva et al.32,33 In a study on double-capsule formation, Glicksman et al34 found positive α-SMA immunoexpression in capsules formed around macrotextured implants (Biocell) in humans. The increase in this immunomarker was correlated with repeated cycles of microtrauma in the capsule over time, resulting in the formation of a double capsule.34 In the present study, there was no evidence of double-capsule formation in either group over the evaluated time period. Furthermore, in the polyurethane group, in all cases, separation of the polyurethane foam from the rest of the capsule could not be visualized, thus demonstrating its complete biointegration.34,35
Radiotherapy induces an increase in the thickness of capsules formed around breast implants, which leads to a greater number of fibrogenic fibroblasts (CD26), greater collagen production, and more pronounced expression of profibrotic genes, especially TGF-β1.36 Our findings partially agree with those of Vieira et al,31 who found greater TGF-β immunoexpression and neoangiogenesis evaluated by vascular endothelial growth factor expression in the polyurethane group; although in the present study, TGF-β expression was decreased in the polyurethane group at 90 days, and the immunomarker CD34 was used to evaluate neoangiogenesis.
Angiogenesis occurs during the inflammatory and proliferative phases. In several studies on the subject, greater neovascularization was observed in contracted capsules, which can also be analyzed through CD31 and vascular endothelial growth factor, and this increase was attributed to interleukin 8 secreted by macrophages and fibroblasts.37-41 In contrast to a study on implant linings by Ratner,42 who found greater angiogenesis when the pores on the implant surface were between 30 and 40 μm, in our study, the nanotextured group (pore size, 0.3-8.7 μm) showed greater neovascularization than the polyurethane group (pore size, 120-320 μm) at 90 days.
Another important immunomarker to evaluate healing is CD68, which is indicative of macrophages.43 These cells have proinflammatory (M1) and anti-inflammatory (M2a, M2b, and M2c) subtypes and are essential in capsular formation and foreign body reactions.42 CD68 is related to the level of chronic inflammation and to giant cells (histiocytes). In cases of severe capsular contracture, an increase in CD68 is typically observed.40,41 However, a previous study did not attribute a simple increase in macrophages, in this case evidenced by CD68, to the complex process of capsular contracture.31
An alternative to a decreased inflammatory reaction and consequently lower CD68 expression is the use of human acellular dermal matrix for partial coverage of expanders.44 Fischer et al45 studied the capsules of smooth and textured implants in rats and found greater capsular thickness, lower collagen density, and higher collagen 1 and CD68 gene expression in the textured group at 60 days. In the present study, similar results were found in the polyurethane group at up to 90 days, but Fischer et al45-47 emphasize that at 120 days, this difference ceased to exist. Continuing their experimental studies in rats, Fischer et al46,47 evaluated the capsules of macrotextured implants after injection of collagenase produced by Clostridium histolyticum and found lower capsular thickness and greater collagen 3, CD68, and TGF-β1 gene expression than observed in the control group, which received saline.
An extremely important factor in the healing reaction and capsule formation around implants is the texture of the implant surface. When the surface is smooth, dense, nonadherent capsules form with organized and aligned collagen fibers. However, as the surface roughness of the implants increases, such as with texturizing, greater tissue growth occurs through the pores, with misalignment of collagen fibers.31,48
Our findings on capsular thickness do not concur with those of Minami et al49 because they found an alteration in greater capsular thickness between the smooth and macrotextured implants according to each subgroup. However, similar to Vieira et al31 and Silva et al,32 in the present study, polyurethane implants (macrotexture) always showed a greater capsular thickness.
This finding is explained by the high level of type III (immature) collagen, the foreign-body type chronic granulomatous inflammatory process with giant cells, and the presence of exogenous material resulting from degradation of the polyurethane foam and its incorporation into the capsular thickness.48 Regarding collagen, Minami et al49 showed higher production of type I collagen in all evaluated smooth implant subgroups. In contrast, in the present study, there was an increase in the production of this collagen in the 60-day subgroup followed by a subsequent decrease, whereas in the study by Minami et al,49 the opposite results were observed. Results similar to those in the present study were reported by Silva et al.32
Currently, one of the concerns after implant placement is displacement. The adhesion strength between textured implants and the capsule is known to be due to scar tissue growth in the peaks and valleys of the implant surface, which ensures great stability between the implant and adjacent tissues, thus reducing the risk of implant displacement.48 In the present study, separating the capsule from the polyurethane implant and the capsule from the adjacent tissues was very difficult. However, the opposite was observed with the nanotextured implants; no type of adherence of the implant to the capsule or of the capsule to the adjacent tissues was found, leading to displacement of the implants in all the animals in this group.
It is important to mention that the healing reaction and capsular formation around silicone implants with smooth surfaces has not been evaluated in preclinical studies. Taking into account the worldwide trend of increasing use of silicone implants with smooth surfaces, it would be worthwhile to carry out a study that evaluates the histologic and immunohistochemical characteristics with the same markers around this type of implant. This is a limitation of this research because there is no control group to compare and analyze the differences in the healing reaction with nanotextured implants.
Another limitation of the present research is the lack of an observation point after 90 days for an assessment on a longer time scale of the behavior of the results for both types of implants. An example would be to evaluate whether the immunoexpression of CD34 and α-SMA in the capsules formed around the nanotextured implants remains unchanged later, in the presence of the remodeling and fibrosis process. Fischer et al45 showed that, after 120 days, there was no difference between the general characteristics of the capsules formed around smooth and textured implants. Likewise, the results of Minami et al49 showed that after 270 days, the peri-implant capsules are thick and contracted. Thus, it would be interesting for future studies to address later periods of time to compare these with the results of the present study.
Given the above findings, prospective studies with appropriate designs are suggested to better evaluate the biological behavior of nanotextured implants and to clarify the complex mechanism of biotolerance associated with the host response.
CONCLUSIONS
Nanotextured implants showed lower α-SMA, TGF-β, CD34, and CD68 immunoexpression than polyurethane implants in all subgroups, with the exception of the α-SMA and CD34 immunomarkers in the 90-day nanotextured subgroups. Greater type I collagen formation and lower capsular thickness were also observed in the nanotextured implant groups. Nanotextured implants led to reduced immune and inflammatory reactions compared with polyurethane implants according to all analyzed variables.
Funding
The authors received no financial support for the research, authorship, or publication of this article.
REFERENCES
Author notes
Dr Mendes Carneiro Filho is a plastic surgeon in Sobral-CE, Brazil.

