


Abstract
Recent data show that aesthetic surgery research is lagging compared with reconstructive surgery: research funding and institutional disparities within aesthetic surgery are potential factors in this trend.
The authors sought to determine if disparities exist in aesthetic surgery research based on funding sources or practice settings.
The authors reviewed Aesthetic Surgery Journal articles from 2009 to 2019. Chi-square, t test, bivariate, and multivariate regression analyses were employed to evaluate research trends.
A total of 2262 publications were identified, with 318 funded articles meeting inclusion criteria. The majority of studies (294, 92%) received external funding, with 281 (88%) being supported solely by external funds. Externally funded studies were financed by private industry (194, 66%), foundations/societies (53, 18%), government grants (23, 8%), or a combination of agencies (24, 8%). The majority of funded studies were at academic institutions (266, 84%), followed by private practice (46, 14%) and private industry (6, 2%). Analysis of annual publications revealed a rising percentage of academic-based research, which correlated with decreasing research from private practice (r = −0.95, r2 = 0.89, P < 0.001). Compared with academic institutions, private practice relied more heavily on industry funding (55% vs 87%, respectively, P = 0.001), exhibiting lower rates of foundational/societal (20% vs 2%), governmental (9% vs 0%), combined (8% vs 7%), and internal department funding (8% vs 4%). Article citations and level of evidence were unaffected by funding source, agency, or practice setting.
Lack of diversity in research funding among private practice surgeons may explain the reported discrepancies that currently exist between aesthetic and reconstructive surgery research.
Plastic surgery is a specialty well-versed in research innovation. Since the publication of the ancient Sanskrit text outlining nasal reconstruction and skin grafting in the sixth century B.C., plastic surgery research continues to grow as evidenced by current top journals receiving more articles each year.1-3 First established as Aesthetic Surgery Quarterly in 1996, the Aesthetic Surgery Journal (ASJ) has grown tremendously since becoming indexed in 2009; with an ever-increasing impact factor and exceptional ranking among surgery journals, ASJ is at the forefront of aesthetic surgery research and innovation.
Despite the success of ASJ, there is evidence that aesthetic surgery research is falling behind other research fields in plastic surgery, particularly reconstructive surgery. A recent study found that a significant gap exists between aesthetic and reconstructive surgery research studies. According to Tang et al,4 56% of the top 100 most-cited publications between 1900 and 2017 were in reconstruction, whereas only 11% of these most-cited papers were in aesthetic surgery. The authors speculate that this disparity may be due to lack of research infrastructure among surgeon researchers in private practice or a lack of industry support. Research funding is a means to build research infrastructure; financial or institutional inequities may explain this reported gap between aesthetic and reconstructive surgery research. ASJ, a pillar in aesthetic surgery research and a Web of Science Top 5 most-cited journal in plastic surgery, is a substantial medium to test this hypothesis.
In this study, we evaluated 10-year trends in aesthetic surgery research studies within ASJ to determine if disparities exist based on funding sources, funding agencies, and practice settings. Furthermore, to determine if funding or practice variabilities affect the quality and impact of aesthetic surgery research studies, we characterized level of evidence and citation volume among all included research studies.
METHODS
In accordance with Preferred Reporting Items for Systematic Reviews guidelines (Appendix, available online at www.aestheticsurgeryjournal.com), a systematic literature review utilizing Web of Science was conducted in July 2020 for all articles published within ASJ from January 2009 to December 2019.5 The search was conducted by an institution-appointed Academy of Health Information Professionals-certified librarian (MLA). The literature review was conducted by J.H., V.A., and K.M. under the supervision of the librarian; disagreements during the search and review process were resolved with independent evaluation by the librarian and the senior author (C.T.). Articles of interest included original articles with a reported source of funding. Unfunded studies, systematic reviews, editorial materials, letters to the editor, and correction articles were excluded from analysis.
Articles were grouped based on year of publication, level of evidence (I-V), and practice setting (academic, private practice, or industry). Practice settings were considered “academic” if directly affiliated with a state or privately funded college or university of higher education; all others, including not-for-profit healthcare entities, were classified as “private practice.” Research studies conducted solely by private or publicly shared for-profit companies were classified as “industry.” Article citation volumes were recorded as of July 2020. For articles with a mix of academic and private practice authors, whereby reported sources of funding were not directly associated with each authors’ affiliate institution, the institution affiliations of only the first (or co-first), second, and last authors were utilized.
Funding sources and agencies were gathered based on published results in Web of Science or reported funding sources within the article text. Funding sources were classified as:
External
Internal (ie, departmental or practice funding)
Both external and internal
Funding agencies were classified as:
Industry (ie, private or publicly shared for-profit companies)
Research foundations and societies
Government (ie, grants)
Combination
Statistical analysis included bivariate and multivariate linear regression for comparison of annual research trends. Bivariate comparisons were conducted employing Pearson product-moment correlation. Multivariate analyses were conducted using 1-way analysis of variance. Continuous and categorical variables were compared employing the 2-sample t test and chi-square test, respectively. Two-sided P values < 0.05 were considered statistically significant. Statistical analyses were performed with JMP Version 14 (SAS Institute Inc., Cary, NC). Because all data included for this study were publicly available, this study met our institutional review board’s criteria for exemption.
RESULTS
Research Articles
Web of Science inquiry generated a total of 2262 articles published in ASJ from 2009 to 2019. Among these articles, a total of 1198 were original full-text articles. Review of these articles yielded a total of 318 funded studies meeting the inclusion criteria (Figure 1). Both funded and total research articles steadily increased from 2009 (Figure 2), with the year 2019 yielding the highest number of funded research studies (N = 166). The number of funded research articles was positively correlated with total publications accepted each year (r = +0.78, r2 = 0.61, P = 0.005). The number of funded studies performed within the United States (Figure 3) also positively correlated with the total number of funded research articles accepted each year (r = +0.77, r2 = 0.60, P = 0.005).
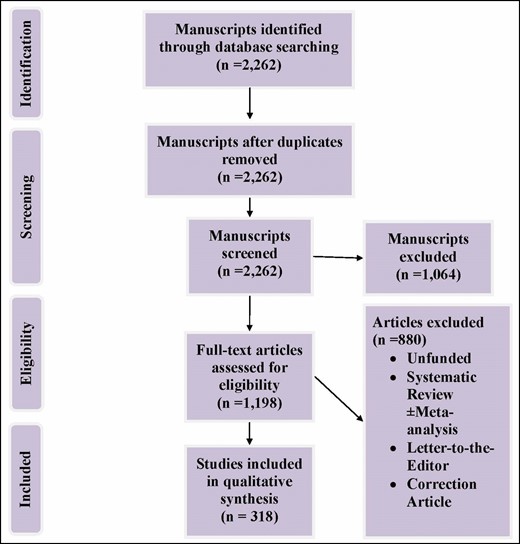
Preferred Reporting Items for Systematic Reviews methodology flowchart.
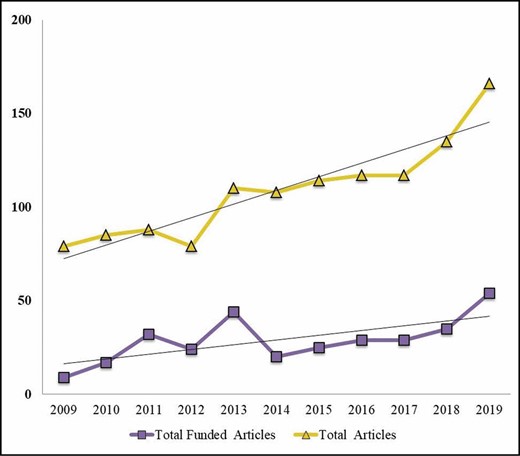
Both funded and total research articles by year.
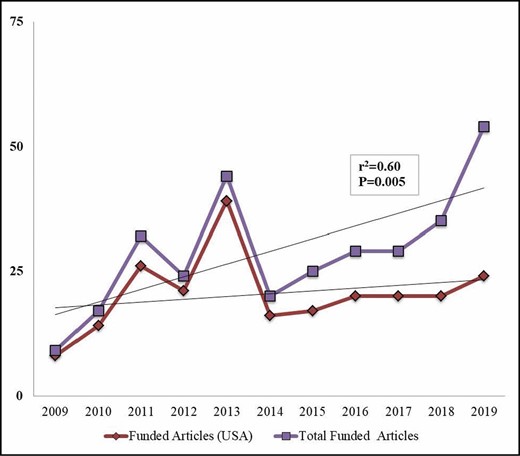
Comparison of US-based funded research articles to total funded articles published by year.
Regarding practice setting, the majority of funded studies (266, 84%) were conducted by academic institutions compared with private practice (46, 14%) or private industry (6, 2%). Comparison of annual funded articles between academic and private practice research setting (Figure 4) revealed a steady uptrend in the number of academic-based studies. This rising trend in academic institution–based research significantly correlated with a decreasing proportion of funded studies from private practice researchers (r = −0.95, r2 = 0.89, P < 0.001).
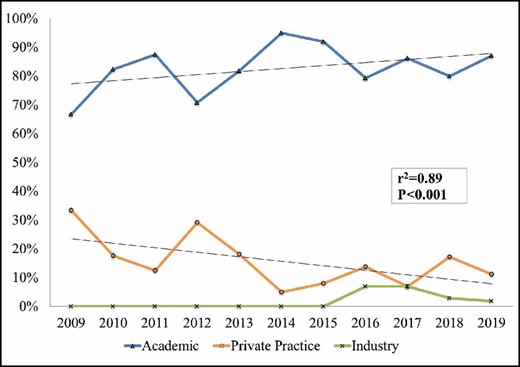
Annual contribution of funded articles by practice setting.
Funding Sources and Agencies
Regarding funding sources (Figure 5), the majority of studies (294, 92%) received external funding, with 281 (88%) being supported solely by external funds. A total of 24 studies (8%) were financially supported with internal funding. Thirteen studies (4%) were both externally and internally funded.
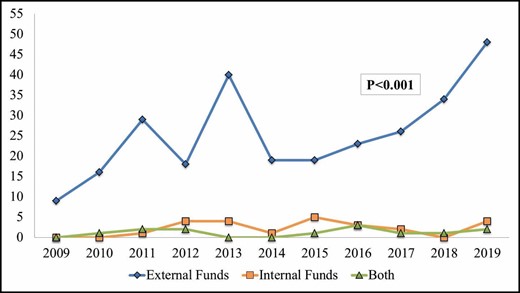
Funding sources by year. Footer: 1-way ANOVA P value.
The majority of externally funded studies were financed by private industry (194, 66%) followed by research foundations and societies (53, 18%) and government grants (23, 8%). Twenty-four studies (8%) received a combination of industry, foundational, and/or government funding. The number of industry-funded studies was highest each year with the exception of 2016, whereby more studies received a combination of external funding. In 2017, an increasing number of studies were industry funded, whereas the number of studies funded by other external entities remained significantly lower by comparison. Funding agencies by year are summarized in Figure 6.

Funding agencies by year. Footer: 1-way ANOVA P value.
Comparison of research funding by practice setting (Table 1) revealed that a significant majority of studies conducted in an academic (148, 55%) and private practice (40, 87%) setting were financed by private industry. Compared with academic centers, private practice research settings exhibited significantly lower percentages of studies funded by foundations and societies (20% vs 2%), government grants (9% vs 0%), combined external funding (8% vs 7%), and internal funding (8% vs 4%).
Comparison of Funding Agencies, Level of Evidence, and Citation Volume Between Academic and Private Practice Settings
| Practice setting | |||
|---|---|---|---|
| Academic, N (%) N = 266 | Private, N (%) N = 46 | P value | |
| Funding agencies | 0.001a | ||
| Industry | 148 (55) | 40 (87) | |
| Foundation/society | 52 (20) | 1 (2) | |
| Government | 23 (9) | 0 (0) | |
| Combination | 21 (8) | 3 (7) | |
| Internal funding | 22 (8) | 2 (4) | |
| Level of evidence | 0.204a | ||
| I | 11 (4) | 3 (6) | |
| II | 48 (18) | 12 (26) | |
| III | 48 (18) | 5 (11) | |
| IV | 75 (28) | 17 (37) | |
| V | 84 (32) | 9 (20) | |
| Citation volume (mean ± SD, range) | 13.8 ± 15.2 (0-98) | 13.4 ± 16.6 (0-83) | 0.887b |
SD, standard deviation. aChi-square P value. bTwo-sample t test.
Both Funded and Total Research Articles by Year
| Year | 2009 | 2010 | 2011 | 2012 | 2013 | 2014 | 2015 | 2016 | 2017 | 2018 | 2019 |
|---|---|---|---|---|---|---|---|---|---|---|---|
| Total funded articles | 9 | 17 | 32 | 24 | 44 | 20 | 25 | 29 | 29 | 35 | 54 |
| Total articles | 79 | 85 | 88 | 79 | 110 | 108 | 114 | 117 | 117 | 135 | 166 |
| Year | 2009 | 2010 | 2011 | 2012 | 2013 | 2014 | 2015 | 2016 | 2017 | 2018 | 2019 |
|---|---|---|---|---|---|---|---|---|---|---|---|
| Total funded articles | 9 | 17 | 32 | 24 | 44 | 20 | 25 | 29 | 29 | 35 | 54 |
| Total articles | 79 | 85 | 88 | 79 | 110 | 108 | 114 | 117 | 117 | 135 | 166 |
Comparison of US-based Funded Research Articles to Total Funded Articles Published by Year
| Year | 2009 | 2010 | 2011 | 2012 | 2013 | 2014 | 2015 | 2016 | 2017 | 2018 | 2019 |
|---|---|---|---|---|---|---|---|---|---|---|---|
| Funded articles (USA) | 8 | 14 | 26 | 21 | 39 | 16 | 17 | 20 | 20 | 20 | 24 |
| Total funded articles | 9 | 17 | 32 | 24 | 44 | 20 | 25 | 29 | 29 | 35 | 54 |
| Year | 2009 | 2010 | 2011 | 2012 | 2013 | 2014 | 2015 | 2016 | 2017 | 2018 | 2019 |
|---|---|---|---|---|---|---|---|---|---|---|---|
| Funded articles (USA) | 8 | 14 | 26 | 21 | 39 | 16 | 17 | 20 | 20 | 20 | 24 |
| Total funded articles | 9 | 17 | 32 | 24 | 44 | 20 | 25 | 29 | 29 | 35 | 54 |
Annual Contribution of Funded Articles by Practice Setting
| Year | 2009 | 2010 | 2011 | 2012 | 2013 | 2014 | 2015 | 2016 | 2017 | 2018 | 2019 |
|---|---|---|---|---|---|---|---|---|---|---|---|
| Academic | 67% | 82% | 88% | 71% | 82% | 95% | 92% | 79% | 86% | 80% | 87% |
| Private practice | 33% | 18% | 13% | 29% | 18% | 5% | 8% | 14% | 7% | 17% | 11% |
| Industry | 0% | 0% | 0% | 0% | 0% | 0% | 0% | 7% | 7% | 3% | 2% |
Funding Sources by Year
| Articles (N = 318) | 2009 | 2010 | 2011 | 2012 | 2013 | 2014 | 2015 | 2016 | 2017 | 2018 | 2019 |
|---|---|---|---|---|---|---|---|---|---|---|---|
| External funds | 9 | 16 | 29 | 18 | 40 | 19 | 19 | 23 | 26 | 34 | 48 |
| Internal funds | 0 | 0 | 1 | 4 | 4 | 1 | 5 | 3 | 2 | 0 | 4 |
| Both | 0 | 1 | 2 | 2 | 0 | 0 | 1 | 3 | 1 | 1 | 2 |
Funding Agencies by Year
| Articles (N = 294) | 2009 | 2010 | 2011 | 2012 | 2013 | 2014 | 2015 | 2016 | 2017 | 2018 | 2019 |
|---|---|---|---|---|---|---|---|---|---|---|---|
| Industry | 7 | 12 | 26 | 11 | 33 | 12 | 11 | 8 | 17 | 23 | 34 |
| Foundation/society | 2 | 4 | 1 | 6 | 4 | 5 | 5 | 5 | 6 | 7 | 8 |
| Government | 0 | 0 | 1 | 1 | 0 | 1 | 3 | 4 | 2 | 4 | 7 |
| Combination | 0 | 1 | 3 | 2 | 3 | 1 | 1 | 9 | 2 | 1 | 1 |
Level of Evidence and Citation Volume
Level of evidence among all funded articles included level I (14, 4%), level II (62, 19%), level III (55, 17%), level IV (93, 29%), and level V (94, 30%). Level of evidence did not significantly vary based on funding sources, funding agencies, or practice setting. Number of citations did not significantly vary based on funding agencies or practice setting. Data comparing level of evidence and citation volume by practice setting are summarized in Table 1.
DISCUSSION
Longitudinal trends in plastic surgery research are a recent focus based on current literature. In a recently published study outlining 20-year research contributions within Plastic and Reconstructive Surgery, Esmaeeli et al3 describe that despite an increasing trend in original articles published from the United States, there is a decreasing proportion of aesthetic surgery research. Regarding our study of funded research, our data contradict these findings within Plastic and Reconstructive Surgery; the number of funded articles within ASJ is increasing, and US-based research was found to significantly correlate with this positive trend.
The impact of aesthetic surgery research on long-term innovation and practice paradigms has also been called into question. Based on the analysis of citation volume and level of evidence conducted by Tang et al,4 a significant gap appears to exist between aesthetic and reconstructive surgery research. The majority (56%) of the most-cited research articles within the 2016 Web of Science Journal Citation Reports were in reconstruction, with aesthetic surgery research accounting for only 11% of most-cited articles.4 Profound as this result may seem, only 1 study from the 2010s was included, and ASJ was not included within the analysis. Although this is likely because ASJ was not indexed until 2009, it is now currently within the top 5 most-cited plastic surgery journals within Web of Science. Furthermore, the utilization of citation volume by Tang et al as a surrogate marker for research innovation can disproportionally curb the impact of recently published landmark publications; citation volume grows the longer an article is available for citation. Whereas the authors hypothesize that a lack of industry support among surgeons in private practice may be a potential cause for their reported gap in aesthetic surgery research innovation, our findings do not support this notion. By contrast, the majority of articles included in our analysis were externally funded by industry, with 87% of private practice–based studies receiving industry funding. These results show that industry funding is robust based on aesthetic surgery research within the last decade. Lastly, when assessing the impact of funded articles included in this study, analysis of citation volume and level of evidence revealed no significant differences based on funding sources, agencies, or practice setting.
The notion that aesthetic surgery research follows money is not new. In 2007, Loonen et al2 noted an increase in aesthetic surgery research from 1972 to 2004. The authors hypothesized that an increasing number of private cosmetic surgery centers may propel more aesthetic surgery research as time progresses. Current data from The Aesthetic Society, subsequent literature, as well as our current findings within ASJ do little to support this notion.3,4 According to the most recent Aesthetic Plastic Surgery National Databank annual report, over 4.5 million aesthetic procedures were performed in the United States in 2019, with 5-year trends showing increasing rates of surgical and nonsurgical procedures; expenditures from all aesthetic surgery procedures totaled over $8 billion dollars for 2019 alone.6 If aesthetic procedures are increasing and generating such significant revenue, one would expect an increase in published aesthetic surgery research utilizing internal funding. Our results fail to illustrate this trend; not only have internally funded aesthetic surgery studies from all research settings remained relatively stagnant, but private practice studies were found to rely more heavily on external funding, predominantly from private industry.
Studies premised on industry-based research funding for internal development purposes among private or publicly shared for-profit companies are significantly outnumbered by articles sourced from academic and private practice institutions: private industry–sourced studies peaked in 2016-2017, accounting for only 7% of articles published during this time. Some potential factors may explain this finding. Private industry–based research may be performed for the purpose of securing patents or developing new commercially successful medical devices or therapies, and publication of such intellectual properties could expose classified company information to competitors. Furthermore, although companies conducting research may have an ethical obligation to publish their findings regardless of outcome, private industry may potentially withhold their data from publication when negative outcomes occur; such practices may yield significant bias and potentially contribute to inappropriate medical decisions. Although very limited information regarding this phenomenon can be found in the plastic surgery literature, this dissemination bias has been researched in oncology. In a study conducted by Krzyzanowska et al,7 pharmaceutical company sponsorship was found to be associated with a significantly higher rate of clinical trial publication; this is contrary to prior literature showing decreased publication rates among clinical trials financed by the pharmaceutical industry. Although it is possible that dissemination bias may be contributing to the significantly lower proportion of industry-based articles within ASJ over the last 10 years, data within the current study are insufficient to draw such a conclusion because unpublished studies were not evaluated. Based on the recommendations published by the O.P.E.N. Project, an international consensus meeting on reducing dissemination bias, when evaluating new medical devices or therapies, the interest of patients and the general public should always supersede commercial interests.8
Our findings, illustrating a lack of financial diversity in research funding among articles published from private practice researchers, are likely multifactorial in origin. One study comparing academic and private practice surgeons revealed that academic surgeons allot significantly more time for research activities (5 vs 0 median hours per week, P < 0.001).9 Furthermore, the most common reason surgeons seem to pursue private practice is a general lack of interest in academia.9 Conversely, lack of private practice affiliation among academic plastic surgeons is significantly correlated with higher individual h-indices, a marker for research output and quality.10,11 It is plausible to consider that more time dedicated for research as well as more robust curricula vitae among academic surgeons could potentially lead to more research funding opportunities from multiple agencies, particularly in the case of government grants, whereby no private practice-based articles in our study were financially supported by government agencies. Surgeons at academic centers may also self-select for research projects requiring funding. Academic-based surgeons could be more motivated to submit grants and publish papers to seek promotion or achieve tenure. This tendency could be further compounded by the increasing current competitiveness for grants or the fact that academic centers may have more resources to aid in the grant application process. Furthermore, more academic-based programs are embracing aesthetic surgery practices. As outlined in a recent study conducted by Perdikis et al,12 although academic programs have traditionally embraced only reconstruction-based practices, this is now no longer the case; aesthetic surgery is growing within academic programs to promote resident education, diversify faculty practice, and increase departmental/divisional funding. Private industries may be shifting their funding strategies away from private practices and toward large academic centers with large or growing aesthetic surgery practices. In theory, this practice would shift the burden of patient recruitment away from industry and promote studies with large patient volumes that could be further backed by the authority of trusted big-name academic centers. Although the results of this study outline significant differences in aesthetic surgery research funding based on sources and practice setting, more specific surgeon, industry, and institution-specific factors still warrant further investigation to assess for confounding factors not considered in this study.
This study has notable limitations. First, we limited our analysis to only publications within ASJ; we did this because ASJ is a top-tier plastic surgery journal focusing solely on aesthetic surgery research, creating a more level and uniform sample of aesthetic surgery studies for evaluation while minimizing the potential confounding nature of journal variations. This methodology does, however, limit the conclusions that may be drawn regarding aesthetic surgery research published in other journals. Second, our results are contingent on self-reported funding sources from the authors of the included studies. If the authors failed to report a funding source, our methodology may result in aberrant exclusion of such studies; we sought to minimize this limitation with individualized review of articles to determine if funding entities stated in the text were not reported in Web of Science. Additionally, the relatively small number of research studies conducted by industry sources, without academic or private practice involvement, limits the conclusions that can be drawn from purely industry-driven research. Lastly, the potential reasons for declining rates of funded research from private practice outlined within this study were drawn from a systematic review of current literature; additional data regarding surgeon- and practice-specific variables could further elicit potential factors at work in this trend. To better identify barriers to research among aesthetic surgeons, we plan to follow-up our findings with additional research to determine strategies encouraging more research within aesthetic surgery.
CONCLUSIONS
Despite reported disparities in plastic surgery research, overall 10-year trends within ASJ reveal that aesthetic surgery research continues to thrive. Studies backed by industry and government, as well as research foundations and societies, are increasing annually, highlighting the importance of these agencies in facilitating aesthetic surgery innovation. Although research studies continue to be supported with multiple financial modalities, compared with academic institutions, funded research in the private practice setting relies more heavily on investment by private industry. Furthermore, an increasing trend of funded research conducted at academic institutions is met, in contrast, by a significant reduction in funded articles from private practice researchers. Although a lack of funding diversity among private practice researchers may point to a fiscal cause for this finding, more research is necessary to better elucidate potential surgeon- and practice-specific factors affecting research output in the private sector. Plastic surgeons in private practice possess a trove of clinical data that might well yield important information on such subjects as patient safety and aesthetic outcomes. In spite of the availability of clinical data for research, the declining trend in research funding by private practice surgeons may reflect a disinterest in research, a lack of time, or a lack of knowledge regarding available resources. For private practice surgeons looking for available data resources, the Aesthetic Society’s Aesthetic Neural Network is a database with clinical data available to facilitate research in the private practice setting.13 Surgeons in private practice should also be encouraged to explore research funding resources through their membership in national societies.
Disclosures
The authors declared no potential conflicts of interest with respect to the research, authorship, and publication of this article.
Funding
The authors received no financial support for the research, authorship, and publication of this article.

