


Abstract
Achieving an aesthetic phalloplasty result is important for patients with acquired or congenital defects of the penis, or with genital-related dysphoria. However, aside from length and girth, the aesthetic proportions of the male penis have not been defined.
This study aimed to determine proportions of the male penis through photogrammetric analysis of nude male photographs and to verify these proportions with a crowdsourcing-based survey.
Nude male photographs (n = 283) were analyzed to define aesthetic proportions of the male penis. Photographs were analyzed for the position of the penis on the torso in relation to the umbilicus and for the ratio of the dorsal and ventral glans of the penis in relation to the entire shaft length. Proportions were then further studied by crowdsourcing 1026 respondents with Amazon mechanical Turk.
The ideal position of the penis below the umbilicus is about 55% (6/11th) of the distance from the jugular notch to the umbilicus (measured average, 53.6%; survey-weighted average, 58.9%). The dorsal glans of the penis is about 33% (1/3rd) of the length of the entire shaft (measured average, 32.1%; survey-weighted average, 37.5%). The ventral glans of the penis is about 12.5% (1/8th) of the length of the entire shaft (measured average, 12.6%; survey-weighted average, 11.7%).
Measured proportions of the human penis follow exact fractions. Crowdsourcing data helped support photogrammetric analysis, with survey-preferred ratios within 5% of measured ratios. With further validation, these data can aid surgeons performing phalloplasty.
For millennia, scientists have thought that the human body follows certain prescribed proportions. These aesthetic ideals—reported as early as the first century A.D. by Roman architect Marcus Vitruvius Pollio and popularized by Leonardo Da Vinci’s Vitruvian Man in the 15th century—have helped guide surgical reconstruction ever since. Aesthetic proportions have been further refined for many parts of human anatomy, including the face,1,2 breasts,3-5 limbs,6 and female genitalia.7 Nevertheless, aside from length and girth,8-10 the proportions of male genital anatomy have been largely overlooked. Through surgical advancement, the total surgical reconstruction of a functional penis is now possible with phalloplasty. Thus, there is a need to define reconstructive and aesthetic ideals for the penis.
Phalloplasty is a complex reconstructive procedure that reliably creates a fully functional phallus.11,12 The ideal phalloplasty result is aesthetic, functional, and carries minimal donor-site morbidity. Achieving an aesthetic and functional result can prevent serious physical and psychological consequences in patients with acquired (eg, penile cancer, traumatic penile injury) or congenital defects of the penis.13 In addition, an increasing number of transgender patients seek phalloplasty to alleviate gender dysphoria.14,15
Despite the technical complexity of phalloplasty, there are no published clinical guidelines for optimal aesthetic proportioning of the penis. Given the importance of sexual satisfaction and appearance to overall patient quality of life after phalloplasty, we argue that defining aesthetic preferences is an important step to optimizing surgical outcomes. Although reported satisfaction rates for phalloplasty are high across patient populations, few studies have correlated satisfaction with aesthetic outcomes.11,16-20 One study did find that transmasculine individuals shared concerns about quality of phalloplasty, including dissatisfying appearance.21
Our study aimed to generate clinically relevant aesthetic recommendations for the penis. Thus, we focused on the position of the penis on the body and the relative size of the glans—2 key variables that the surgeon controls in phalloplasty. Photogrammetric analysis and crowdsourced surveys were used to define ratios for these variables. Further validation of these ratios in patients who seek phalloplasty, whether for congenital conditions, gender affirmation, or posttraumatic reconstruction, is required. However, the clinical recommendations derived from this study would be the first to guide surgeons performing and patients seeking phalloplasty through a modelled definition of standardized penis aesthetics.
METHODS
Photograph Analysis
Images from Playgirl magazine from 1973 to 1995 were retrieved from an open-source website in November 2018.22 The included photographs were of white and non-white models. A total of 223 flaccid and 60 erect penises were analyzed with ImageJ (National Institutes of Health, https://imagej.nih.gov/ij/) by 2 independent reviewers (R.S. and I.T.N). The following 4 photogrammetric measurements were taken: (1) externally visible total penile length; (2) glans length (dorsal or ventral); (3) distance from the top of umbilicus to the top of the shaft of the penis; and (4) distance from the jugular notch to the top of umbilicus (Figure 1). Three ratios were calculated: (1) (umbilicus to shaft length):(jugular notch to umbilicus length); (2) (dorsal glans length):(total penile length); and (3) (ventral glans length):(total penile length) (Figure 1).
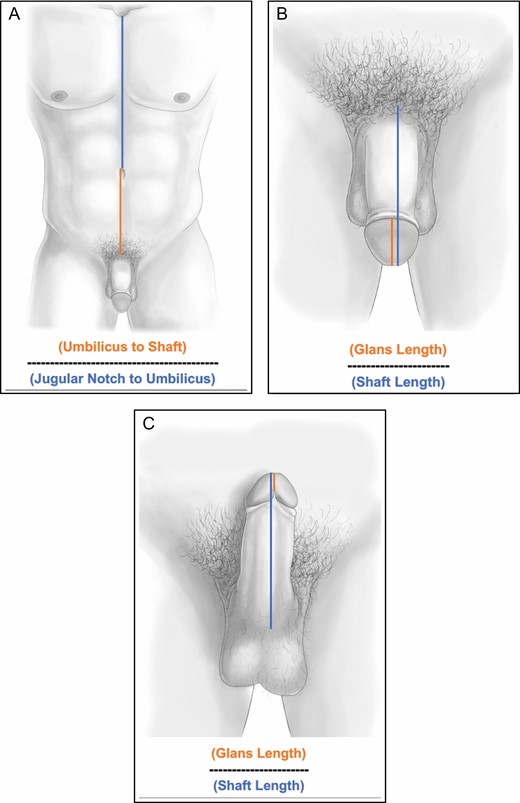
(A) Torso position: the location of the penis on the torso was defined as a ratio of the distance from the umbilicus to the top of the shaft of the penis (orange line) divided by the distance from the jugular notch to the umbilicus (blue line). (B) Dorsal glans ratio: the ratio of the dorsal glans was defined as the length of the glans of the penis divided by the length of the entire externally visible penis. (C) Ventral glans ratio: the ratio of the ventral glans was defined as the length of the glans of the penis divided by the length of the entire externally visible penis. Note that the ventral glans is defined at the confluence of the 2 heads of the ventral glans.
Interrater reliability coefficients were calculated between the 2 reviewers to ensure adequate correlation.
Survey
A medical illustrator (M.S.) created 3 sets of illustrations, depicting the position of the penis on the torso, the dorsal glans ratio, and the ventral glans ratio. In each set, the ratio was varied to create 5 illustrations depicting different penis positions and glans sizes; only 1 variable was altered at a time (Figure 2). Nonaltered variables were based on the standardized measurements from the photogrammetric portion of the study. In an effort to decrease other bias, the drawings were kept in a light gray color with the same muscularity and body hair. These illustrations were integrated into a randomized anonymous survey created in Google Forms (Mountain View, CA). Randomization was performed by assigning each photograph a number between 1 and 5, after which a random number generator was used 5 times to order the images for each survey iteration. One of the 5 iterations of the final survey is displayed in Appendix 1. For each set of randomized drawings, the participant was asked which image was the most aesthetically pleasing. The survey also included demographic questions (eg, age, sex assigned at birth, gender identity, sexual orientation, race/ethnicity, country of residence, highest education level). The surveys were disseminated through MTurk (Amazon Mechanical Turk, Seattle, WA) in September 2019. Only workers with greater than a 97% “task approval rate” were eligible to complete the survey. This strategy has been used in plastic surgery research with MTurk to create a check against workers who may erroneously click through surveys for compensation.19 Workers were compensated $0.50 for completion of the survey.
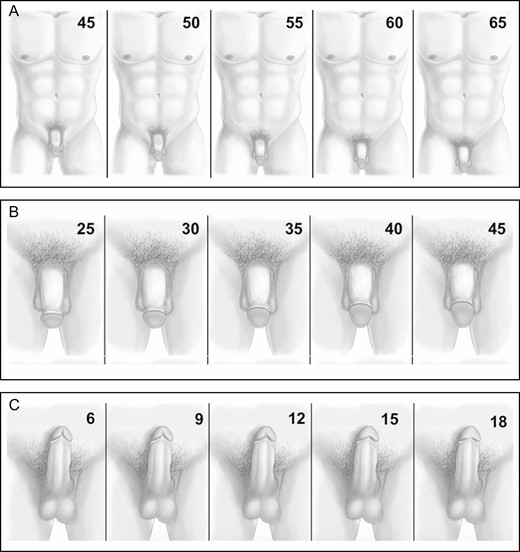
(A) Varying positions of the penis on the torso. Numbers in the upper right corner represent the ratio of the umbilicus to shaft distance divided by the jugular notch to umbilicus distance. Note: numbers were not present on photographs sent to survey respondents. All numbers represent a percentage. (B) Varying dorsal glans ratios. Numbers in the upper right corner represent the ratio of the dorsal glans length divided by the total externally visible penile length. Note: numbers were not present on photographs sent to survey respondents. All numbers represent a percentage. (C) Varying ventral glans ratios. Numbers in the upper right corner represent the ratio of the ventral glans length divided by the total externally visible penile length. Note: numbers were not present on photographs sent to survey respondents. All numbers represent a percentage.
Data Collection and Statistical Analysis
All statistical analyses were performed in SPSS version 26 (IBM, Armonk, NY) and Prism version 8 (GraphPad, San Diego, CA). Continuous data were presented as mean and 95% CIs. Interrater reliability was calculated by a Pearson correlation coefficient. Proportional data were reported as a percentage of the whole. Survey data were collected as discrete counts of preferred ratios. Weighted averages were calculated from these discrete counts and reported as means and 95% CIs. Pairwise continuous variables were compared with a 2-way unpaired Student’s t test and variables with more than 2 independent variables were compared with 1-way analysis of variance. Significance allowed for a type 1 error of α = 0.05.
RESULTS
Aesthetic ideals were calculated from nude male photographs
A total of 283 nude photographs (n = 223 flaccid, n = 60 erect) were analyzed for the ideal position of the penis on the torso (Figure 3A). Overall, the measured average position of the penis below the umbilicus on the torso was 53.6% of the distance from the jugular notch to umbilicus (95% CI, 53.6%-54.3%) (Figure 3A, gray bar). Flaccid penises (95% CI, 54.0%-54.8%) and erect penises (95% CI, 52.1%-53.6%) had similar positions on the torso (Figure 3A, peach and dark blue bars).

(A) Torso position: the position of the penis on the torso was measured from nude photographs. Mean and 95% CIs are reported for all photographs (overall) and for photographs stratified by flaccid and erect. (B) Dorsal glans ratio: the dorsal glans ratio was measured from nude photographs. Mean and 95% CIs are reported for all photographs (overall) and for photographs stratified by flaccid and erect. (C) Ventral glans ratio: the ventral glans ratio was measured from nude photographs. Mean and 95% CIs are reported for all photographs (overall) and for photographs stratified by flaccid and erect. All dots on graphs represent individual measurements, and graphs are plotted as means with 95% CIs. umbo, umbilicus; JN, jugular notch.
A total of 170 photographs (n = 146 flaccid, n = 24 erect) were analyzed for the ideal ratio of the dorsal glans of the penis (Figure 3B). Overall, the measured average length of the dorsal glans was 32.1% of the length of the entire externally visible penile length (95% CI, 31.1%-33.1%) (Figure 3B, red bar). The dorsal glans of the penis was proportionally larger in the flaccid state (mean 33.0%) vs the erect state (mean 26.9%) (Figure 3B, orange and yellow bars). For flaccid images, the measured dorsal glans ratio was also plotted against a ratio of the penis length over the jugular notch to umbilicus distance to explore variation in glans proportion with penis size (Supplemental Figure 1).
A total of 31 photographs (n = 7 flaccid, n = 24 erect) were analyzed for the ideal ratio of the ventral glans of the penis (Figure 3C). Overall, the measured average length of the ventral glans was 12.6% of the length of the entire externally visible penile length (95% CI, 10.7%-14.4%). Again, the ventral glans of the penis was proportionally larger in the flaccid state (mean 19.4%) vs the erect state (mean 10.5%) (Figure 3C, orange and yellow bars).
Interrater reliability as measured by Pearson correlation coefficient was r = 0.930 for measurements from the jugular notch to the umbilicus, r = 0.953 for measurements from the umbilicus to the shaft, r = 0.847 for measurements of dorsal glans length, r = 0.837 for measurements of ventral glans length, and r = 0.950 for measurements of externally visible penile length.
Aesthetic Ideals Were Crowdsourced From the General Population
We received 1026 survey responses from Amazon MTurk. Full demographic data of the MTurk respondents is given in Table 1. The majority of respondents were between the ages of 21 to 39 years (n = 728, 70.9%), were assigned the male sex at birth (n = 646, 62.9%), identified as heterosexual/straight (n = 817, 79.6%), identified their race/ethnicity as white (n = 618, 60.2%), resided in the United States (n = 787, 76.7%), and their highest degree of education included a bachelor’s degree (n = 498, 48.5%).
Demographic Characteristics of Survey Respondents on MTurk
| MTurk respondents (n = 1026) | |
|---|---|
| Age, years | |
| <17 | 0 (0) |
| 18-20 | 14 (1.4) |
| 21-29 | 346 (33.7) |
| 30-39 | 382 (37.2) |
| 40-49 | 176 (17.2) |
| 50-59 | 74 (7.2) |
| > 60 | 34 (3.3) |
| Sex assigned at birth | |
| Male | 646 (62.9) |
| Female | 379 (36.9) |
| Intersex | 1 (0.2) |
| Gender identity | |
| Man | 635 (61.9) |
| Woman | 372 (36.3) |
| Transgender man | 2 (0.2) |
| Transgender woman | 4 (0.4) |
| Nonbinary/genderqueer | 9 (0.9) |
| Agender | 2 (0.2) |
| Another identity not listed above | 2 (0.2) |
| Sexual orientation | |
| Heterosexual/straight | 817 (79.6) |
| Homosexual/gay or lesbian | 40 (3.9) |
| Bisexual | 143 (13.9) |
| Asexual | 11 (1.1) |
| Pansexual | 10 (1) |
| Another orientation not listed above | 2 (0.2) |
| Don’t know | 3 (0.3) |
| Race/ethnicity | |
| American Indian or Alaska Native | 7 (6.8) |
| Asian | 257 (25) |
| Black or African American | 74 (7.2) |
| Hispanic, Latino, or Spanish origin | 56 (5.5) |
| Middle Eastern or North African | 1 (0.1) |
| Native Hawaiian or Other Pacific Islander | 5 (0.5) |
| White | 618 (60.2) |
| Other | 8 (7.8) |
| Country of residence | |
| Brazil | 14 (1.4) |
| Canada | 10 (1) |
| Estonia | 1 (0.1) |
| Greece | 1 (0.1) |
| India | 191 (18.6) |
| Indonesia | 1 (0.1) |
| Italy | 3 (0.3) |
| Mexico | 1 (0.1) |
| Netherlands | 1 (0.1) |
| Nigeria | 1 (0.1) |
| Philippines | 2 (0.2) |
| Romania | 1 (0.1) |
| Slovakia | 1 (0.1) |
| Spain | 1 (0.1) |
| United Kingdom | 9 (0.8) |
| United States | 787 (76.7) |
| Vietnam | 1 (0.1) |
| Highest level of education | |
| Less than high school diploma | 9 (1) |
| High school diploma/GED | 113 (11) |
| Some college or associate/trade degree | 267 (26) |
| Bachelor’s degree | 498 (48.5) |
| Master’s degree or higher | 139 (13.5) |
Values are n (%). GED, General Educational Development Test.
Respondents preferred a penis located a distance below the umbilicus that was equal to 65% of the distance from the jugular notch to the umbilicus (35.2% of respondents, Figure 4A, blue section), compared to measured photographs where the ideal was 53.6% (Figure 5A, dotted pink line). The survey-weighted average preferred ratio of the position of the penis on the torso was 58.9% (Figure 5A, dotted black line), and varied significantly based on assigned sex at birth (P = 0.020), sexual orientation (P = 0.004), ethnicity (P < 0.0001), country of residence (P < 0.0001), and education level (P = 0.003) [Figure 5a].
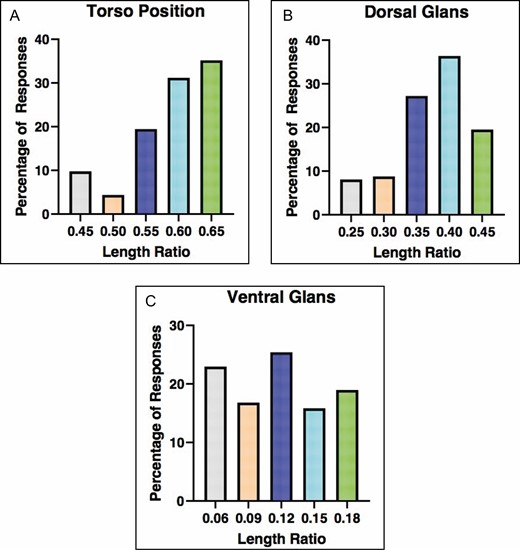
(A) Bar graph representing the preferred ratio for the position of the penis on the torso: 45% (gray), 50% (peach), 55% (dark blue), 60% (light blue), 65% (green). (B) Bar graph representing the preferred ratio of the dorsal glans: 25% (gray), 30% (peach), 35% (dark blue), 40% (light blue), 45% (green). (C) Bar graph representing the preferred ratio of the ventral glans: 6% (gray), 9% (peach), 12% (dark blue), 15% (light blue), 18% (green). Percentages for all charts designate the percentage of total survey respondents who indicated the given ratio was the most aesthetically pleasing.
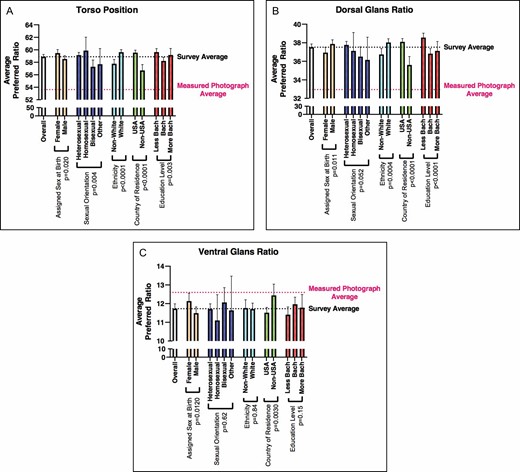
(A) Average preferred ratios of the penis stratified by patient demographics for position on the torso. (B) Average preferred ratios of the penis stratified by patient demographics for dorsal glans ratio. (C) Average preferred ratios of the penis stratified by patient demographics for ventral glans ratio. For all graphs means and 95% CIs are plotted. Results were stratified by assigned sex at birth (red bars), sexual orientation (orange bars), ethnicity (yellow bars), country of residence (green bars), and education level (blue bars). P values are indicated on all graphs. Demographics with pairwise variables were compared with a 2-way unpaired Student’s t test and demographics with more than 2 variables were compared with 1-way analysis of variance. Dotted lines on the graphs represent the average preferred ratio from survey respondents (black line) and the average measured ratio from nude photographs (pink line). Less bach, less than a bachelor’s degree; bach, bachelor’s degree; more bach, more than a bachelor’s degree.
Respondents preferred a dorsal glans length that was 40% of the total shaft length (36.4% of respondents; Figure 4B, green section), compared to measured photographs were the ideal was 32.1% (Figure 5B, dotted pink line). The survey-weighted average preferred ratio of the dorsal glans was 37.5% (Figure 5B, dotted black line), and varied significantly based on assigned sex at birth (P = 0.011), ethnicity (P = 0.004), country of residence (P < 0.0001), and education level (P = 0.0001) (Figure 5B).
Respondents preferred a ventral glans length that was 12% of the total shaft length (25.4% of respondents; Figure 4C, yellow section), similar to measured photographs where the ideal ventral glans ratio was 12.6% (Figure 5C, dotted pink line). The survey-weighted average preferred ratio of the ventral glans was 11.7% (Figure 5C, dotted black line), and varied significantly based on assigned sex at birth (P = 0.0120) and country of residence (P = 0.0030) [Figure 5c].
Discussion
Surgeons often rely on established aesthetic ideals to guide surgery of the face,1,2 breasts,3-5 vulva,7 and other body parts.6 Both scientifically and colloquially, there has been a long-standing interest in penis size.8,23,24 However, standardized measurements of the penis have not been determined except for length and girth, and these data are only some of the measurements needed for penile reconstruction. Phalloplasty is a reconstructive procedure that aims to create an aesthetic and functional phallus. Whether in cismale, nonbinary, or transgender patients, the reconstruction of a phallus that is aesthetically pleasing is a primary goal. Therefore, in this study we chose to focus on proportions of the penis that are important to the reconstructive surgeon and can be directly controlled in the operating room.
When counseling patients to undergo phalloplasty, questions about desired length and girth of the neophallus are requisite.25 Length is often driven by patient preference, and girth may be partially dictated by the patient’s body habitus and choice of flap (ie, the anterior lateral thigh flap results in a bulkier neophallus than the radial forearm flap). Therefore, decisions about neophallus length and girth are somewhat outside of the surgeon’s control. We decided to focus on 3 aspects of phalloplasty that are directly within the surgeon’s control in the operating room: (1) the position of the neophallus on the human torso; (2) the proportions of the dorsal glans of the penis; and (3) the proportions of the ventral glans of the penis. Anecdotally, we have observed that the positioning of the neophallus on the body and the shaping of the glans are largely driven by surgeon “artistic feel” rather than scientific reasoning. Thus, we aimed to generate clinical recommendations that may guide these portions of the phalloplasty procedure.
Our overall goal was to crowdsource the general population to elucidate their ideal of aesthetic preferences of the human penis. Similar studies have been used to examine preferences of thigh aesthetics and cleft lip.26,27 However, with no a priori estimates for the ideal proportions of the human penis, we first needed to establish a baseline. Therefore, we examined over 200 nude photographs from Playgirl magazine in both a flaccid and erect state to help define aesthetic standardized measurements. From this work, we defined 3 critical ratios:
55% (fraction: 6/11th): the male penis tends to be located below the umbilicus a distance that is ~55% of the length from the jugular notch to the umbilicus.
33% (fraction: 1/3rd): the dorsal glans of the male penis tends to be about 1/3rd the length of the entire externally visible penile length.
12.5% (fraction: 1/8th): the ventral glans of the male penis tends to be about 1/8th the length of the entire externally visible penile length.
With these measured ideals established, we then crowdsourced over 1000 people in the general population to see if they were in agreement. For both the position of the penis on the body (measured ideal ~55% vs surveyed ideal ~59%) and the dorsal glans ratio (measured ideal ~33% vs surveyed ideal ~38%) there was a slight disagreement between the measured ideal and survey ideals. However, for the ventral glans ratio there was agreement between the measured and survey ideals (measured ideal 12.5% vs surveyed ideal 11.7%). The clinical significance of these discrepancies that are within 5% remains to be proven.
Interestingly, although the position of the penis on the torso and dorsal glans ratio did show clear preferences in the survey, the preferred ventral glans ratio was more fragmented. As conjecture, this part of the penis is less visible in the resting flaccid state, and therefore the human mind may have had less impetus to establish an aesthetic norm for this part of the penis. It also should be noted that for every ratio examined, there were significant differences in preferences based on survey respondent demographics. However, in most instances, these significant differences correlated to ratio differences of <5%.
Although these ratios may be used as a blueprint, they should be tailored to each patient. There was considerable variability in surveyed preferences for each ratio. For example, although 65% was the most common ratio for phallus-to-umbilicus distance (35.2% of respondents), a significant portion preferred a ratio of 60% (31.2% of respondents) and 55% (19.5% of respondents). Similar variability was seen in the dorsal and ventral glans ratios. In addition, certain patients have body habitus considerations that may require modulation of their preferred phallic ratios. For example, a patient with a large overhanging pannus may require lower placement of the phallus. Thus, an important next step is to validate the ratios modeled in this study through qualitative research engaging patients who are seeking or have had phalloplasty, as well as through correlation with aesthetic ratio and postoperative patient-reported outcomes.
This study has several limitations. First, we acknowledge that the open-source acquisition of Playgirl photographs was less than ideal. However, we aimed to analyze a robust set of nude photographs, of both white and non-white models, to establish baseline ratios that would inform the creation of drawings to survey the general population. In addition, we sought a set of photographs that did not cater to one artist’s individual preferences. A second major limitation was the focus of this study on the circumcised male penis. Glans ratios become inherently more visible in the circumcised penis, but the majority (~70%) of the world is uncircumcised.28,29 Nevertheless, as many patients seeking phalloplasty do request glansplasty, we still find this information to be informative. In addition, even in the uncircumcised state, the glans is an anatomic portion of the penis, and this study aids knowledge of its anatomy. A third major limitation of this study was the reliance on drawings to survey the general population. These drawings may not have reflected actual portrayals of the male penis. However, we felt this was necessary to keep our survey from being overtly pornographic. In addition, drawings were sent out in a manner that portrayed a Caucasian (white) penis. This may have incited cognitive biases in responses. Finally, as noted above, there were significant differences in preferred ratios that varied with survey respondent demographics and the demographics of MTurk respondents do not necessarily mirror characteristics of the patient population seeking phalloplasty. However, it was beyond the scope of this study to comment on the preferences of any demographic group in a more granular nature, and we emphasize the need for further research to validate these ratios in specific clinical populations.
Conclusions
In conclusion, humankind has been fascinated with the proportions of the human body for millennia. In this study we offer the first characterization of aesthetic ideals for the human penis. In measured photographs, we found that proportions follow exact fractions: (1) the distance of the penis below the umbilicus is 6/11th of the distance from the jugular notch to the umbilicus; (2) the length of the dorsal glans of the penis is 1/3rd the length of the total externally visible penis; (3) the length of the ventral glans of the penis is 1/8th the length of the total externally visible penis. Survey data helped support these findings, with aesthetically preferred ratios all within 5% of measured ratios. Overall, we intend for these data to contribute to scientific knowledge on human proportion, to aid the reconstructive surgeon performing phalloplasty, and to form a baseline on which further research can be done to understand aesthetic preferences among patients who undergo phalloplasty.
Acknowledgments
The authors would like to thank Kathleen Berfield, MD, for her suggestions on measurement ratios along the torso.
Disclosures
The authors declared no potential conflicts of interest with respect to the research, authorship, and publication of this article.
Funding
The authors received no financial support for the research, authorship, and publication of this article.
References
World Health Organization.

