


Abstract
The observed positive diversity effect on ecosystem functioning has rarely been assessed in terms of intraspecific trait variability within populations. Intraspecific phenotypic variability could stem both from underlying genetic diversity and from plasticity in response to environmental cues. The latter might derive from modifications to a plant’s epigenome and potentially last multiple generations in response to previous environmental conditions. We experimentally disentangled the role of genetic diversity and diversity of parental environments on population productivity, resistance against environmental fluctuations and intraspecific phenotypic variation.
A glasshouse experiment was conducted in which different types of Arabidopsis thaliana populations were established: one population type with differing levels of genetic diversity and another type, genetically identical, but with varying diversity levels of the parental environments (parents grown in the same or different environments). The latter population type was further combined, or not, with experimental demethylation to reduce the potential epigenetic diversity produced by the diversity of parental environments. Furthermore, all populations were each grown under different environmental conditions (control, fertilization and waterlogging). Mortality, productivity and trait variability were measured in each population.
Parental environments triggered phenotypic modifications in the offspring, which translated into more functionally diverse populations when offspring from parents grown under different conditions were brought together in mixtures. In general, neither the increase in genetic diversity nor the increase in diversity of parental environments had a remarkable effect on productivity or resistance to environmental fluctuations. However, when the epigenetic variation was reduced via demethylation, mixtures were less productive than monocultures (i.e. negative net diversity effect), caused by the reduction of phenotypic differences between different parental origins.
A diversity of environmental parental origins within a population could ameliorate the negative effect of competition between coexisting individuals by increasing intraspecific phenotypic variation. A diversity of parental environments could thus have comparable effects to genetic diversity. Disentangling the effect of genetic diversity and that of parental environments appears to be an important step in understanding the effect of intraspecific trait variability on coexistence and ecosystem functioning.
INTRODUCTION
Positive relationships between biodiversity and ecosystem functioning have been demonstrated repeatedly in many observational and experimental studies. This body of research has found that higher diversity is generally associated with higher productivity, stability and resistance to disturbances/stresses (Balvanera et al., 2006; Marquard et al., 2009). Most of this research has commonly measured biodiversity at the community level as interspecific diversity, in terms of both taxonomic and functional trait diversity (Marquard et al., 2009; Hector et al., 2010). In contrast, the effect of intraspecific diversity within populations has been generally overlooked. However, the effects of intraspecific diversity on population and ecosystem functioning can be of comparable magnitude to those of interspecific diversity (Crutsinger et al., 2006; Hughes et al., 2008; Liancourt et al., 2015), and phenotypic variation within species is sometimes as large as that observed among species (Hughes et al., 2008; Messier et al., 2010; Albert, 2015; Siefert et al., 2015).
Evidence suggests that intraspecific diversity has a positive effect on the productivity and resistance to disturbances/stresses of populations (Bolnick et al., 2011; Latzel et al., 2013; Zuppinger-Dingley et al., 2014). These effects have been generally interpreted as the result of contrasting phenotype and diversity in functional traits between coexisting individuals, which should lead to decreased competition and enhanced complementarity in resource use (altough this hypothesis has been mostly tested in studies comparing different species, e.g. Reich et al., 2001; Fridley. 2001, 2003; Díaz et al., 2007; Zuppinger-Dingley et al., 2014; Gross et al., 2017). Moreover, intraspecific trait variation has been most often attributed to genetic variation. As a result, experiments have mostly manipulated the genetic diversity of the populations by modifying the number of genotypes of the populations (Zhu et al., 2000; Booth and Grime, 2003; Reusch et al., 2005; Crutsinger et al., 2006; Hughes et al., 2008; Kotowska et al., 2010; Cook-Patton et al., 2016). However, intraspecific trait differences, and thus functional trait diversity, can also be generated by phenotypic plasticity in response to environmental cues. Furthermore, this effect might not occur only within the life cycle of an organism but also across generations through transgenerational plasticity (Turcotte and Levine, 2016).
Phenotypic plasticity is generally defined as the variation in trait expression observed in a genotype that is influenced by the environment (Sultan and Stearns, 2005; Bradshaw, 2006), which allows the organism to respond to environmental fluctuations. Such environmental variation could promote phenotypic changes to the organism subjected to those conditions (referred to as within-generation plasticity) and even be heritable, meaning that the environmental conditions experienced by the parents modify progeny phenotype (also referred to as parental or transgenerational effects). These ‘non-genetic’ mechanisms of phenotypic plasticity (within or across generations) may result from underlying epigenetic modifications (Richards et al., 2010; Herman and Sultan, 2011). Epigenetic modifications are known to occur in response to environmental factors (Herman and Sultan, 2016; Richards et al., 2017), to cause trait variation (Cubas et al., 1999; Latzel et al., 2012; Zhang et al. 2013, 2018) and sometimes to be transmitted to following generations (Akimoto et al., 2007; Bossdorf et al., 2008; Verhoeven et al., 2010), being a key mechanism of transgenerational effects (Herrera et al., 2012; Herman et al., 2014). Epigenetic variation could be enabled by various mechanisms that modify the expression of the DNA without modifying its underlying sequence (e.g. histone modification, RNA interference and DNA methylation). Among these mechanisms, although probably not the most significant, DNA methylation is the most well studied and best understood within ecology and evolution (Akimoto et al., 2007; Bossdorf et al., 2010).
The seminal work by Latzel et al. (2013) showed that epigenetic diversity can increase the productivity and stability of plant populations. Nevertheless, Latzel et al. manipulated the epigenetic diversity by creating populations of differing number of epigenetic recombinant inbred lines (epiRILs) of Arabidopsis thaliana with highly variable DNA methylation, originated by artificial crossings of Columbia wild type and mutants with decreased genome-wide DNA methylation. This approach, while useful, cannot be fully and realistically compared to the epigenetic variation found in natural populations (e.g. induced by differences in parental environments). A way forward is to create experimental mixtures of organisms whose parents have experienced different environmental conditions. This approach can be further combined with new techniques of experimental demethylation of the populations that, by reducing the epigenetic variation of the individuals, could level-off the parental effects of different environmental imprints within a population (Puy et al., 2018). Comparing non-demethylated vs. demethylated populations would allow us to disentangle the relative effect of epigenetic variation from the overall parental effect and to test the effect of environmentally induced epigenetic diversity on phenotypic variability and the possible consequences on ecosystem functions.
The positive effect of diversity on ecosystem functions, such productivity (also called the positive ‘net diversity effect’), can be quantified easily by comparing how mixtures perform better than monocultures. Specifically, existing approaches (e.g. Loreau and Hector, 2001) compare the performance of individuals in a mixture to their ‘expected’ performances when growing in monocultures. For example, in a mixture of different genotypes, each genotype is compared to the biomass observed when grown alone (monoculture). Any positive net diversity effect (observed biomass in mixture higher than expected from monocultures) could be driven by two not mutually exclusive mechanisms: ‘selection’ and ‘complementarity’ (Loreau and Hector, 2001; Marquard et al., 2009; Tobner et al., 2016). Selection operates when a specific competitively superior individual is dominant in mixtures and drives disproportionately the functioning of the community (Loreau and Hector, 2001). By contrast, complementarity takes place when niche differences between coexisting individuals result in more efficient use of resources by the community and better functioning (Loreau and Hector, 2001). Because fitness and niche differences can be related to underlying plant functional traits, both mechanisms can be also approximated from a trait-based perspective (Cadotte, 2017). When selection is the main mechanism, we should expect to observe a dominance of particular traits and/or trait values associated with the competitive/fitness advantage (e.g. tall stature). On the other hand, diversity in trait values (functional diversity) related to resource foraging between individuals of the community would reflect that complementarity is the main mechanism driving the positive effect of diversity (Loreau and Hector, 2001; Cadotte, 2017). While an increase in functional diversity should enhance complementarity effects, phenotypic plasticity could either decrease or increase selection effects (Roscher et al., 2012).
Here, we summarize the results of a two-generation experiment on A. thaliana to test the role of genetic diversity and diversity of parental environments (i.e. populations consisting of individuals from parents that experienced diverse environments), in (1) affecting plant assemblage and productivity and resistance against environmental fluctuations of plant populations, and (2) creating intraspecific phenotypic variation. By experimental alteration of DNA methylation status of a subset of the populations we also aim to determine whether the effect diversity of parental environments could be based on epigenetic diversity. Further, we control the role of within-generational plasticity on modulating those effects. We hypothesize that, compared to the effect of genetic diversity, the effect of environmental diversity on population functioning will be weaker but still important; and that within-generational plasticity can partially compensate for both trans-generational and genetic diversity effects. Also, we test, for the first time, the relative effect of the two potential biodiversity mechanisms, complementarity and selection effects (Loreau and Hector, 2001; Marquard et al., 2009; Tobner et al., 2016), as potentially caused by either genetic or environmental diversity. Finally, we test whether traits (average and diversity of trait values in the populations) explain these diversity effects.
MATERIAL AND METHODS
Plant material
Four different genotypes of Arabidopsis thaliana L. were selected and provided by the Nottingham Arabidopsis Stock Centre (NASC): Col-1, Gue-0, Mer-6 and Vav-0. Because of the natural predominance of this species for self-fertilization, these genotypes are genetically adapted to specific environments and show unique ecologies (Alonso-Blanco and Koornneef, 2000). The Col-1 genotype was chosen because of its widespread use in genetic studies. The other three genotypes were selected from populations of the Iberian peninsula with differing moisture and fertility preferences due to their selection history and phenotypic variation (Picó et al., 2008; Méndez-Vigo et al., 2013): Gue-0 from the northern and marine-influenced part of the peninsula, and Mer-6 and Vav-0 from the southern and more continental part (NASC). Mer-6 and Vav-0 habitats differed in their fertilization influence: while the first population was located on a sandy area, the second was on a farm (NASC).
To ensure sufficient seed stock of the genotypes and to even out possible unknown transgenerational effects of previous cultivation in the NASC, we first grew all the genotypes in controlled conditions for one prior generation in populations of conspecifics of the same genotype (to maintain homogeneous genetic variation). Each population (one population per genotype) was established by transplanting 30 seedlings of the same genotype in 9-cm square plant pots with a volume of 0.5 L filled with a 2 : 1 mixture of sand and commercial soil, creating dense populations (similar to Latzel et al.,, 2013) with realistic population structure, allowing interactions between individuals. The seedlings were previously stratified for 1 week at 4 °C and germinated in sterilized potting mix. The 30 individuals within a pot were placed in a regular distribution, covering the whole surface with 6 columns × 5 rows of plants with equal space between individuals.
First generation: environmental imprinting
We ran the first generation where, following the methodology described above, we stablished three populations per genotype from the Iberian Peninsula (Gue-0, Mer-6 and Vav-0) and we grew all of them in identical control conditions to avoid any epigenetic variation in the offspring material. At the same time, nine populations of the Col-1 genotype were also created and grown under three different conditions (control, similar to Gue-0, Mer-6 and Vav-0, plus fertilization and waterlogging, with three populations each) to trigger transgenerational effects in the offspring and potentially generate offspring material with heritable epigenetic variation. The control conditions consisted of watering by sub-irrigation only when needed (i.e. once/twice per week). The fertilization treatment comprised the same watering regime as the control treatment but with the addition of fertilizer (Kristalon; NPK 15–5–30 + 3Mg + 5S) at the concentration of 300 ppm in each watering day. The waterlogging treatment consisted of constantly watered plants by sub-irrigation, ensuring constant wet surface of the soil. All the treatments started 7 d after the transplanting to ensure good establishment of the populations and lasted until all the plants produced seeds. At the end of the parental generation, seeds of each population were collected.
Second generation: diversity experiment
Seeds collected from the first generation were stratified for 1 week at 4 °C, and then germinated in sterilized potting mix. With this offspring generation, we ran a 1-month diversity experiment in which we stablished two types of populations of A. thaliana by, as in the previous generations, transplanting 30 seedlings in each pot. The populations could include either seedlings from the same or different genotype (genetic diversity), or from the same or different parental environmental conditions (diversity of parental environments). Transplanting allowed us to spatially arrange the populations, maximizing interactions between dissimilar individuals in mixtures (Supplementary Data Fig. S1) and to know their ‘origin’ (i.e. regarding either genotypes in genetic diverse mixtures, or parental environments in the mixtures of diverse parental environments).
The first type of population included varying levels of genetic diversity achieved by sowing individuals from one genotype (monocultures), and mixtures of the three genotypes (Mer-6, Gue-0, Var-0). Monocultures were replicated five times, and the mixtures replicated 15 times.
The second type of populations included varying levels of diversity of parental environments achieved by sowing individuals from single genotype (Col-1), but either from one parental origin (i.e. had experienced one specific environmental condition; monocultures) or mixing individuals coming from the three parental environments (control, fertilization and waterlogging). In this case, monocultures were replicated seven times, and the mixtures replicated 21 times. Besides triggering epigenetic heritable modifications, the parental environmental inductions could trigger transgenerational effects through other mechanisms such as generating differences in seed quality and hormonal balance (Herman and Sultan, 2011). We tested whether the diversity of parental environments was indeed based on epigenetic diversity by modifying the epigenetic variation of the plants and suppressing their epigenetic–parental status (Puy et al., 2018). Thus, another set of populations with the same number of pots (three monocultures replicated seven times and mixtures replicated 21 times) were demethylated via daily application of a 5-azacitidine onto the leaves (following the methodology of Puy et al., 2018). With this approach we intended to create population types with reduced epigenetic diversity compared to populations without demethylation.
All the combinations mentioned above were replicated three times, to grow the populations under three different environmental conditions (control, waterlogging and fertilization; described in the previous section). Thus, the final set-up finally comprised (5 + 7 + 7) × 3 monocultures and 15 + 21 + 21 mixtures × 3 environmental conditions = 342 experimental populations and 10 260 individuals of A. thaliana. Pot size, substrate, population density and the environmental conditions were the same as in the previous generations to ensure similar conditions.
Measured traits
At the time of harvest, 30 d after the establishment of the second generation, we measured survival and total dry biomass (radicular and aerial) of the 18 individuals closest to the edges in each pot, and survival and individual total dry biomass for each of the 12 central plants, as a measure of fitness. Additionally, to characterize niche differences between individuals with a manageable effort, we measured one key functional trait: specific leaf area (SLA; leaf area per dry mass, mm2 mg–1). SLA is a trait that relates to various functions, including resource foraging strategy of the plant and competitive ability, given that it correlates with potential relative growth and photosynthetic rate (Roscher et al., 2012; Kraft et al., 2014, 2015; Carmona et al., 2019). We estimated SLA by scanning the area of one to three leaves per plant and weighing the dry mass (after drying at 60 °C for 48 h). In mixtures we sampled the 12 central individuals, thus sampling four individuals of each of the three different origins (i.e. three genotypes in genetic diverse mixtures, or three parental environments in the mixtures of diverse parental environments). To maintain a consistent sampling effort, we sampled four individuals within monocultures. Sampling was done by choosing individuals situated in fixed positions to avoid subjective election from the researcher.
We calculated the average value and coefficient of variation (CV) of the traits (biomass and SLA) per population (i.e. of the whole pot/population), considering CV as a measure of functional trait diversity within a population (Albert et al., 2010). Within mixtures, we also estimated the average mean and CV separately per origin (e.g. a mean and CV per genotype).
With the plant biomass data we also calculated the net diversity effect on productivity and its additive components, selection and complementarity effects, following the well-known additive partitioning formula of Loreau & Hector (2001). The net diversity effect for a given mixture is the difference between the observed productivity (i.e. total dry biomass of a population) and the expected productivity, which is the productivity of the different origins that comprise the population in the corresponding monoculture. In our case, for example, the net diversity effect of a mixture with three genotypes grown in fertilized conditions is given by the difference between the observed productivity in that mixture (sum of the biomass of the three genotypes in the fertilized mixture, i.e. whole pot/population biomass) and the expected productivity from the same type of monoculture (average productivity of the three genotypes in their fertilized monoculture). As we knew the position of the different ‘origins’ within mixtures, and had measured the productivity of each individual separately, it was possible to apply the formula of Loreau & Hector (2001) that decomposed the net diversity effect into the effects due selection and complementarity (for further information and formulas see Loreau & Hector, 2001).
Statistical analysis
Phenotypic variation across origins. First, focusing only on the monocultures we assessed plasticity in population response to environmental conditions experienced in the second generation (control, waterlogging, fertilization), visualized by the reaction norms (Supplementary Data Fig. S2). We specifically tested for differences in the reaction norms across different origins (i.e. three genotypes: Gue-0, Mer-6, Vav-0 and three parental environments for Col-1, i.e. from parents that experienced one of the three treatments in the first generation: waterlogging, fertilization and control). The test was done for variability in mortality, total biomass, and average and CV of SLA (CVSLA) by using linear regression models. In the model we tested the effect of environmental conditions experienced in the second generation (control, waterlogging, fertilization) and the origins of the population (genotype and parental environments), plus their interaction. Whenever we found a significant effect of origin, a post-hoc Tuckey test was performed to see which differed significantly.
Diversity vs. monocultures. We tested the effects of environmental conditions (control, waterlogging, fertilization), diversity (monocultures vs. mixtures) and their interaction on Arabidopsis population total mortality, total biomass, and average and variation in SLA values, using linear regression models. To do so, we analysed the populations with varying levels of genetic diversity (Table 1b) separately from those with varying levels of diversity of parental environments (Table 1a), given the lack of overlapping genotypes. Additionally, for the latter test, to determine whether the diversity of environmental exposures in the parental generation was inducing epigenetic diversity, we included in the models the effect of the demethylation treatment (non-demethylated vs. demethylated) and all possible interactions with environmental conditions and diversity level in parental environments. When interactions were significant, the effect of diversity was tested within the other treatments.
Effects of environmental conditions, diversity, and demethylation treatment, and their interactions on Arabidopsis population mortality, total productivity, and variation and average SLA, testing separately the effect on: (A) populations with varying levels of diversity of parental environments, i.e. par. environmental and demethylated; and (B) populations with varying levels of genetic diversity. Results of the full factorial linear models including all fixed factors are given. Bold type indicates significant effects of the factors.
| (A) Par. env. and demethylated | Mortality | Total biomass | CV of SLA | Average SLA | |||||||||
|---|---|---|---|---|---|---|---|---|---|---|---|---|---|
| d.f. | MS | F ratio | P value | MS | F ratio | P value | MS | F ratio | P value | MS | F ratio | P value | |
| Env. condition | 2 | 0.76 | 0.26 | 0.77 | 94281 | 147.39 | <0.01 | 0.429 | 63.51 | <0.01 | 45356 | 179.48 | <0.01 |
| Diversity | 1 | 2.28 | 0.79 | 0.38 | 622 | 0.97 | 0.32 | 0.100 | 14.80 | <0.01 | 290 | 1.23 | 0.27 |
| Demethylation | 1 | 16.25 | 5.6 | 0.02 | 3656 | 5.71 | 0.02 | 0.000 | 0.05 | 0.83 | 2439 | 10.33 | <0.01 |
| E × Div | 2 | 4.33 | 1.49 | 0.23 | 127 | 0.20 | 0.82 | 0.066 | 9.70 | <0.01 | 535 | 2.27 | 0.11 |
| E × Dem | 2 | 1.53 | 0.53 | 0.59 | 545 | 0.85 | 0.43 | 0.001 | 0.10 | 0.9 | 889 | 3.77 | 0.02 |
| Div × Dem | 1 | 0.68 | 0.93 | 0.34 | 1608 | 2.51 | 0.11 | 0.008 | 1.18 | 0.27 | 26 | 0.11 | 0.74 |
| E × Div × Dem | 2 | 2.2 | 0.76 | 0.47 | 1481 | 2.31 | 0.10 | 0.005 | 0.69 | 0.50 | 48 | 0.20 | 0.81 |
| Residuals | 233* | 2.9 | 640 | 0.006 | 236 | ||||||||
E = environmental condition; Div = diversity; Dem = demethylation treatment; d.f. = degrees of freedom; MS = means square; F = variance ratio; P = error probability.
*For mortality d.f. = 240.
Biodiversity effects. Within mixtures, the response of the biodiversity effects (net diversity effects, selection and complementary) to the environmental conditions in the second generation were tested with separate linear models for populations with varying levels of genetic diversity (Table 2b), and for varying levels of diversity of parental environments (Table 2a), as for the test above. For the test using parental environments, the demethylation treatment (non-demethylated vs. demethylated) and the interaction with the environment experienced in the second generations were included as fixed factors (Table 2a). When the interaction was significant, the effect of the source of diversity was tested within different environments.
Effects of environmental conditions and demethylation treatment, and their interactions on diversity net effect, selection effect and complementarity effect on Arabidopsis population biomass, testing separately the effect on: (A) mixtures with varying levels of diversity of parental environments (Par. environmental and demethylated); and (B) mixtures with varying levels of genetic diversity. Results of the full factorial linear models including all fixed factors are given. Bold type indicates significant effects of the factors.
| (A) Par. env. and demethylated | Net effect | Selection effect | Complementarity effect | |||||||
|---|---|---|---|---|---|---|---|---|---|---|
| d.f. | MS | F ratio | P value | MS | F ratio | P value | MS | F ratio | P value | |
| Env. condition | 2 | 548 | 0.92 | 0.40 | 17.50 | 6.82 | <0.01 | 741 | 1.28 | 0.28 |
| Demethylation | 1 | 3196 | 5.37 | 0.02 | 7.05 | 2.75 | 0.10 | 2903 | 5.01 | 0.03 |
| E × Dem | 2 | 3040 | 5.10 | <0.01 | 10.26 | 4.00 | 0.02 | 3088 | 5.32 | <0.01 |
| Residuals | 115 | 595 | 2.56 | 580 | ||||||
| (B) Genetic | Net effect | Selection effect | Complementarity effect | |||||||
| d.f. | MS | F ratio | P value | MS | F ratio | P value | MS | F ratio | P value | |
| Env. condition | 2 | 20 | 0.06 | 0.94 | 0.94 | 0.17 | 0.84 | 29 | 0.09 | 0.92 |
| Residuals | 42 | 345 | 5.40 | 331 | ||||||
Traits and biodiversity effects. To test whether biodiversity effects (net diversity effect and its components: selection and complementarity effect) were related to a population’s trait parameters in mixtures we used linear regression models. These models included average and CVSLA and the source of diversity (genetic, environmental and demethylated populations), the environmental conditions in the second generation and their interactions as explanatory variables (Supplementary Data Table S1a). When the interactions were significant, the effect of the trait on biodiversity effects was tested within the different treatments separately (Table 3).
Influence of average SLA and CVSLA on diversity net effect, and its additive components: selection and complementarity effect on Arabidopsis mixtures. Regression standardized coefficients of each trait predictor of the linear models made in each experimental treatment separately (i.e. mixtures with different source of diversity and under different environmental condition separately) are given. Bold type indicates significant effects of the factors.
| Environmental condition | Trait predictor | Source of diversity | ||||||||
|---|---|---|---|---|---|---|---|---|---|---|
| Genetic | Par. environmental | Demethylated | ||||||||
| Net | Sel | Comp | Net | Sel | Comp | Net | Sel | Comp | ||
| Waterlogging | SLA | 28.00 | −0.93 | 28.93 a | 12.76 | 0.26 | 12.49 | 13.87* | 0.88 | 12.99* |
| CVSLA | −4.47 | 0.47 | −4.95 | −3.22 | 0.05 | −3.27 | 1.24 | 0.65 | 0.59 | |
| Fertilization | SLA | −6.79 | −2.57a | 4.22 | 10.02 | −0.14 | 10.16 | 18.15 | 0.22 | 17.93 |
| CVSLA | 4.37 | −0.91 | 5.28 | −19.52 | −0.33 | −19.19 | 2.49 | −0.65 | 3.14 | |
| Control | SLA | 17.57 | −2.81 | 20.28 | 21.29 a | 2.69* | 18.60 | 9.00 | −0.29 | 9.29 |
| CVSLA | −11.45 | −1.19 | −10.26 | −5.88 | −1.08 | −4.81 | 29.88** | −0.20 | 30.08** | |
Net = net diversity effect; Sel = selection effect; Comp = complementarity.
Significance: a(0.05 ≤ P < 0.1); *(0.01 ≤ P < 0.05); **(P < 0.01).
All analyses were carried out using R v3.2.3 (R Core Team, 2016) with significance set at α = 0.05.
RESULTS
Genotypic variation and phenotypic plasticity
We found that the four genotypes used in the experiments, when grown in monocultures, had similar phenotypes. The only exception to this was found for the Col-1 genotype, which had higher SLA and slightly higher mortality than the genotypes of the Iberian peninsula (Gue-0, Mer-6 and Vav-0; Supplementary Data Fig. S2). The differences were even more pronounced when the parents of the Col-1 genotype were grown in waterlogging conditions (Fig. S2). Also, Gue-0 was more productive than the other genotypes (Fig. S2).
Importantly, the four genotypes showed similar responses to the environmental conditions (control, fertilization and waterlogging; Supplementary Data Fig. S2). The reaction norms (i.e. patterns of phenotypic variability in the second generation) of the different genotypes were generally similar, so they showed a similar plasticity pattern. Specifically, the waterlogging treatment caused a general decrease in productivity, a decrease in the average values of SLA and an increase in trait variability (i.e. CVSLA) in all genotypes of Arabidopsis populations considered and irrespective of the parental environments for the Col-1 genotype (Table 1; Fig. S2).
Diversity vs. monocultures
We found no remarkable effects of diversity on population mortality (i.e. mixtures were similar to monocultures) nor any effect of different environmental conditions experienced in the second generation (Table 1; Supplementary Data Fig. S3). However, the demethylated populations showed lower mortality in comparison with the non-demethylated populations (Table 1A; Fig. S3).
Similarly, we detected no overall significant effect of diversity on productivity due to either genetic diversity or the diversity of parental environments (Table 1; Fig. 1). Total biomass was similar between mixtures and monocultures. However, mixtures of demethylated populations had lower biomass than the demethylated monocultures (Fig. 1). Under fertilization, demethylated mixtures produced significantly lower biomass compared with monocultures (Fig. 1). Also, we detected overall higher biomass of demethylated populations compared to the non-demethylated populations (Table 1A; Fig. 1).
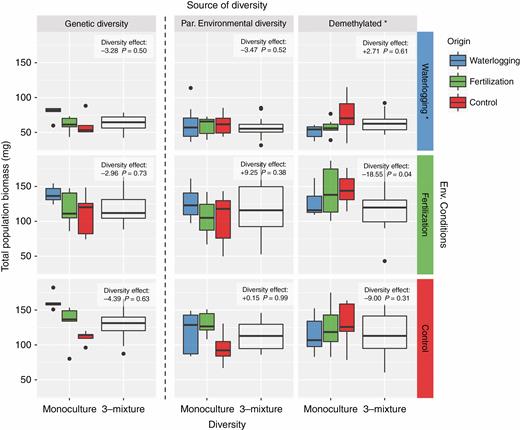
Productivity of experimental populations of Arabidopsis: monocultures vs. mixtures. Each column corresponds to the different sources of diversity: genetic, diversity of parental environments and demethylated; and each column corresponds to the different environmental conditions: waterlogging, fertilization and control. The direction and magnitude of the effect of increasing diversity in each experimental treatment are shown in the boxes. Asterisks in the environmental conditions indicate that the treatment differs significantly from the others. Asterisks in the demethylated populations indicate a significant overall effect of the demethylation treatment (i.e. diversity of parental environments vs. demethylated).
Genetic diversity and the diversity of parental environments increased phenotypic variability (i.e. mixtures had higher CVSLA than monocultures; Table 1), although only the latter did so significantly (i.e. mixtures with diverse parental environments; Fig. 2). In contrast, in the demethylated populations this effect disappeared, and phenotypic variability decreased in mixtures (Fig. 2). The higher CVSLA of mixtures was explained by the different origins of the mixtures and not because the different origins increased their CVSLA from monocultures to mixtures (Supplementary Data Fig. S4). This suggests that the phenotypic variability of the mixtures was explained by heritable epigenetic effects with virtually no within-generation plasticity involved.
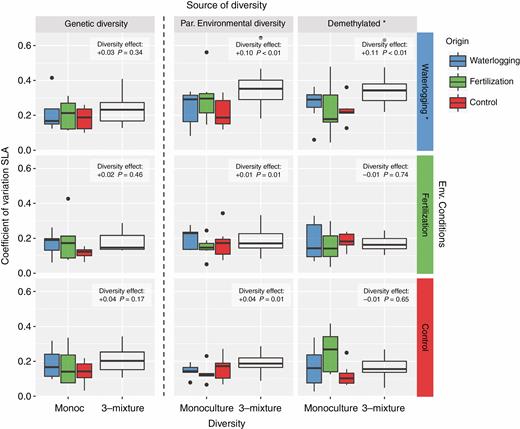
Functional diversity measured as the coefficient of variation of SLA within each experimental population of Arabidopsis: monocultures vs. mixtures. Each column corresponds to the different source of diversity: genetic, diversity of parental environments and demethylated; and each column corresponds to the different environmental conditions: waterlogging, fertilization and control. The direction and magnitude of the effect of increasing diversity in each experimental treatment are shown in the boxes. Asterisks in the environmental conditions indicate that the treatment differs significantly from the others. Asterisks in the demethylated populations indicate a significant overall effect of the demethylation treatment (i.e. diversity of parental environments vs. demethylated).
In general, we found no differences in SLA between monocultures and mixtures, with the exception of the genetically diverse mixtures in the fertilization treatment with significant lower SLA than the respective monoculture. Also, demethylated populations had in general higher SLA than the populations with manipulated parental diversity (Fig. 3). As we found with CVSLA, the average SLA of the different origins did not change between monoculture and mixture (Supplementary Data Fig. S5), suggesting no within-generation phenotypic plasticity triggered by the population structure.
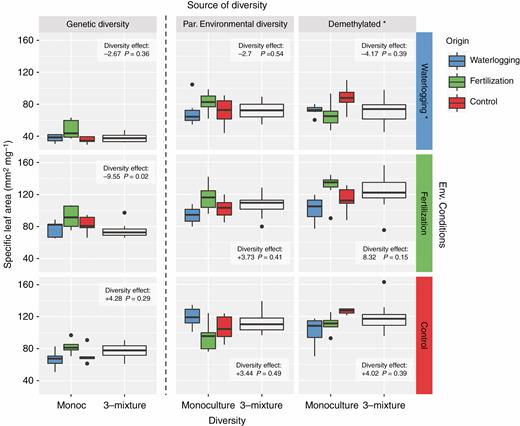
Average specific leaf area (SLA) of each experimental population of Arabidopsis: monocultures vs. mixtures. Each column corresponds to the different source of diversity: genetic, diversity of parental environments and demethylated; and each column corresponds to the different environmental conditions: waterlogging, fertilization and control. The direction and magnitude of the effect of increasing diversity in each experimental treatment are shown in the boxes. Asterisks in the environmental conditions indicate that the treatment differs significantly from the others. Asterisks in the demethylated populations indicate a significant overall effect of the demethylation treatment (i.e. diversity of parental environments vs. demethylated).
Biodiversity effects
In accordance with the previous results on population biomass, we found that the net diversity effect and its components (selection and complementarity on genetic and parental diverse populations) did not vary significantly across environmental conditions in the second generation, nor were they different from zero (Table 2; Fig. 4). However, we found differences in biodiversity effects between the demethylated and non-demethylated mixtures, although they were specific for each environmental condition (Table 2A). Specifically we found a negative net effect in the demethylated population under fertilization (Table 2A; Fig. 4A), which was mostly explained by a negative complementarity effect (Fig. 4C), indicating that the three different origins that comprise the population (i.e. coming from the three different parental environments) were similarly less productive in mixtures than expected from monocultures (Supplementary Data Fig. S6). Although the effect of selection compared with complementarity was relatively small (± 3 mg vs. ± 50 mg; Fig. 4B,C), we found a more positive selection effect of the non-demethylated mixtures compared with the demethylated mixtures in the fertilization and the waterlogging treatment, although only in the latter was significant (Table 2A; Fig. 2B). This difference did not generate any differences in the overall net effect.
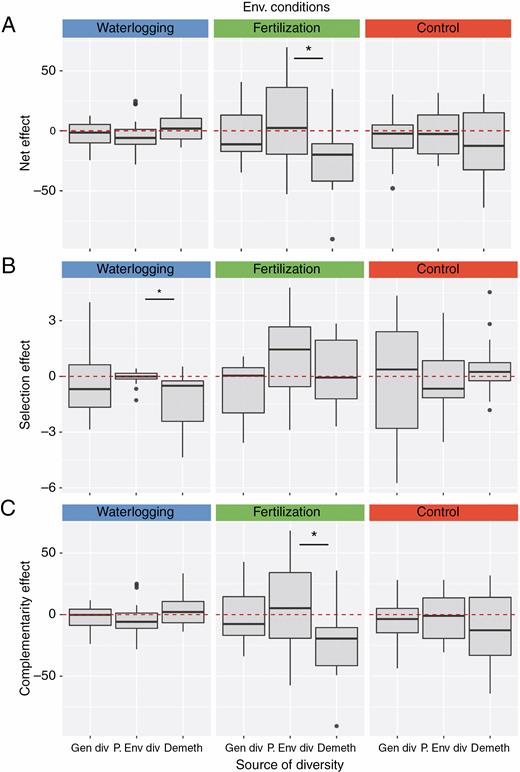
(A) Net biodiversity effect, and its two components (B) selection effect and (C) complementarity effect in the mixtures of Arabidopsis with differing source of diversity: genetic, diversity of parental environments, and absent (demethylated). Each column corresponds to the different environmental conditions: waterlogging, fertilization and control. Asterisks indicate significant differences of the mixtures compared with environmentally diverse mixtures.
Functional traits and biodiversity effects
When we used traits to explain the net diversity effect and its two components, we found a generally significant effect of average SLA on increasing net effect and complementarity, plus an effect of CVSLA dependent on the environmental conditions and source of diversity (i.e. interaction E × S × CVSLA; Supplementary Data Table S1a). To characterize these effects correctly, we explored the relationship within the populations under the same environmental conditions (i.e. waterlogging, fertilization and control in the second generation). We found that traits could explain the diversity effects only in waterlogging and control treatments (Table S1b). In mixtures undergoing waterlogging, a positive net effect (i.e. more productive mixtures beyond that predicted by the monocultures) was characterized by populations with low CVSLA and high values of SLA (Table S1b). In control conditions the effect of CVSLA and SLA was dependent on the source of diversity (i.e. interaction S × CVSLA/SLA; Table S1b), so we further segmented the treatments. By doing so, in control conditions, we found a positive effect of SLA in the selection effect of mixtures with diverse parental environments, and a positive effect of CVSLA on net effect and complementarity in demethylated mixtures (Table 3).
DISCUSSION
This study expands our knowledge on the role of genetic diversity and diversity of parental environments on intraspecific trait variation as a potential mechanism of coexistence and functioning of communities. Specifically, this is the first empirical test of the effect of both genetic diversity and diversity of parental environments on productivity and resistance to environmental fluctuations of populations. In general, we found no direct effect of diversity on productivity and resistance to environmental fluctuations in either genetic diverse populations or populations which experienced different parental environments. However, in demethylated populations we found a negative effect of diversity on productivity. This result has two important implications. First, it suggests that the environmentally induced transgenerational effects were controlled epigenetically via DNA cytosine methylation. Second, when the epigenetic diversity is removed, competition within the population can increase because of decreased phenotypic variability. Thus, Arabidopsis populations consisting of individuals from different parental environments can ameliorate the negative effects of intraspecific competition on productivity, and have similar effects on productivity as genetic diversity. The higher intraspecific trait variation found in the epigenetic diverse mixtures compared to the demethylated mixtures further suggests that the reduction in competition could be partially caused by an increase in niche differences between parental origins.
We show that the waterlogging treatment was the most stressful for the populations of Arabidopsis. Although it did not cause higher mortality, it decreased biomass production by more than 50 % compared to control conditions. However, we did not find that diversity (either genetic or environmental) increased population resistance to environmental fluctuations. The strong decrease in the size of the individuals in the waterlogging treatment probably decreased the direct interaction between individuals, thus decreasing potential biotic effects in species coexistence. At the same time, especially stronger diversity effects in populations undergoing the fertilization treatment compared to the other environmental conditions could be caused by the greater size of the individuals (Figs 1 and 2), which probably increased the intensity of the interactions. This stronger diversity effect when competition and interactions are stronger, for example under fertilized conditions, is actually expected by theoretical studies and it has been repeatedly shown in several diversity experiments (Reich et al., 2001; Fridley, 2003). The relatively low selection effect found in our study could be promoted by the low mortality, and thus competition exclusion, that occurred in the experiment.
We show that the three environmental conditions (control, fertilization and waterlogging) imprinted on the Col-1 genotype in the first generation triggered phenotypic differences between their offspring (i.e. transgenerational effects; Supplementary Data Fig. S1). These effects, when offspring from different parental environments were brought together in mixtures, translated into more functional diverse populations (i.e. higher CVSLA). Moreover, the higher CVSLA of the mixtures was due to differences between parental origins and not to an increase of the variation within origins from monocultures to mixtures (Fig. S4). These results suggest that transgenerational, rather than within-generational, plasticity was driving the intraspecific trait variation of the mixtures, possibly promoting niche and resource partitioning and potentially increasing complementarity. To the best of our knowledge this is the first experiment that has clearly demonstrated an increase in intraspecific variability of populations consisting of individuals from parents grown in different environments, with clear implications for coexistence and ecosystem functioning.
Interestingly, when we applied the demethylation treatment that removed (at least partially) the parental–epigenetic signature of the individuals, the functional diversity of the mixtures disappeared. The lack of phenotypic variation of the demethylated mixtures suggests strongly that the diversity of parental environments was based on epigenetic variation and partially controlled via DNA cytosine methylation. However, it is also possible that DNA damage from the use of the demethylation agent could have occurred (as found in Liu et al., 2015). However, our findings of an overall biomass increase and lower mortality of demethylated populations suggest that this does not seem to be the case. We suggest that detailed molecular study of the plant material can complement this type of experiment in the future.
By increasing divergence in traits between individuals, we expected reduced competition between such individuals, enhancing niche segregation and complementarity on the environmentally/epigenetic diverse populations, and thus promoting a positive diversity net effect on productivity or resistance to environmental fluctuations (Fridley 2001, 2003). However, we found neither positive nor negative diversity effects, although with similar effect to genetic diversity. On the contrary, in demethylated mixtures, where we removed the epigenetic diversity and its relative functional diversity, we found a negative diversity effect, due to a negative complementarity effect, that was only statistically significant under fertilization. Demethylation, by evening out the epigenetic trait differences, could have reduced niche differences between origins and increased the competition intensity between origins. In that case, we would have expected the biomass produced in demethylated mixtures to be similar to that of demethylated monocultures. However, we found higher average biomass of the different origins in monocultures than in mixtures, indicating that competition was less intense among conspecifics of the same origin than between origins. This suggests that another mechanism of origin-specific cooperative behaviour could have been also involved in reducing the competition between conspecifics of the same origin (as also found in Semchenko et al.,, 2014). Regardless, the diversity of parental environments seems to ameliorate the negative effect of competition between different origins.
Although we expected genetically diverse populations to have the highest phenotypic variability related to resource foraging compared to the other populations, we found lower functional diversity in the mixtures than in the monocultures. It is surprising that the mixture of the three selected genotypes with contrasting evolutionary history – which are described to differ in phenotypic traits such as root system and flowering period (Picó et al., 2008; Méndez-Vigo et al., 2013) – did not differ in SLA, which is a trait related to resource foraging strategy of the plant. The absence of prominent morphological variability in SLA of these genotypes and with significantly lower values compared to the Col-1 genotype also suggests that low SLA is a selected plant life-history trait that has contributed to their success under Mediterranean climates (Wright et al., 2005; Blonder et al., 2015). Nevertheless, not finding a negative diversity effect in these populations (as we found in demethylated populations), indicates that there should indeed be some functional differences between genotypes.
When we tested the relative importance of trait values and variation for explaining the biodiversity effects, we found that average values of SLA rather than trait variance (i.e. CVSLA) of the populations drove the productivity of the mixtures. In general, we found that net diversity effects were higher when mixtures contained individuals with high SLA (i.e. higher average SLA) and were also associated with lower variation in SLA (i.e. negative standard coefficients of CVSLA; Table 3). This means that populations of individuals with high SLA produced more biomass than more diverse assemblages with lower SLA. Although it is possible that measuring SLA alone could have been insufficient to characterize an organism’s niche differences (Kraft et al., 2015; Kunstler et al., 2016; Cadotte, 2017), this result suggests that the increase in productivity of populations was not driven only by niche differences, and that average traits provided a better explanation (Kunstler et al., 2016). This is not a surprise because, besides being a trait related to resource foraging strategy of the plant (i.e. niche segregation), SLA is a hierarchical trait linked to the fitness or competitive ability of the individuals (Roscher et al., 2012; Kraft et al., 2014, 2015; Carmona et al., 2019). Species tend to be more productive when having higher SLA (Kraft et al., 2014; Madani et al., 2018). Interestingly, only in demethylated populations, in contrast to the other populations, did we find that niche differences (i.e. CVSLA) were more positively driving productivity, in some cases even with a stronger effect than that of SLA (Table 3). This suggests that when phenotypic variation is low, and consequently competitive intensity is high, the importance of intraspecific trait variation and niche differentiation on productivity becomes more important.
CONCLUSIONS
Our study reveals the fraction of intraspecific phenotypic diversity that can be enabled by transgenerational effects, probably via environmentally induced epigenetic changes. Because transgenerational effects are common and probably ubiquitous in plants, we suggest that more efforts should be devoted to testing their ecological and evolutionary relevance and consequences. Specifically, here we compared the effect diversity of environmentally induced transgenerational effects and genetic diversity on productivity and resistance to environmental fluctuations. This might be of particular importance in facing rapid environmental change because transgenerational effects have been increasingly recognized as determinants of successful adaptation of plants to novel climate (e.g. Herman and Sultan, 2011; Latzel et al., 2014). Thus, epigenetically driven diversity can provide plant populations with another mechanism to cope with novel climate and to maintain function.
SUPPLEMENTARY INFORMATION
Supplementary data are available online at https://dbpia.nl.go.kr/aob and consist of the following.Fig. S1: Schematic representation of the experimental design. Fig. S2: Patterns of plasticity depending on a plant’s parental origin. Fig. S3: Mortality within each experimental population. Fig. S4–S6: Coefficient of variation, average of SLA, and average biomass of each origin in each experimental population of Arabidopsis: monocultures vs. mixtures. Table S1: Influence of traits and environmental conditions and source of diversity, and their interactions on net effect, and its additive components: selection and complementarity.
ACKNOWLEDGEMENTS
We thank C. Alonso-Blanco, M. Applová, N. G. Medina and T. Galland for assistance. All authors designed the research; H.D. and J.P. imprinted the plant material and J.P. performed the main experiment; J.P. analysed the data; J.P. wrote the main manuscript. All authors contributed substantially to revisions and gave final approval for publication.
FUNDING INFORMATION
This work was supported by the Czech Science Foundation (GACR 20-00871S) and the Estonian Research Council (project PSG293 to C.P.C.) and the European Union through the European Regional Development Fund (Centre of Excellence EcolChange to C.P.C.).
LITERATURE CITED
