


Abstract
Submergence tolerance in rice is primarily attributed to the action of the SUB1 gene, but other associated traits such as leaf gas film (LGF) thickness, leaf hydrophobicity, porosity and leaf density have been known to aid submergence tolerance in rice. However, association of these traits with SUB1 quantitative trait locus (QTL) has not been demonstrated. In this study, we aim to investigate (1) whether the presence of the SUB1 QTL in the genetic background has any influence on the thickness of the LGF and (ii) whether its removal has any impact on stress perception and submergence tolerance in Sub1 and non-Sub1 rice.
We examined 12 genotypes (including both Sub1 and non-Sub1 types) for different leaf traits such as initial LGF thickness, leaf hydrophobicity, tissue porosity and leaf density in order to work out the relatioship of these traits to the SUB1 QTL in rice. Furthermore, we investigated the changes in the gene expression profile and different metabolic processes in selected genotypes in the presence and absence of their LGF to study its impact on stress perception and adaptation.
The initial thickness of the LGF and hydrophobicity seemed to have a highly positive correlation with the presence of the SUB1 QTL in the genetic background of rice; however, other leaf traits such as porosity and density seemed to be independent of it. Artificial removal of the LGF resulted in partial loss of tolerance, showing increased ethylene production and early induction of anoxia-related genes (SUB1A-1, ACS5, Ramy3D and ADH1) which manifested symptoms such as increased stem elongation, faster chlorophyll and starch breakdown, and partial loss of quiescence in SUB1-containing rice genotypes. Stripping of the LGF resulted in early and enhanced induction of SUB1A-1, indicating a quicker perception of stress.
The presence of SUB1 in the genetic background positively influences surface hydrophobicity and the concomitant LGF thickness of rice. Furthermore, LGF helps in terms of providing better ethylene dissipation and reduced in planta accumulation, owing to the slowing down of ethylene-induced leaf senescence under submergence stress.
INTRODUCTION
Among the cereals, rice is unique owing to its adaptation to wet environments. As a consequence, it is able to tolerate associated climatic adversities which other crops cannot (Sarkar et al., 2019). Due to its worldwide distribution in diverse agro-climatic conditions, rice faces several abiotic stresses throughout its life cycle. Among these stresses, submergence ranks third in terms of importance, affecting production and productivity of rice particularly in south-east Asia predominated by lowland and flood-prone ecologies (Ismail et al., 2013). A situation where the plants are completely immersed under water is defined as submergence. It inflicts an acute stress on the plants by limiting light accessibility, gas diffusion and nutrient availability, causing mechanical damage too (Greenway and Setter, 1996; Ram et al., 1999). To withstand submergence, a group of rice genotypes employ a strategy known as quiescence or low-oxygen quiescence syndrome, where they exhibit very limited stem elongation during submergence (Colmer and Voesenek, 2009).
Implementing quiescence is a crucial survival strategy as continued elongation during the period of submergence pre-conditions the plants for lodging immediately after the water recedes (Vergera et al., 2014). Submergence substantially reduces oxygen uptake by decreasing the rate of gas diffusion and hence diverting carbohydrate metabolism in plants towards fermentation which is a rather inefficient pathway to meet the energy requirement (Bailey-Serres, 2014). Therefore, maintaining a sufficiently high content of non-structural carbohydrates pre- and post-submergence is crucial for constant supply of energy to run key metabolic processes during submergence and post-submergence recovery, respectively (Sarkar, 1998; Das et al., 2001; Bhaduri et al., 2020). Reducing elongation under submergence to a great extent fulfils such a role.
The SUB1 quantitative trait locus (QTL), originally identified from the submergence-tolerant landrace FR13A, has subsequently been transferred to many rice varieties through targeted breeding, and its introgression invariably resulted in better submergence tolerance and post-stress recovery (Sarkar and Bhattacharya, 2011; Mackill et al., 2012; Ismail et al., 2013). Identification and functional characterization of key genes such as SUB1A-1 within this QTL region have helped in better understanding of the regulatory mechanism of submergence tolerance. Due to slow diffusion of gases during submergence, the concentration of ethylene gradually builds up in plants. The increased concentrations of ethylene lead to elongation in most of the rice genotypes where the submergence-tolerant gene SUB1A-1 is not present in its active form (Jackson, 2008). SUB1A-1 suppresses the action of ethylene, resulting in restriction of elongation growth under submergence (Tamang and Fukao, 2015).
Besides these well-studied adaptive and/or tolerance strategies, rice plants possess another unique feature in the form of wax-coated superhydrophobic leaf surfaces, which repel water and, as a result, retain a thin gas film, known as the leaf gas film (LGF), underwater (Setter et al., 1989; Pedersen et al., 2009). The presence of LGF initially reported in flooded deep-water rice (Raskin and Kende, 1983), and subsequently found to be an important trait for submergence tolerance. Among all the cereal crops, rice contains the thickest LGF on both the adaxial and abaxial surfaces, which is reported to be associated with their unique ability to withstand water stagnation (Raskin and Kende, 1983). Colmer and Pedersen (2008a) reported that these LGFs markedly enhance gas exchange of immersed leaves and thereby help to improve underwater photosynthesis during daytime and enhance respiratory O2 uptake at night. Thus the LGF facilitates respiration and photosynthesis, respectively, in a diurnal cycle (Colmer and Pedersen, 2008b). Since LGF helps in augmenting underwater photosynthesis, its role is also crucial in the build up of shoot and root dry mass under complete submergence (Pedersen et al., 2009). In addition, under dark conditions, pO2 falls if the LGF is removed, which suggests a role of the LGF in basipetal movement of O2 from shoot to root (Pedersen et al., 2009; Winkel et al., 2011). Previous studies on rice (Colmer and Voesenek, 2009; Winkel et al., 2014) and Hordeum marinum (sea barley grass, a wild relative to barley) (Pedersen et al., 2010) showed that the LGF can be retained for up to 1 week of submergence, and its artificial removal affects the plant’s survival (Winkel et al., 2013; Verboven et al., 2014). Recently, Kurokawa et al. (2018), through mutant analysis, illustrated that the Leaf Gas Film1 (LGF1) gene, regulating C30 primary alcohol biosynthesis during epicuticular wax formation, governs leaf hydrophobicity and LGF thickness in rice.
Although rice is reported to possess the thickest LGF among all the cereals (Raskin and Kende, 1983), the trait exhibits genotypic variation. There are other associated leaf traits which might have an influence on submergence tolerance but have not been determined as yet. Moreover, whether these characters are influenced by the presence/absence of the SUB1 QTL in the genetic background is also not established. Hence, the present study aimed to investigate (1) whether the presence of the SUB1 QTL in the genetic background has any influence on leaf hydrophobicity and thickness of the LGF and (2) whether removal of the LGF has any impact on stress perception and submergence tolerance in Sub1 and non-Sub1 rice. For this, our hypotheses are: (1) the LGF thickness should be higher in the rice genotypes which contains an active SUB1 QTL in its genomic region. (2) If so, then removal of the LGF would have a significant impact on submergence tolerance ability, particularly in Sub1 rice genotypes where the LGF thickness is greater.
MATERIALS AND METHODS
Plant material and experimental condition
Twelve rice genotypes, having differential sensitivity to submergence stress (from highly susceptible to highly tolerant to 2 weeks of complete submergence), were selected for the present study. We used popular cultivars such as Swarna, IR64 and Savitri and their SUB1 introgressed counterparts, along with FR13A, the original donor of the SUB1 QTL in rice. Some of the previously tested submergence-tolerant germplasms/landraces were also included to study the level of diversity of the LGF in these genotypes. The plants were grown in pots in the net house of the ICAR-National Rice Research Institute, Cuttack, India under normal conditions in the wet season of 2017 and the dry season of 2018. The thickness of the LGF and other associated leaf traits were recorded from the second fully emerged leaf of 25-day-old plants. Based on the diversity of the LGF thickness present on the adaxial and abaxial leaf surfaces, four genotypes, i.e. FR13A (FR), Swarna-Sub1 (SS), Swarna (SW) and IC450292 (IC), representating both Sub1 and non-Sub1 types, were finally used for detailed investigation.
For the submergence experiment, the four genotypes were sown in earthenware pots (of 15 cm height) containing 2 kg of sun-dried soil mixed with farmyard manure (3:1) and inorganic fertilizers as per standard practice. Thinning was done to keep three plants per pot after 10 d of sowing. The experiment was replicated in the form of ten pots per genotype × treatment combination. The 25-day-old seedlings were subjected to submergence stress with 100 cm of standing water in cement tanks (L × B × H: 2 × 1.5 × 1.2). The submergence stress was imposed in two sets of plants, where in one set the plants were immersed keeping their respective LGF intact, while, in the other, the LGFs from both the adaxial and abaxial surfaces were removed manually by brushing each leaf of every plant with cotton balls soaked in Triton X-100 (0.1 %). To ensure complete removal of the gas film, additionally the plants were completely immersed (upside down) for 5 min in 0.1 % Triton X-100 solution, followed by washing in water to remove traces of Triton. The plants were then immediately placed in a submergence tank with 100 cm of standing water. The third set of plants were kept as controls under normal non-submerged conditions. Leaf samples were collected for various physiological and biochemical parameters at 3 d intervals. After 14 d, of submergence, plants were de-submerged and post-submergence observations were recorded.
Leaf gas film thickness, tissue porosity and leaf density
The second fully emerged leaves were collected in replicates from 25-day-old plants of each genotype grown in controlled conditions. The fresh weight and width of 8 cm long leaf clips (W1), collected from the mid-portion of the leaf blades, were noted. The leaf clips were then attached to a square-shaped metal clamp and the whole set-up was immersed in water. Thin wires were fixed in each corner of the clamp containing the leaf clip and were finally suspended from the pan hook of the analytical balance. The weight of the suspended immersed clamp and attached leaf sections was recorded as W2. Thereafter, both the leaf surfaces were treated with Triton X-100 to eliminate the air layer and the weight of the whole set-up was recorded (W3) once again as previously. The weight of the submerged metal clamp alone (without the leaf sections) was recorded as W4. The thickness of the LGF was measured following the method given by Raskin and Kande (1983) as per the following calculations.`´
Vair was calculated separately for each side of the leaf after treating each side of the leaf section with Triton X-100 solution. Similarly, the volume of the leaf section (Vleaf) was also measured in a similar way following Archimedes’ law of buoyancy.
Where, Bleaf is the buoyant force acting on the leaf section without an air layer, which can be expressed as
Finally, the thickness of the LGF was expressed in micrometres by dividing Vair by the surface area of the leaf sections measured using a conveyer belt-based leaf area meter (LI3000C, LICOR, Lincoln, NE, USA).
Tissue porosity was also measured following Archimedes’ principle (Raskin 1983; Thomson 1990).
Rate of leaf gas film depletion
FR, SS, SW and IC were taken as representative genotypes for this study, among which the first two are Sub1 type and the other two are non-Sub1 type. The thickness of the LGF was measured on seven consecutive days for all the genotypes with three replications each. Obtained values were plotted on a graph and curve fitting was performed in order to capture the trend of LGF depletion. The rate of LGF depletion was obtained by taking the first-order derivative of LGF depletion with respect to time. Further, the LGF depletion rate on each day was obtained using the derived mathematical model for each genotype and plotted on a graph (values were plotted for the first 6 d as on the sixth day the LGFs of IC and SW were completely depleted).
Leaf hydrophobicity and epicuticular wax content
Hydrophobicity of the leaf surface was measured by placing a small water droplet (approx. 2 µL) onto the adaxial leaf surface and measuring the contact angle of the droplet with the leaf surface. If the contact angles were >90° and >150°, then the surface was categorized as hydrophobic and superhydrophobic, respectively (Koch and Barthlott, 2009). The second fully emerged leaves of 25- to 30-day-old control plants were collected in triplicate and used to measure leaf hydrophobicity and wax content. The image of the water droplet was taken after placing it on the leaf surface and kept on a fixed platform. The image was captured using a DSLR camera (D3100, Nikon, Japan) fixed in a tripod with a fixed zoom lens. The contact angle between the leaf surface and water droplet was measured from five independent captured images using online protractor software.
To measure the epicuticular wax content of the leaf surface, ten leaf clips (approx. 2 cm long) were collected from control plants and the total wax attached to the leaf clip was extracted in chloroform and measured colorimetrically (Ebercon et al., 1977). Freshly collected leaf clips were immersed in 15 mL of redistilled chloroform for 15 s. The extract was filtered and evaporated by keeping it in a boiling water bath until there was no smell of chloroform. The acidic K2Cr2O7 reagent was prepared by adding 20 g of powdered K2Cr2O7 with 40 mL of deionized water, followed by vigorous mixing of the slurry with 1 L of concentrated H2SO4. The resultant mixture was heated (below boiling point) until a clear solution was obtained. A 5 mL aliquot of this reagent was mixed with the extract and kept in the boiling water bath for 30 min. After cooling, 12 mL of deionized water was added and kept for 2 h for colour development. The optical density of the sample was measured at 590 nm by a UV-Vis spectrophotometer (UV-2600, Shimadzu, Japan) and the wax content was calculated using Carnauba wax (CAS 8015–86–9, Sigma-Aldrich) as standard.
Plant survival and elongation ability
The survival rate and elongation ability of the plants after imposition of the submergence stress was measured as described by Sarkar and Bhattacharjee (2011). Elongation ability was expressed as the percentage increase in plant height during the period of stress by subtracting the plant height before stress imposition from the plant height after stress relief. The survival rate was counted 1 week after de-submergence, and percentage survival was calculated as [(number of plants surviving at 7 d of re-emergence)/number of plants before submergence) × 100].
Ethylene and total chlorophyll content
The ethylene production rate was measured (Panda et al., 2016) every fourth day after stress imposition from freshly collected leaves. The leaves were transferred to 5 mL moist glass tubes in triplicate, sealed immediately with air-tight caps and incubated in darkness at room temperature for 2 h. After that, 1 mL of head space gas from the tube was drawn into a gas-tight syringe and injected into a gas chromatograph (CP-3800, Varian, USA) having a flame ionization detector and a Valco Bond capillary column, Valco Plot Haye SepA (30 m × 0.53 mm × 20 µm). Nitrogen was used as carrier gas, while oxygen was used for flame ionization. The instrument was calibrated using pure ethylene gas mixed with air to obtain different concentrations.
Total chlorophyll content at 3 d time intervals was estimated from 50 mg of freshly collected leaf tissues (in triplicate). Chopped leaves were put in 10 mL of 80 % acetone and kept at 4 °C for 48 h. The optical density of the extract was measured at 645 and 663 nm using a UV-Vis spectrophotometer (UV-2600, Shimadzu, Japan). The total chlorophyll content was calculated according to Arnon (1949).
Measurement of starch content and amylase activity
Starch content was determined by the anthrone method (McCready et al., 1950), where a known quantity of dried leaf samples was hydrolysed by boiling in 10 mL of 1 n HCl in a glycerine bath at 112–115 °C for 30 min. The extract was collected and the volume was made up to 100 mL. The extract (1 mL) was mixed with distilled water to make up the volume to 2.5 mL followed by addition of 10 mL of freshly prepared anthrone reagent (100 mg of anthrone in 100 mL of chilled concentrated sulfuric acid). The reaction mixture was heated for 15 min in a boiling water bath and the optical density of the cooled samples was measured at 620 nm in a UV-Vis spectrophotometer (UV-2600, Shimadzu, Japan). The final starch content was calculated as the glucose value (obtained from the standard curve of glucose) × 0.9, taking into consideration an appropriate dilution factor used for the estimation.
To measure amylase activity, 100 mg of fresh leaf sample was collected and crushed in 10 mL of ice-cold calcium chloride (10 mm) using liquid N2. Then the extract was centrifuged at 20 000 g for 20 min at 4 °C and the supernatant was collected as the enzyme source. The reaction mixture was prepared with 1 mL of enzyme extract and 1 mL of acetate buffer (100 mm, pH 5.0) mixed with 1 % starch and incubated at 30 °C for 30 min. Then 2 mL of 1 % 3,5-dinitrosalicylic acid was added to the reaction mixture to terminate the reaction. The optical density of the coloured product was measured at 540 nm. The endogenous reducing value was subtracted from the values of the reducing sugar in the assay tubes in order to obtain the actual enzyme activity. Finally, the total amylase activity was calculated from the standard curve of a known quantity of maltose (Bernfeld, 1955).
Genotyping for the SUB1 QTL
Approximately 1 g of leaf sample of each of the genotypes was used for DNA extraction and purification following the cetyltrimethylammonium bromide (CTAB) method (Murray and Thompson, 1980). The quantity and quality of genomic DNA (gDNA) of each sample were determined using a 0.8 % agarose gel. An aliquot of 20 ng µL–1 diluted gDNA of each sample was used for PCR. The Sub1BC2 marker developed from the 38 bp insertion region between SUB1B and SUB1C, and the AEX1 marker, a functional single nucleotide polymorphism (SNP), for SUB1A (Septiningsih et al., 2009), were employed to differentiate submergence-tolerant and susceptible genotypes. The PCR was done in a solution (25 µL) containing 10 mm Tris–HCl buffer (pH 8.2), 50 mm KCl, 1.5 mm MgCl2, 0.01 % gelatine, 200 µm dNTPs, 0.2 μm primers, 1 U of Taq DNA polymerase and 40 ng of the template DNA. The amplification reaction consisted of pre-heating for 5 min at 94 °C and 36 cycles of 1 min at 94 °C (denaturation), 1 min at 53–61 °C (annealing) and 1 min at 72 °C (elongation), followed by 5 min at 72 °C (extension) in a PCR system (Eppendorf, Germany). The amplified products were separated on a 2 % agarose gel containing 0.5 ng mL–1 ethidium bromide. The separated PCR products were made visible under UV light and photographed in a Gel Documentation System (G-Box, Syngene, UK).
Gene expression study
Quantitative reverse transcription–PCR (qRT–PCR)-based gene expression analysis (Chakraborty et al., 2019) was performed for a few genes associated with submergence tolerance in rice. Total RNAs were isolated from three independent biological replicates at 1, 3 and 5 d after stress imposition using the RNeasy Plant Mini Kit (Qiagen) followed by DNase I treatment for removal of the gDNA contamination. The quantity and quality of the extracted RNA were checked in Nanodrop (ND 1000, Thermo, USA) and visualized on a MOPS gel. From the extract, approx. 1 µg of RNA was taken for first-strand cDNA synthesis using the Quantitech Reverse Transcription Kit (Qiagen) as per the manufacturer’s protocol. Differential expression profiles of selected genes were studied using gene-specific primers (see Supplementary data Table S1 for primer details). The primers were designed from the CDS (coding sequence) using ‘QuantPrime’ software (http://quantprime.mpimp-golm.mpg.de/) (Arvidsson et al., 2008). The qRT–PCRs were performed using the QuantiFast SYBR Green PCR reaction kit (Qiagen) and amplified in the QuantStudio 5 Real Time PCR system (Applied Biosystems, Thermo Scientific, USA). Two technical replicates of each of the three biological replications were used in qRT–PCR to amplify the genes in control and stressed conditions. The relative expression levels were determined by comparing the expression level of the gene with that of the control using the 2–∆∆CT method (Livak and Schmittgen, 2001). Every qRT–PCR was normalized by taking the Os18srRNA gene as an internal control.
Statistical analysis
The data presented were the mean values ± s.e.m. The experiment was carried out in a completely randomized design and the data were subjected to one-way factorial analysis of variance (ANOVA) as per the experimental design. The data were tested for normality of the dependent variables and equality (constant) of error variance before performing the ANOVA. The test results suggested that no transformation of the data was required for the present analysis. The ANOVA found significance for treatment × genotype interaction at a 5 % level. A post-hoc analysis for pair-wise comparison of treatment × genotype combinations was performed by Tukey’s range test using SPSS (version 20.0) software.
RESULTS
Genotypic variations in leaf gas film thickness, tissue porosity and leaf density
Initially, the 12 rice genotypes (grown in control conditions) including Sub1 and non-Sub1 versions of high-yielding cultivars were characterized to confirm the presence of the SUB1 QTL region. The distinctive profiling based on two SUB1 gene-based markers (one SNP-based marker AEX1 and the other the InDel-based marker Sub1BC2) revealed that six out of 12 genotypes (FR13A, Kalaputia, IC399488, Swarna-Sub1, IR64-Sub1 and Savitri-Sub1) possessed the SUB1 QTL in their genomic background while the others did not (Table 1; Supplementary data Fig. S1A). Subsequently these genotypes were evaluated for different leaf traits, namely thickness of the gas film, tissue porosity, leaf density and their submergence tolerance (in terms of survival rate under 14 d of submergence). ANOVA found significance at the 1 % level, suggesting that innate variation between the studied genotypes was significant for all the traits (Table 1; Supplementary data Table S2). A clearly distinct pattern in the thickness of the gas film on both the adaxial and abaxial leaf surface was observed in Sub1 and non-Sub1 rice genotypes. The average LGF thickness was significantly higher (>22 µm) in Sub1 genotypes as compared with the non-Sub1 type high-yielding cultivars, i.e. Swarna (11.6 µm), IR64 (13.3 µm), Savitri (10.6 µm) and Naveen (12.47 µm). The least thickness of the gas film was observed in IC450292, in which it was only 6.46 µm. It is interesting to note here that the gas film thickness of Swarna, IR64 and Savitri was almost half that of their SUB1 QTL introgressed counterparts, i.e. Swarna-Sub1, IR64-Sub1 and Savitri-Sub1, respectively. A hierarchical cluster analysis of these genotypes based on the thickness of the LGF on adaxial and abaxial surfaces could categorize them into two distinct clusters (Sub1 and non-Sub1 types), which clearly indicated the influence of the SUB1 QTL on this trait (Supplementary data Fig. S1B). It is worth mentioning here that although there was enough genotypic variance in LGF thickness observed in the present study, we did not observe a significant difference in LGF thickness within a particular genotype when they were grown in dry and wet seasons.
Innate diversity in different leaf traits of 12 rice genotypes grown under normal conditions and the status of the SUB1 QTL in their genomic background along with their response to 14 d of submergence stress measured in terms of survival rate (%)
| Genotype | Leaf gas film thickness (µm) | Leaf porosity (%) | Leaf density (g cm–3) | Survival rate (%) | Status of the SUB1 QTL | Response to submergence stress | |
|---|---|---|---|---|---|---|---|
| Adaxial | Abaxial | ||||||
| FR13A | 32.8a (2.2) | 31.2a (2.5) | 35.1bc (3.3) | 0.63ab (0.02) | 97a (3.3) | Present | HT |
| IC459744 | 7.9e (0.8) | 13.7ef (1.5) | 52.1a (1.9) | 0.57ab (0.05) | 23bc (7.1) | Absent | S |
| Kalaputia | 31.4ab (2.3) | 27.7ab (1.2) | 33.9bc (1.7) | 0.61b (0.03) | 93a (4.4) | Present | HT |
| IC399488 | 18.9cd (2.1) | 20.7bc (2.1) | 49.3a (2.1) | 0.54b (0.04) | 90a (5.1) | Present | HT |
| IC450292 | 6.8e (0.7) | 6.1e (0.5) | 34.3bc (3.4) | 0.66ab (0.01) | 37b (7.8) | Absent | S |
| Naveen | 9.7e (0.9) | 15.7cd (2.0) | 18.8d (2.1) | 0.64ab (0.06) | 7c (4.4) | Absent | HS |
| Swarna | 11.1e (1.0) | 12.1de (0.8) | 24.4cd (3.5) | 0.70ab (0.03) | 16bc (5.6) | Absent | HS |
| Swarna-Sub1 | 24.4c (2.6) | 26.8ab (1.9) | 21.3d (1.9) | 0.79a (0.08) | 87a (5.4) | Present | HT |
| IR64 | 14.2de (1.1) | 12.3de (0.7) | 39.2b (2.8) | 0.59b (0.04) | 27bc (6.7) | Absent | S |
| IR64-Sub1 | 25.9bc (1.8) | 25.2ab (1.4) | 38.3b (1.5) | 0.56b (0.01) | 93a (4.4) | Present | HT |
| Savitri | 10.4e (0.9) | 10.9de (1.3) | 32.9bc (1.3) | 0.54b (0.02) | 20bc (5.6) | Absent | S |
| Savitri-Sub1 | 22.8c (1.1) | 22.2bc (1.4) | 34.2bc (1.4) | 0.57b (0.02) | 83a (5.6) | Present | T |
The genotypes containing the SUB1 QTL are marked in bold, and HT, T, S and HS denote highly tolerant, tolerant, susceptible and highly susceptible, respectively. The values presented are the mean ± s.e.m. (n = 5 for columns 1–4 and n = 10 for column 5) shown in parentheses, and values sharing the same letter in a column are not significantly different (P < 0.05) according to Tukey’s multiple range test.
In contrast, leaf porosity and leaf density showed no clear-cut pattern in Sub1 and non-Sub1 rice genotypes (Table 1), although we found significant variations within the studied genotypes (Supplementary data Table S2). The highest porosity was observed in IC459744 (approx. 52 %), while the lowest was in Swarna Sub-1 (22 %). As expected, the leaf density was highest in Swarna Sub-1 (0.79 g m−3) and least in IC464746 (0.52 g m−3). To explore the association of the SUB1 QTL with important submergence tolerance traits, namely LGF and leaf hydrophobicity, we took four genotypes (FR, IC, SW and SS) for further detailed investigation. In this panel, we chose to keep FR and SS as the Sub1-type genotype, which have comparatively higher LGF, and SW and IC, which have the least thickness of LGF.
Underwater retention of LGF and its relationship to epicuticular wax content
In addition to the initial thickness of the LGF, we worked out the underwater retention of the gas film in these four genotypes under submergence stress (Fig. 1A). A curve-fitting analysis showed that a quartic regression model fitted best, with a high R2 value (>0.998) in the case of all the genotypes, for explaining LGF depletion with time (Fig. 1A–D; Supplementary data Table S3). Hence, the rate of LGF depletion, the first-order derivative of LGF depletion with respect to time, followed a cubic model for all the genotypes. Although both FR and SS had a significantly higher LGF at ‘Day 0’ (before imposition of submergence stress), its daily depletion rate was also higher as compared with SW and IC (Fig. 1B). However, even with a faster LGF depletion rate, both FR and SS managed to retain their LGF up to 7 d after submergence, whereas it had completely disappeared in IC and SW after just 5 d of submergence (Fig. 1A). We found a direct relationship to the epicuticular wax content and initial level of LGF in these genotypes (Fig. 1C). The highest wax content was observed in FR, followed by SS (0.21 and 0.19 mg g–1 f. wt, respectively), while it was least in IC (0.15 mg g–1 f. wt). Comparison of the relative transcript abundance of LGF1, a gene associated with epicuticular wax biosynthesis, showed that its abundance was very high in FR and SS, while it was much less in IC and intermediate in SW (Fig. 1D).
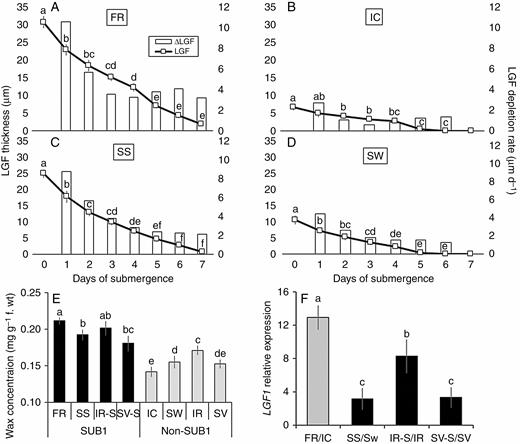
Periodic decline in leaf gas film (LFG) thickness under complete submergence over a period of 7 d (line diagram) and corresponding rate of LGF depletion (histogram) represented graphically for FR, FR13A (A), IC, IC450292 (B), SS, Swarna-Sub1 (C) and SW, Swarna (D), where the primary and secondary vertical axes correspond to LGF thickness (line diagram) and rate of LGF depletion (histogram), respectively. Here, the italicized name of the genotype marks it as Sub1 type, which is used uniformly for all figure legends. The initial content of epicuticular wax on leaf surfaces (E) and the relative expression level of the LGF1 gene in leaves (F) was measured before imposition of submergence stress in eight genotypes, i.e. Swarna, IR64, Savitri and their SUB1 introgressed counterparts, along with FR and IC. Relative change in LGF1 expression is shown in the SUB1 introgressed lines as compared with their non-Sub1 counterparts (shown as black bars), while the expression in FR was compared with respect to IC (shown in grey bar). The values presented are the mean ± s.e.m. (n = 3 for A–D; n = 5 for E and n = 3 for F), and values sharing the same letter are not significantly different (P < 0.05) according to Tukey’s multiple range test.
Leaf hydrophobicity and its retention under complete submergence
In the present study, we found an initial difference in leaf hydrophobicity (in terms of contact angle of water droplets) of the four studied genotypes (Fig. 2A). FR had the most hydrophobic leaf surface (approx. 135°), while IC possessed the least (approx. 123°). Upon complete immersion under water, we observed a differential loss of leaf hydrophobicity among the four genotypes (Fig. 2B). A clear superiority in retention of hydrophobicity of the leaf surface was observed in FR. Even after 96 h of complete submergence, its leaf surface was hydrophobic (>90°), while the contact angle was 37°, 48° and 67° for SW, IC and SS, respectively. It is interesting to note here that in both FR and SS, despite having a greater initial LGF and an almost similar leaf hydrophobicity, underwater retention of hydrophobicity differed greatly.
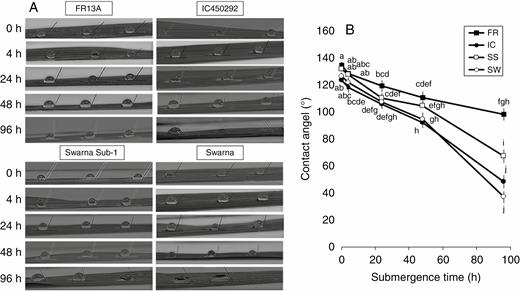
Periodic decline of leaf hydrophobicity (A) measured in terms of reduction in contact angle of the water droplet put on the leaf surface (B) in four rice genotypes (FR, FR13A; IC, IC450292; SS, Swarna-Sub1; and SW, Swarna) subjected to complete submergence for up to 96 h. The values presented are the mean ± s.e.m. (n = 3).
Effect of gas film removal on survival and elongation ability under submergence
Artificial removal of the LGF using Triton X-100 resulted in a significant reduction in plant survival especially in tolerant cultivars. The survival rate of FR and SS decreased to 80 % and 68 %, respectively, in S – G (submergence treatment in plants, where the LGF was removed) treatment as compared with 94 % and 89 % in S + G (submergence treatment in plants, where the LGF was kept intact) treatment (Fig. 3A). In SW, there was no plant survival in S – G treatment, while approx. 15 % survival was observed in S + G. In contrast, we did not observe any significant difference in survival of IC, whether LGF was present or had been removed at the time of submergence (Supplementary data Table S2). We found a significant increase in elongation ability between S + G and S – G treatments in both Sub1 (FR and SS) genotypes (Fig. 3B). An approx. 2.5-fold increase in elongation was observed in FR, while the rate of elongation was increased from 12 % to 20 % in SS and from 36 % to 42 % in SW.
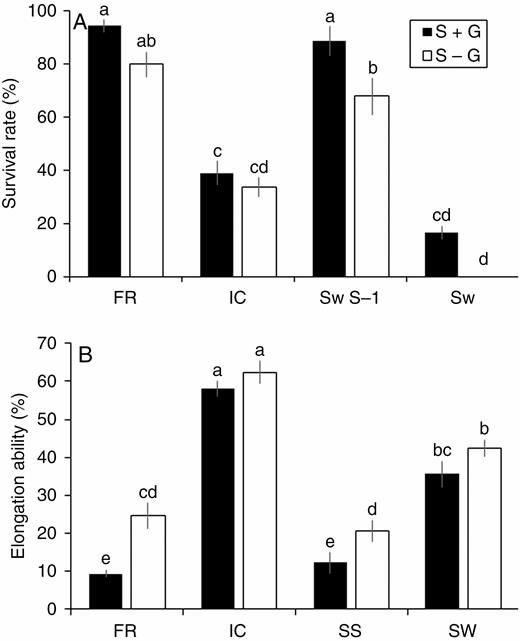
Changes in the survival rate (A) and elongation ability (B) in four rice genotypes (FR, FR13A; IC, IC450292; SS, Swarna-Sub1; SW, Swarna) subjected to 14 d of complete submergence with (S + G) and without (S – G) a leaf gas film. The values presented are the mean ± s.e.m. (n = 10 for A and n = 5 for B), and values sharing the same letter are not significantly different (P < 0.05) according to Tukey’s multiple range test.
Effect on ethylene production and chlorophyll degradation
Removal of the gas film significantly altered the levels of ethylene production in these genotypes (Fig. 4). In the present study, we observed a significant increase in ethylene production on the fourth and eighth day of stress imposition in FR and on the eighth and 12th day of stress imposition in SS under S – G treatment. Interestingly, there was little variation in the level of ethylene production under S + G and S – G treatments in IC, although it had much higher level of initial and total ethylene production among the four studied genotypes. No ethylene data were recorded for SW on the 15th day (after de-submergence) as not a single plant survived under S – G treatment.
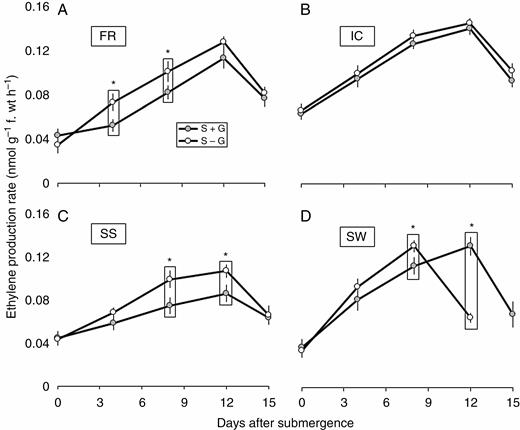
Periodic changes in rate of ethylene production in FR13A (A), IC450292 (B), Swarna-Sub1 (C) and Swarna (D) subjected to 14 d of complete submergence with (S + G) and without (S – G) a leaf gas film. The values presented are the mean ± s.e.m. (n = 3), and the data points marked by a box with ‘*’ at the top denote a significant difference (P < 0.05) between (S + G) and (S – G) treatments according to Tukey’s multiple range test.
The total chlorophyll concentration of the leaves decreased significantly with progression of submergence stress in all the four genotypes (Fig. 5; Supplementary data Table S2). In general, the rate of chlorophyll destruction was much faster in the submergence-intolerant genotypes SW and IC as compared with submergence-tolerant FR and SS. However, the difference in progressive chlorophyll destruction between S + G and S – G treatment was most prominent in SS. As expected, the differences were minimal in IC, which had the least initial LGF thickness.

Periodic changes in chlorophyll content in FR13A (A), IC450292 (B), Swarna-Sub1 (C) and Swarna (D) subjected to 14 d of complete submergence with (S + G) and without (S – G) a leaf gas film. The values presented are the mean ± s.e.m. (n = 5), and the data points marked by a box with ‘*’ at the top denote a significant difference (P < 0.05) between (S + G) and (S – G) treatments according to Tukey’s multiple range test.
Effect on periodic starch depletion and amylase activity
In the present study, we found some differences in initial starch content in the leaves of these genotypes (Fig. 6). The initial starch content was highest in FR (45 mg g–1 d. wt), followed by IC and SS, and was the least in SW (40 mg g–1 d. wt). Also, the periodic depletion rate varied between the genotypes. The tolerant genotypes FR and SS showed a comparatively slower rate of depletion than IC and SW. However, with the removal of the LGF (S – G treatment), a significantly lower starch concentration was observed in the leaves of both FR and SS from the ninth day (of stress imposition) onwards. Importantly, even with an increased rate of starch depletion in FR and SS under S – G treatment, the final starch concentration at the end of the stress period was much higher in these two genotypes as compared with SW and IC (29 and 31 mg g–1 d. wt, respectively).
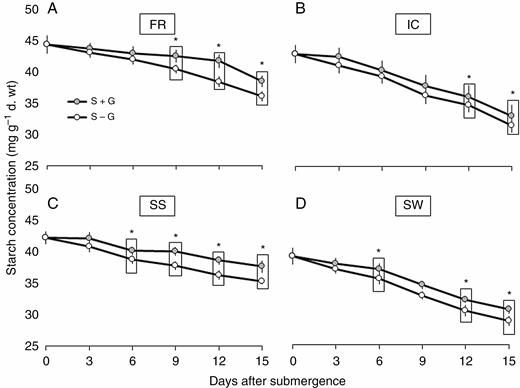
Periodic changes in total starch content in FR13A (A), IC450292 (B), Swarna-Sub1 (C) and Swarna (D) subjected to 14 d of complete submergence with (S + G) and without (S – G) a leaf gas film. The values presented are the mean ± s.e.m. (n = 3), and the data points marked by a box with ‘*’ at the top denote a significant difference (P < 0.05) between (S + G) and (S – G) treatments according to Tukey’s multiple range test.
Corresponding changes in the leaf amylase activity were also observed in the present study. In general, an increase in amylase activity was observed up to about the eighth day of stress imposition and then it showed a decreasing trend in all the genotypes (Fig. 7). Overall, irrespective of the presence or absence of the gas film, the amylase activity was much higher in the submergence-intolerant SW and IC than in FR and SS. Removal of the gas film increased the amylase activity especially in FR and SS. The differences between S + G and S – G treatments were more prominent on the fourth and eighth day of submergence as compared with the other studied time points. Like other traits, here also the difference between the treatments was least prominent in IC, which had the least initial LGF thickness.
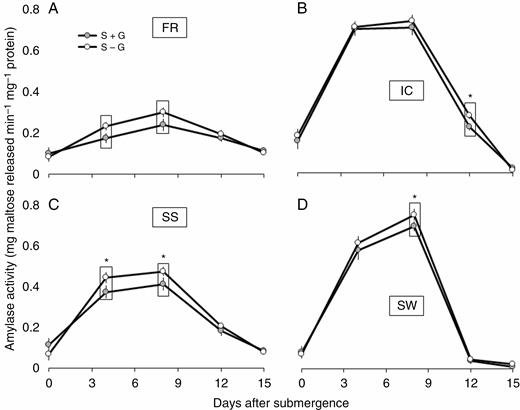
Periodic changes in α-amylase activity in leaves of FR13A (A), IC450292 (B), Swarna-Sub1 (C) and Swarna (D) subjected to 14 d of complete submergence with (S + G) and without (S – G) a leaf gas film. The values presented are the mean ± s.e.m. (n = 3), and the data points marked by a box with ‘*’ at the top denote a significant difference (P < 0.05) between (S + G) and (S – G) treatments according to Tukey’s multiple range test.
Changes in the gene expression profile under submergence with and without the leaf gas film
We made some interesting observations regarding the expression pattern of different genes associated with submergence tolerance in rice. A huge difference in the level of expression of the SUB1A gene was observed between Sub1 and non-Sub1 genotypes at different time points after the imposition of stress (Fig. 8A). The induction was >1000-fold in FR and SS at 3 and 5 d after submergence, while no induction was seen in IC and SW in the same time frame. However, looking at the difference in transcript abundance between S + G and S – G treatments, we found that after 1 d of submergence the expression of SUB1A was significantly higher in the S – G treatment, whereas the pattern was reversed on the thirrd and fifth day of submergence. Considerably less induction of SUB1A was observed in both Sub1 and non-Sub1 genotypes when their LGF was removed prior to stress imposition. A more or less similar trend in induction of SUB1B and SUB1C was observed, except that the differences between Sub1 and non-Sub1 genotypes were less prominent in these cases (Fig. 8B, C). On the fifth day of submergence, a relatively greater induction of SUB1C was observed in submergence-intolerant SW, but as a whole the expression of both SUB1B and SUB1C was lower in S – G treatment, except on the first day.
![Periodic changes in relative expression of SUB1A-1 (A–D), SUB1B (E–H) and SUB1C (I–L) in four rice genotypes [FR, FR13A (A, E, I); IC, IC450292 (B, F, J); SS, Swarna-Sub1 (C, G, K); SW, Swarna (D, H, L)] subjected to 14 d of complete submergence with (S + G) and without (S – G) a leaf gas film. The gene expression data were normalized using the Os18srRNA gene as internal control and calculated with respect to the unsubmerged control. The values presented are the mean ± s.e.m. (n = 3), and the bars marked with ‘*’ above denote a significant change (upregulation) in gene expression as compared with the unsubmerged control according to Tukey’s multiple range test.](https://oup.silverchair-cdn.com/oup/backfile/Content_public/Journal/aob/127/2/10.1093_aob_mcaa171/1/m_mcaa171_fig8.jpeg?Expires=1748522741&Signature=YeiexqEkTd8zEjsSFFQ7uNNr7E5MyPKriM5LdDzOC1YQrCydT4nBUoyyk2EYCEZsQ4uQ1QqSr-mlNeB-hyZkt5OuSmfh3FoyrZJ7mlfs9C6QAELwVy9RnvNZpVa7q83Wb5LfjlWjRhQAC-fn5-toOpkTkGE~HuFS9macTLnEqGP4wu0GhnCznF6Vd~XZEQhvSTyj3-m6nzLP~WGdkIDH4HmrNGY2DqqWps4u~qtSEv4QTJJueOMsbiG4RL4qi9-lna~5zelt56Sqvdaq5I97ILmnv3ATmv1nGfZrhsSlTfWYzi33atq7rLRseYuy8qBy0CNKxUeQ8rLkJCNSt6EmeQ__&Key-Pair-Id=APKAIE5G5CRDK6RD3PGA)
Periodic changes in relative expression of SUB1A-1 (A–D), SUB1B (E–H) and SUB1C (I–L) in four rice genotypes [FR, FR13A (A, E, I); IC, IC450292 (B, F, J); SS, Swarna-Sub1 (C, G, K); SW, Swarna (D, H, L)] subjected to 14 d of complete submergence with (S + G) and without (S – G) a leaf gas film. The gene expression data were normalized using the Os18srRNA gene as internal control and calculated with respect to the unsubmerged control. The values presented are the mean ± s.e.m. (n = 3), and the bars marked with ‘*’ above denote a significant change (upregulation) in gene expression as compared with the unsubmerged control according to Tukey’s multiple range test.
We also studied the changes in expression of genes reported to be responsible for carbohydrate utilization (Ramy3D), ethylene biosynthesis (ACS5) and anaerobic energy production (ADH1) (Fig. 9). Comparatively greater induction of these genes was observed in S – G treatment at each of the studied time points. Significant induction of Ramy3D was observed only in the S – G treatment in FR, whereas in the other genotypes the induction was significant in both S + G and S – G treatments right from ‘Day 1’ (Fig. 9A). Importantly, the differences between the two treatments were not significant at any time point in IC. Similarly, the increase in ACS5 expression was also higher in S – G treatment in almost all cases (Fig. 9B). We found that the induction started at a later stage in FR and SS as compared with IC and SW. When the LGF was kept intact, the induction of ACS5 in FR and SS was observed only after 5 d of submergence, but in the S – G treatment it showed induction from the third day of stress imposition. The ADH1 induction was also comparatively higher in IC and SW, which started upregulation of this gene from the first day of submergence irrespective of the presence ot absence of the LGF (Fig. 9C). However, like ACS5, the induction of the ADH1 gene was only significant after 5 d of stress in S + G treatment and after 3 d of stress in S – G treatment in both of the tolerant genotypes (FR and SS).
![Periodic changes in relative expression of Ramy3D (A–D), ACS5 (E–H) and ADH1 (I–L) in four rice genotypes [FR, FR13A (A, E, I); IC, IC450292 (B, F, J); SS, Swarna-Sub1 (C, G, K); SW, Swarna (D, H, L)] subjected to 14 d of complete submergence with (S + G) and without (S – G) a leaf gas film. The gene expression data were normalized using the Os18srRNA gene as internal control and calculated with respect to the unsubmerged control. The values presented are the mean ± s.e.m. (n = 3), and the bars marked with ‘*’ above denote a significant change (upregulation) in gene expression as compared with the unsubmerged control according to Tukey’s multiple range test.](https://oup.silverchair-cdn.com/oup/backfile/Content_public/Journal/aob/127/2/10.1093_aob_mcaa171/1/m_mcaa171_fig9.jpeg?Expires=1748522741&Signature=sEVi1PzY1aeVBLUKxbmf~qv6lneN9UJaiNuKxSmj19v-qiG5VYdLtDU0vd~KC1qJTeTv2WLe37M1Xjd45V~apr~JpL9YBI0cheoaUzAPoyrvVZIdl62UDwTnO07-mj9-n25062lbiNxrjcxolfYMcS3TFq7vJ~hILl9PVfm3WUPxiWI9Klz~nnghfaT1872t~4dHaC5zWolj5nkXV6Y-~VvUhujG5w6084qjFkCs49KSABksabR8vLj1mj7~TIWP-KbTue945TGy5pEWC91O0fVX1SAR7YDWspaSyZsfFP0zMZoQuclgrvR605eqheNJ60i0Xg0frJ68fFDc0IwaCw__&Key-Pair-Id=APKAIE5G5CRDK6RD3PGA)
Periodic changes in relative expression of Ramy3D (A–D), ACS5 (E–H) and ADH1 (I–L) in four rice genotypes [FR, FR13A (A, E, I); IC, IC450292 (B, F, J); SS, Swarna-Sub1 (C, G, K); SW, Swarna (D, H, L)] subjected to 14 d of complete submergence with (S + G) and without (S – G) a leaf gas film. The gene expression data were normalized using the Os18srRNA gene as internal control and calculated with respect to the unsubmerged control. The values presented are the mean ± s.e.m. (n = 3), and the bars marked with ‘*’ above denote a significant change (upregulation) in gene expression as compared with the unsubmerged control according to Tukey’s multiple range test.
Correlation study
Finally, to ascertain the inter-relationship among different studied traits and the gene expression pattern of the concerned genes, we prepared a correlation matrix following Pearson’s correlation coefficient (Table 2). It showed that the thickness of the LGF had a high positive correlation with the epicuticular wax content (0.954**), leaf hydrophobicity (0.845**) and expression of SUB1A-1 (0.952**) and LGF1 (0.912**), whereas it was not correlated with leaf porosity (–0.018) and leaf density (0.090), and negatively correlated (–0.960**) with SUB1C expression. It also showed a significantly high positive (0.880**) and negative (–0.948**) correlation with survival rate and elongation ability, respectively, in the studied genotypes. Interestingly, the expression of SUB1A-1 was highly correlated with the epicuticular wax content (0.933**), leaf hydrophobicity (0.842**) and expression of LGF1 (0.930**), but was not correlated with leaf porosity (0.110) and density (0.050).
Correlation matrix based on Pearson’s correlation coefficient between major morphophysiological traits and gene expression data under the present experimental set-up
| SR | EA | LGF | POR | HYD | DEN | WAX | LGF1 | SUB1A-1 | SUB1C | |
|---|---|---|---|---|---|---|---|---|---|---|
| SR | 1 | |||||||||
| EA | –0.759** | 1 | ||||||||
| LGF | 0.880** | –0.948** | 1 | |||||||
| POR | 0.092 | 0.276 | –0.019 | 1 | ||||||
| HYD | 0.622* | –0.800** | 0.845** | -0.041 | 1 | |||||
| DEN | 0.148 | –0.285 | 0.090 | –0.881** | 0.060 | 1 | ||||
| WAX | 0.859** | –0.865** | 0.954** | 0.044 | 0.845** | 0.010 | 1 | |||
| LGF1 | 0.906** | –0.841** | 0.916** | 0.055 | 0.649* | 0.048 | 0.894** | 1 | ||
| SUB1A-1 | 0.900** | –0.869** | 0.952** | 0.110 | 0.824** | 0.050 | 0.933** | 0.930** | 1 | |
| SUB1C | -0.929** | 0.875** | –0.960** | –0.068 | –0.808** | –0.097 | –0.937** | –0.935** | –0.992** | 1 |
The * and ** denote a significant correlation between two traits at P < 0.05 and P < 0.01, respectively, according ro paired t-test.
SR, survival rate; EA, elongation ability; LGF, leaf gas film thickness; POR, tissue porosity; HYD, leaf hydrophobicity; DEN, leaf density; WAX, epicuticular wax content; and LGF1, SUB1A-1 and SUB1C are the relative transcript abundance of LGF1, SUB1A-1 and SUB1C, respectively.
DISCUSSION
Submergence tolerance in rice is attributed to the action of the SUB1A-1 gene (a region present in the SUB1 QTL), which conditions submergence tolerance by inhibiting the ethylene response and consequently forcing quiescence on rice seedlings (Fukao and Bailey-Serres, 2008; Bailey-Serres et al., 2010). Similarly, the thickness of the LGF was also known to play a key role in submergence tolerance by facilitating underwater gaseous exchange (Colmer and Pedersen, 2008b; Pederson et al., 2009). Both of these mechanisms condition submergence tolerance, but the inter-relationships between these two are not very clear. The only available study in this regard by Winkel et al. (2014) reported the absence of any correlation between the presence of the active SUB1 gene in a genotype and underwater retention of LGF in that genotype. However, the question still remains as to whether the presence of the active SUB1 gene in the genetic background can influences the initial thickness of the LGF of that genotype. The answer is affirmative according to our study. The genotypes used in our study included high-yielding cultivars such as Swarna, IR64, Savitri and their respective SUB1 introgressed counterparts, (which effectively can be considered as near-isogenic lines). We observed a distinctive difference in initial LGF thickness in Sub1 and non-Sub1 genotypes (Table 1). A distinct difference in initial LGF thickness of non-Sub1 genotypes (Swarna, IR64 and Savitri) as compared with that of their SUB1 introgressed counterparts (Swarna-Sub1, IR64-Sub1 and Savitri-Sub1, respectively) suggests that greater LGF thickness in SUB1-containing genotypes must be the result of SUB1 introgression. Moreover, from cluster analysis and correlation data, it seems pretty conclusive that the LGF thickness trait is influenced by the presence/absence of SUB1. In fact, SUB1-containing genotypes (FR and SS) showed a higher rate of LGF decay than the non-Sub1 genotypes (IC and SW). Hence we infer that the presence of SUB1 has a positive influence on the initial build up of leaf hydrophobicity and as a consequence produces a thicker LGF (Figs 1 and 2; Table 2). This initial advantage of a thicker LGF in Sub1 genotypes, compared with their respective non-Sub1 counterparts, ultimately contributes towards better submergence tolerance ability as a whole. Whether the presence of SUB1 also alters other leaf morphological traits was not known. To answer this, we studied the correlation of the presence of SUB1 with leaf porosity and leaf density, but, unlike LGF, we did not find any distinct relationship for these two traits.
If the thickness of the LGF is a contributing factor towards submergence tolerance and SUB1 plays a pleotropic role by influencing LGF thickness, apart from its well-defined role as quiescence inducer by blocking ethylene perception, then removal of the LGF must have negative impact on submergence tolerance of Sub1 genotypes. We observed that artificial removal of the LGF just before submergence does affects a plant’s survival under submergence and the Sub1 genotypes actually suffer more than non-Sub1 genotypes due to this (Fig. 3A). Artificial removal of the LGF produced four distinct symptoms during submergence, i.e. increased ethylene accumulation, higher internode elongation, increased carbohydrate catabolism and enhanced chlorophyll degradation (Figs 3–7). All these effects negatively impact a plant’s survival under submergence and actually oppose the canonical function of SUB1 which imposes quiescence during submergence by limiting ethylene signalling. A literature survey suggests that of these four symptoms, increased ethylene accumulation seems to be the cause whilst the other three are the effects. An increased ethylene concentration can lead to shoot elongation by gibberellin-induced cell expansion and carbohydrate consumption due to increased activity of the amylases (Fukao and Bailey-Serres, 2008; Bailey-Serres et al., 2010). It also induces chlorophyll catabolic pathway genes such as chlorophyllase, which hasten chlorophyll degradation and hamper underwater photosynthesis (Ella et al., 2003; Das et al., 2005). SUB1A-1, a gene located in the SUB1 QTL, is capable of revoking all these ill effects by limiting ethylene response (Xu and Mackill, 1996; Fukao and Bailey-Serres, 2008; Bailey-Serres et al., 2010, Winkel et al., 2014). This provokes natural curiosity regarding what might be the role of the LGF in submergence tolerance. Our results clearly suggest that the presence of the LGF delays the onset of stress symptoms. SUB1-containing genotypes, due to having a thicker LGF, perceive stress more slowly. How exactly does this happen? We do not have any clear-cut answer at present in this regard; however, we speculate that LGF might play a role in the ethylene release process from the microenvironment so that the build-up of ethylene to a level which can trigger such unwanted ethylene-induced effects is avoided (Fig. 10). Previous studies suggested that the LGF can partially contribute to CO2 and O2 transport and the release process in rice under complete submergence (Pedersen et al., 2009; Winkel et al., 2011). We believe that might also be true for the ethylene release process. We also noticed comparatively higher expression of LGF1 in Sub1 genotypes than in their non-Sub1 counterparts (Fig. 2F). Even though we are unable to explain the molecular basis of this phenomenon at present, higher expression of LGF1 certainly implies greater deposition of epicuticular wax in the leaf surfaces of SUB1-containing genotypes (Fig. 2E). Thus, enhanced leaf hydrophobicity due to higher LGF1 expression might be the reason behind the increased LGF thickness of SUB1-containing genotypes underwater. Hence, from the evidence presented, we infer that the LGF present on the leaf surfaces of rice acts as a physical barrier for water contact and thus might help in better release and lower in planta accumulation of ethylene under submergence stress. The presence of active SUB1 genes in the genetic background has a positive influence on surface hydrophobicity and concomitant LGF thickness, which slows down the ethylene-induced senescence and carbohydrate breakdown process under submergence, and thus aids in overall submergence tolerance in rice (Fig. 10).
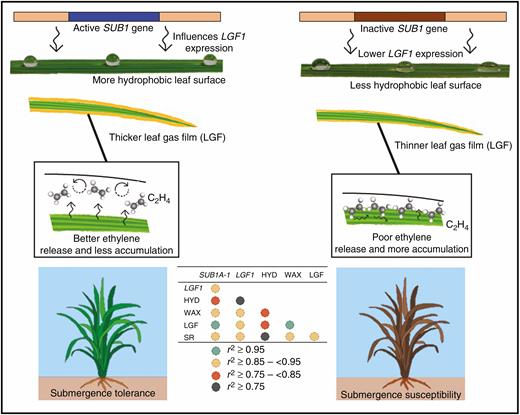
A typical representation of how SUB1 influences LGF1 gene action, leading to increased leaf hydrophobicity in Sub1 (left panel) and non-Sub1 (right panel) rice genotypes. Increased leaf hydrophobicity results in greater leaf gas film thickness upon submergence which helps in better ethylene release and less bioaccumulation of ethylene. This delays ethylene-induced senescence under submergence, aiding submergence tolerance in rice.
Conclusion
Taken together, we conclude that diversity exists in LGF thickness, and rice genotypes containing the SUB1 QTL possess a greater LGF thickness, which provides an initial advantage to these genotypes for improved submergence tolerance. We also found that higher expression of LGF1 in SUB1-containing genotypes resulted in increased epicuticular wax biosynthesis and greater leaf hydrophobicity. However, traits such as tissue porosity and leaf density did not differ significantly between Sub1 and non-Sub1 genotypes. Forced removal of the LGF resulted in partial loss of submergence tolerance owing to increased ethylene accumulation and faster chlorophyll and starch breakdown, especially in Sub1 lines. Faster induction of submergence-induced genes and increased accumulation of ethylene upon LGF removal suggests that the presence of the LGF not only acts as a physical barrier for stress perception but also serves as a medium for ethylene dissipation during the submergence period. Thus, its removal results in partial loss of the well-known quiescence function of SUB1 and overall submergence tolerance in rice.
SUPPLEMENTARY DATA
Supplementary data are available online at https://dbpia.nl.go.kr/aob and consist of the following. Figure S1: presence and absence of the SUB1 QTL in the genetic background of 12 rice genotypes and categorization of the 12 genotypes based on hierarchical cluster analysis on the basis of the leaf gas film thickness present on abaxial and adaxial leaf surfaces. Table S1: details of the primers used for real-time qPCR for expression analysis of the studied genes. Table S2: tables for the studied traits as per one-way factorial ANOVA. Table S3: mathematical models for the leaf LGF depletion pattern and rate of LGF depletion with respect to time.
ACKNOWLEDGEMENTS
We thank the Director of the ICAR-National Rice Research Institute, Cuttack for providing the necessary facilities to carry out this work. We also thank Dr B. P. Shaw and Dr B. B. Panda of the Institute of Life Sciences, Bhubaneswar for their assistance in measuring ethylene content. K.C. and R.K.S. conceptualized the study and designed the experiment. A.G. and P.J. conducted the experiment and performed physiological and biochemical studies. K.C. and S.R. performed the gene expression study. A.G. and K.C. analysed the data and wrote the manuscript. R.K.S., S.R., Kr.C. and Ar.G. revised the manuscript and provided necessary suggestions. All the authors agreed on the content of the manuscript.
FUNDING
A.G. would like to thank the Indian Council of Agricultural Research, New Delhi for financial support via an ICAR-NTS scholarship.
LITERATURE CITED
Author notes
These authors contributed equally to this work.
