


Abstract
Plant individuals within a population differ in their phenology and interactions with pollinators. However, it is still unknown how individual differences affect the reproductive success of plants that have functionally specialized pollination systems. Here, we evaluated whether plant individual specialization in phenology (temporal specialization) and in pollination (pollinator specialization) affect the reproductive success of the crepuscular-bee-pollinated plant Trembleya laniflora (Melastomataceae).
We quantified flowering activity (amplitude, duration and overlap), plant–pollinator interactions (number of flowers visited by pollinators) and reproductive success (fruit set) of T. laniflora individuals from three distinct locations in rupestrian grasslands of southeastern Brazil. We estimated the degree of individual temporal specialization in flowering phenology and of individual specialization in plant–pollinator interactions, and tested their relationship with plant reproductive success.
Trembleya laniflora presented overlapping flowering, a temporal generalization and specialized pollinator interactions. Flowering overlap among individuals and populations was higher than expected by chance but did not affect the individual interactions with pollinators and nor their reproductive success. In contrast, higher individual generalization in the interactions with pollinators was related to higher individual reproductive success.
Our findings suggest that individual generalization in plant–pollinator interaction reduces the potential costs of specialization at the species level, ensuring reproductive success. Altogether, our results highlight the complexity of specialization/generalization of plant–pollinator interactions at distinct levels of organization, from individuals to populations, to species.
INTRODUCTION
Individuals within a population differ in the use of the available resources, and such intraspecific variation plays an important role in many ecological processes (Bolnick et al., 2003, 2011; Araújo et al., 2010, 2011; Dall et al., 2012; Wolf and Weissing, 2012), including interactions between plants and their mutualists (Zywiec et al., 2012; Tur et al., 2014). In the case of plant–pollinator systems, because interactions are mediated by flower traits (e.g. Stang et al., 2006; Zywiec et al., 2012; Maruyama et al., 2014) and individuals are the true actors in these interactions (Tur et al., 2014), individual variation in floral traits affect their interaction with pollinators. Not surprisingly, individual variation in plant–pollinator interactions (e.g. Dupont et al., 2011; Tur et al., 2014) may ultimately influence plant reproductive success (Gómez and Perfectti, 2012).
Apart from morphological and physiological floral traits (Herrera, 1995; Zywiec et al., 2012; Gómez et al., 2014), phenology is also a functional trait known to vary among conspecific individuals and related to reproductive success (Violle et al., 2007). There is great variation in flowering phenology both within and among plant populations (e.g. Goulart et al., 2005; Pessoa et al., 2012), where spatial and temporal patterns of flowering influence plant–animal interactions, mediating plant fitness of both individuals and populations (Augspurger, 1981; Kudo, 2006; Dupont et al., 2014). As a consequence, flowering phenology is subject to selective pressures imposed not only by abiotic factors and resource availability (Goulart et al., 2005; Morellato et al., 2016) but also by plant–pollinator interactions (Rathcke and Lacey, 1985; Marquis, 1988; Kudo, 2006).
Temporal overlap of flowering phenology among individuals is a response to distinct ecological pressures, such as competition for mutualists or facilitation (Mosquin, 1971; Zimmerman, 1980; Augspurger, 1981; Rathcke, 1983; Rathcke and Lacey, 1985; Staggemeier et al., 2010). Higher overlap in flowering phenology among individuals within a population increases flower abundance, enhancing the attractiveness to pollinators and the availability of potential mates, thus enhancing individual pollination success and, consequently, fruit set (Augspurger 1981, 1983; Rathcke, 1983; Marquis, 1988). However, low flowering overlap can be a mechanism of pollination facilitation between individuals if it promotes the attraction and maintenance of pollinator populations over time (Rathcke, 1983; Rathcke and Lacey, 1985). Additionally, low overlap can reduce intraspecific competition for pollinators and favour outcrossing by forcing pollinators to visit different individuals (Mosquin, 1971; Zimmerman, 1980). However, because the response of pollinators to floral display size is density-dependent, an increasing number of co-flowering plants may shift the outcome interaction from facilitation to competition, affecting fitness differently (Rathcke, 1983; Feldman, 2006; Mitchell et al., 2009; Braun and Lortie, 2019).
The relationship between plant individuals and their pollinators can be described as an ecological network (Fortuna et al., 2008), in which metrics such as centrality (i.e. connectivity) and degree of specialization (i.e. diversity of interactions) can be calculated at the individual level and used to test ecological and evolutionary hypotheses. For example, individual-based networks originated from the interaction of Erysimum mediohispanicum with its flower visitors revealed that central and generalist individuals had higher reproductive success than peripheral and specialist individuals (Gómez and Perfectti, 2012). Nevertheless, few empirical studies have used ecological networks as a tool to explore plant–pollinator relationships at the individual level (Gómez and Perfectti, 2012; Tur et al., 2014; Valverde et al., 2016). In fact, past studies have only considered individuals from ecologically generalist plant and/or animal species (Gómez and Zamora, 1999; Gómez and Perfectti, 2012; Tur et al., 2015) interacting with a high number of partner species (sensuOllerton et al., 2007). In specialized systems, where pollination is carried out by a small number of functionally similar pollinator species (Fenster et al., 2004), the ability of individual plants to interact with different pollinator species might be especially important in increasing reproductive success.
Here, we evaluated the intraspecific variation in flowering phenology of Trembleya laniflora (Melastomataceae) and its interactions with pollinators. Trembleya laniflora is an allogamous, buzz-pollinated species associated with crepuscular bees, and it is endemic to the campo rupestre of Brazil, with flowering concentrated in the dry season (Soares and Morellato, 2018). Buzz-pollination by crepuscular-foraging bees is a functionally specialized pollination system that has been described as essential for the reproduction of many plant species (Hopkins et al., 2000; Ollerton et al., 2007; Franco and Gimenes, 2011; Cordeiro et al., 2017; Krug et al., 2018; Soares and Morellato, 2018).
We evaluated how the intraspecific flowering overlap and the level of specialization or generalization in the pollination interactions of individual plants is related to reproductive success. We quantified flowering phenology (amplitude, duration and overlap) and plant–pollinator interactions (number of flowers visited by pollinators) as well as the reproductive success of T. laniflora individuals at three distinct locations. We expected that the overlap in phenology among individuals would favour their reproductive success because it increases the availability of potential mates and/or floral display size to a few specialized pollinators (Soares and Morellato, 2018; Braun and Lortie, 2019; Bergamo et al., 2020). Additionally, we expected that the central and generalist individuals would have the highest reproductive success given their ability to interact with distinct pollinator species (Gómez and Perfectti, 2012).
MATERIALS AND METHODS
Study system
This study was conducted in three different sites of rupestrian grasslands, also known as campo rupestre (Silveira et al., 2016). All sites are located at Serra do Cipó, Minas Gerais, southeastern Brazil. The rupestrian grasslands are a vegetation mosaic that cover most of the altitudes above 900 m a.s.l. across the Espinhaço mountain range and are dominated by grasslands surrounding rocky outcrops of different extensions (Silveira et al., 2016; Morellato and Silveira, 2018). The study sites are at least 4 km (linear and planar distances) apart from each other and are at different altitudes: Cedro (CE), at 1011 m a.s.l (43°34′56″W; 19°14′16″ S), hereafter referred to as the low-altitude site; Pedra do Elefante (PE), at 1255 m (43°33′20″ W; 19°17′34″ S), hereafter referred to as the mid-altitude site; and Quadrante 16 (Q16), at 1303 m (43°35′31″ W, 19°17′42″ S), hereafter referred to as the high-altitude site. The vegetation of all three sites is characterized by rocky outcrops where Trembleya laniflora and other woody and herbaceous species grow surrounded by wet, sandy and stony grasslands with a high diversity of species, mainly grasses and sedges (de Mattos et al., 2019). Flowering occurs year round in the plant community of the tree sites (Rocha et al., 2016).
During 2014, we recorded the reproductive phenology and pollination interactions of at least 31 reproductive individuals of T. laniflora occurring within 1-ha plots at each site (94 individuals in total), as described by Soares and Morellato (2018). Trembleya laniflora is a shruby, non-apomictic and self-incompatible species that is endemic to rocky outcrops of the rupestrian grasslands of the southern portion of the Espinhaço mountain range (Martins, 1997; Soares and Morellato, 2018). The species presents large, showy and white-colored flowers (Fig. 1A) with nocturnal anthesis and is buzz-pollinated by large crepuscular-foraging bees (Soares and Morellato, 2018).
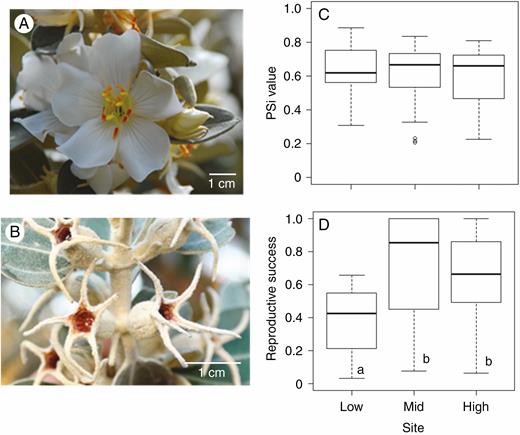
Details of the inflorescence (A) and of immature fruits (B) and boxplot of the proportional similarity index (PSi) (C) and reproductive success (D) of T. laniflora from three rocky outcrop sites at Serra do Cipó, southeastern Brazil. Reproductive success was measured as the mean individual fruit set per flower produced. Low, low-altitude site (Cedro); Mid, mid-altitude site (Pedra do Elefante); High, high-altitude site (Quadrante 16). Different letters indicate significant differences at P < 0.001 (tMid = 4.76; tHigh = 3.93; R2GLM = 0.20; P < 0.001). Black lines represent the medians and open circles in (C) are outliers.
Phenological observations and reproductive success
Phenological observations were conducted every month from January to December 2014. During the main flowering season, from July to August, the observations were done fortnightly. The number of reproductive structures (floral buds, flowers, immature and mature fruits) was estimated in every field expedition from five tagged branches of the sampled T. laniflora individuals (31 individuals from the low-altitude site, 32 from the mid-altitude site and 31 from the high-altitude site; Fig. 1A, B). Individual reproductive success was calculated as the ratio between the highest number of immature fruits scored and the total number of flowers produced (Athayde and Morellato, 2014). Differences in reproductive success between sites (populations) were assessed using a generalized linear model (GLM) with locations as the predictor variable (Nelder and Wedderburn, 1972) and assuming a quasibinomial distribution (Zuur et al., 2009). All analyses were conducted using R software (R Core Team, 2020).
Flowering overlap and individual temporal specialization
We estimated the flowering overlap among T. laniflora individuals within each population as a measure of individual specialization (sensuBolnick et al., 2003) in phenology. Taking the entire reproductive period of the population as a reference, individuals may vary in their flowering activities, such as the length of the flowering period (duration) and the amount of flowers produced over time (amplitude). Variation in flowering activities between conspecific individuals can be interpreted in terms of individual specialization (sensuBolnick et al., 2003), which we call hereafter ‘individual temporal specialization’.
We quantified the degree of individual temporal specialization using the individual specialization (IS) index, adapted from Bolnick et al. (2002). For this, we calculated the proportional similarity index (PSi) for each individual using the reproductive effort (number of flowers produced) of individuals over time. The PSi measures the overlap between a given individual’s phenology and the phenology of the overall population and was calculated as:
where pij is the proportion of flowers produced by individual i during the jth month in relation to the total production of individual i (Supplementary Data Fig. S1), qj is the proportion of flowers produced by the population in the jth month in relation to the total production of population, and n is the duration of the phenophase for the entire population in months. In order to minimize potential effects of crown size or plant height, qj was calculated as the average of pij values across all individuals. The population-wide prevalence of individual temporal specialization (IS) was then calculated as the average of individuals’ PSi values. Both PSi and IS assume the value of 1 when there is no individual temporal specialization (high phenological overlap) and values closer to 0 as individual temporal specialization becomes stronger (Bolnick et al., 2002) or there is no flowering overlap.
The number of flowers produced, which we sampled fortnightly during the main flowering season (July and August), was pooled into one sample per month to standardize the estimates of PSi at monthly intervals. We accounted for temporal autocorrelation in all steps of the analysis (see details below) since the occurrence of one phenological event is not independent of the previous one. For instance, flower production in a given month depends on the number of flower buds produced in the previous month.
Because in pollination systems there might be selective pressures for both overlap (temporal generalization) and segregation (temporal specialization) of flowering phenologies, we tested for the presence of both by applying a two-tailed test. We built a null model based on two rules: (1) for each individual, the randomized onset of flowering was dependent on the individual flowering duration and sorted within the population flowering period (Soares and Morellato, 2018), which is assumed to be the population physiological limit; and (2) due to the temporal autocorrelation of the phenological data, the shape of the phenological distribution was kept fixed during the randomizations (Staggemeier et al., 2010). For each simulation (n = 999), null PSi values for all individuals and the corresponding IS index were calculated, generating a distribution of null IS values on which we applied a two-tailed test (P = 0.05). If the observed IS value was lower than at least 975 of the simulated values, individuals were considered temporal specialists whose phenologies had relatively little overlap with the population; however, if the observed IS value was higher than at least 975 of the simulated values, individuals were considered temporal generalists with phenologies overlapping more than what would be expected by chance.
In order to compare the degree of temporal specialization among populations, differences among sites were tested using a GLM with a quasibinomial distribution (Nelder and Wedderburn, 1972; Zuur et al., 2009), PSi values as the response variable and sites as the predictor variable. The pseudo-R2 values of the GLM were calculated as the ratio of the difference between the deviances (null – residual) to the null deviance (Zuur et al., 2009). All analyses were conducted in R (Ross and Gentleman, 1996; R Core Team, 2020); a script with the analytical steps used to estimate individual temporal specialization in phenology is available in the Supplementary Data Appendix 1.
Trembleya laniflora pollination networks and individual pollinator specialization
Diversity of pollinators and frequency of visits.
During the main flowering season (July and August), we randomly conducted 10-min surveys of floral visitors to blooming individuals in the three studied sites (37 individuals from the low-altitude site, 35 from the mid-altitude site and 32 from the high-altitude site). All observations were carried out from 0530 to 1830 h, giving a total of 80 h per population. We estimated the available resources counting the number of open flowers in the focal plant, and quantified the number and identity of the bee pollinating species, and the number of flowers visited by each bee species. Pollinators were mainly identified in the field and, when necessary, collected for subsequent identification (Soares and Morellato, 2018 and Supplementary Data Table S1). To determine differences in the total number of pollinator visits between sites, we used a GLM with a Gaussian distribution (Zuur et al., 2009). For this, only plant individuals surveyed for at least six censuses (total of 1 h) were used. Sampling sufficiency per site was evaluated using the local abundance of pollinators through rarefaction curves generated for each population with the function specaccum of package vegan in R (Oksanen et al., 2019; R Core Team, 2020). The results indicated that the observed number of seven or eight bee species per population is an accurate estimate of the local pollinator fauna (Supplementary Data Fig. S2).
Network metrics.
We constructed plant individual-based networks for each population to evaluate how specialization in the pollinator interactions related to the reproductive success of T. laniflora. We considered the number of flowers visited as the frequency of interactions of each pollinator species, which was divided by the number of surveys observed for each plant in order to account for sampling effort. We compared the structural properties of the individual-based networks by calculating the indices described below (Blüthgen et al., 2006; Dormann et al., 2008; Tur et al., 2014).
Connectance (C) is the proportion of observed interactions (I) in relation to the number of possible interactions in each network (Jordano, 1987). Interaction evenness (E2) measures the heterogeneity of interactions (symmetry) and varies from 0 to 1, with lower values indicating uneven distributions and higher values indicating a uniform distribution of links in the network (Tylianakis et al., 2007). Network-level specialization (H2′) is based on the deviation of the number of interactions carried out by a given node and the expected total number of interactions for each node based on its abundance (here approximated by the total interaction frequency; Blüthgen et al., 2006). H2′ values vary from 0 (no specialization) to 1 (perfect specialization) (Blüthgen et al., 2006; see also Dormann et al., 2009).
We also calculated individual-level network metrics. Centrality metrics (degree centrality, closeness centrality and betweenness centrality) were used to evaluate how well connected a given individual plant is in the network (Gómez and Perfectti, 2012). Degree centrality (Cd) is defined by the number of pollinator species to which T. laniflora individuals are connected. Higher Cd values indicate individuals connected with a higher diversity of pollinators, i.e. more generalists (Gómez and Perfectti 2012). Closeness centrality (Cc) measures the proximity of a node (T. laniflora individual) to all the nodes in the network. Cc gives information about direct and indirect interactions among the nodes, i.e. plant individuals and pollinator species, of the network (Freeman, 1979; Martín González et al., 2010). High Cc values are found for T. laniflora individuals that share more pollinators with other individuals in the population. Betwenness centrality (Cb) measures the importance of a node as a connector between parts of the network. Plants with high Cb values act as bridges, connecting individuals of distinct network areas that would otherwise not be connected (Freeman, 1979; Barrat et al., 2004; Newman, 2004).
Finally, the individual specialization index (d′) was used to quantify the degree of interaction specialization of T. laniflora individuals. The d′ index represents the deviation of the observed interaction frequencies from a null model that assumes all partners (plant individuals and pollinators) are used in proportion to their availability. This index varies from 0, indicating interaction generalization, to 1, indicating higher interaction specialization (Blüthgen et al., 2006). All metrics were calculated utilizing the package bipartite in R (Dormann et al., 2008; Dormann, 2011) and the structure of the obtained networks was evaluated by comparison with null networks generated through the algorithm vaznull, which constrains the connectance, number of interactions and network size (Vázquez et al., 2007).
Testing the relation between individual specialization and reproductive success
In order to determine the importance of temporal specialization in reproductive success, we tested the effect of flowering overlap in plant–pollinator interactions (for example, in the number of interactions, in the degree of specialization and in the centrality of individuals) as well as in individual reproductive success. Because observations can be site-dependent, we used linear mixed models (LMMs) with site as the random effect (Zuur et al., 2009). In the models, individual temporal specialization, measured as PSi, was considered as the fixed effect and (1) frequency of interactions, (2) individual interaction specialization (measured as d′), (3) degree centrality, (4) closeness centrality, (5) betweenness centrality and (6) reproductive success were considered as response variables. For variables (1) and (6) we used generalized linear mixed models (GLMMs) with a binomial distribution (Zuur et al., 2009), adding observation-level random effects (OLREs) to reduce overdispersion in the residuals, which was detected during model validation procedures (Harrison, 2015).
To evaluate the importance of individual specialization in plant–pollinator interactions for plant reproductive success, i.e. the role of individual pollinator specialization, we used a model selection approach (Zuur et al., 2009). First, we fitted a GLMM with a binomial distribution containing all the non-correlated explanatory variables and sites as a random effect. In this model, individual interaction specialization (d′) and centrality indices (Cd and Cb) were considered the fixed effects and reproductive success was considered the response variable. The overdispersion detected in the residuals of the model was dealt with by adding an OLRE (Zuur et al., 2009; Harrison, 2015). The optimal GLMM was determined by excluding the most non-significant parameter sequentially, after which the model was validated, following Zuur et al. (2009). The LMM and GLMMs were fitted using the lmer4 package in R and marginal and conditional R2GLMM were obtained with the function r.squaredGLMM, available in the MuMIn package (Nakagawa and Schielzeth, 2013; Bates et al., 2015; Barton, 2020; R Core Team, 2020).
RESULTS
Trembleya laniflora flowered mainly during the dry season, with higher production of flowers from June to August in all three sites (Supplementary Data Fig. S1). The PSi values did not differ between populations (PSi model, χ2 = 2.10; P = 0.35; Fig. 1C). In all sites, the overlap between a given individual’s flowering activity and the flowering activity of the population was higher than expected by chance, with observed individual temporal specialization (IS) values significantly higher than null values, meaning individuals were generalized (Fig. 2; Supplementary Data Fig. S2). Moreover, the low-altitude site showed significantly lower reproductive success than the mid- and high-altitude sites (R2 = 0.20, P < 0.001; Fig. 1D).
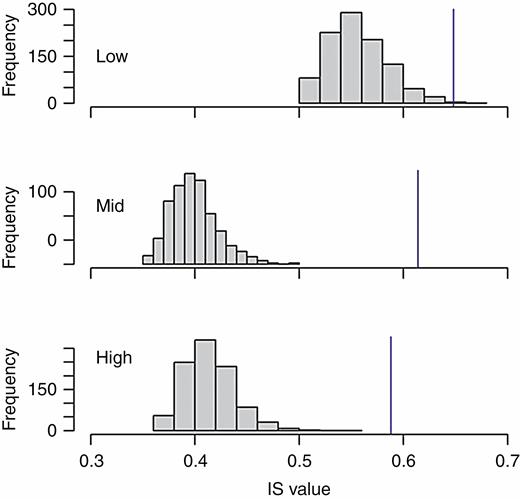
Observed (blue line) and simulated (grey bars) distributions of the IS index, which was used to quantify individual specialization in flowering activity of T. laniflora from three rocky outcrop sites at Serra do Cipó, southeastern Brazil. Low, low-altitude site (Cedro); Mid, mid-altitude site (Pedra do Elefante); High, high-altitude site (Quadrante 16). An IS value of 1 indicates there is no individual specialization, whereas values closer to 0 indicate stronger individual specialization.
Populations of T. laniflora showed significant network-level specialization in their interactions with pollinators (mean H2′ values = 0.65; Table 1). The number of visits differed among populations, ranging from 66 at the mid-altitude site to 419 interactions at the high-altitude site (χ2 = 13.17; R2 = 0.16, P = 0.001, Table 1). In comparison with the mid- and low-altitude populations, the high-altitude population had a greater number of visits from pollinators (I), higher connectance (C), more evenly distributed interactions (E2) and lower network-level specialization (H2′). However, C and E2 values did not differ from the null models, indicating that both the number and distribution of interactions were not different from what was expected by chance (Table 1, Fig. 3).
Results for the temporal specialization in flowering phenology and plant-pollination network metrics of T. laniflora from three rocky outcrops sites at Serra do Cipó, southeastern Brazil. N, number of individuals sampled in the phenological observations; IS, individual specialization index in flowering activity; Ni, number of plant individuals surveyed for at least six 10-min surveys during the pollination observations. Bold values are significant (P < 0.05), based on the null models generated by 999 (IS) and 9999 (H2′) permutations (Monte Carlo test). Different letters indicate significant differences at P < 0.001. Means are given, with errors in brackets. Low, low-altitude site (Cedro); Mid, mid-altitude site (Pedra do Elefante); High, high-altitude site (Quadrante 16)
| Site | |||
|---|---|---|---|
| Low | Mid | High | |
| Number of individuals (N) | 31 | 32 | 31 |
| Individual temporal specialization (IS) | 0.65 (± 0.14)a | 0.61 (± 0.17)a | 0.59 (± 0.18)a |
| Network metrics | |||
| Number of individuals (Ni) | 28 | 21 | 20 |
| Number of pollinator species (N bees) | 7 | 8 | 8 |
| Total number of interactions (I) | 93 (3.2 ± 6.9)b | 66 (2.6 ± 6.0)b | 419 (18.2 ± 27.9)a |
| Connectance (C) | 0.17 | 0.23 | 0.31 |
| Interaction evenness (E2) | 0.53 | 0.51 | 0.67 |
| Specialization network level (H2′) | 0.92 | 0.64 | 0.40 |
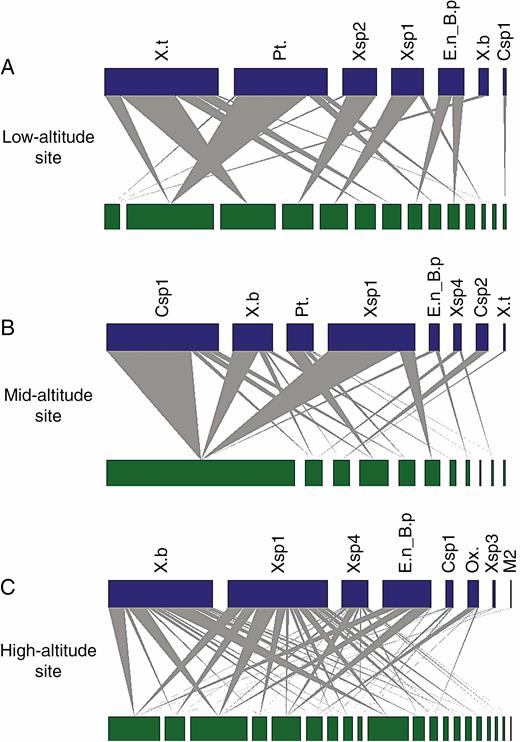
Individual plant–pollinator networks of T. laniflora from three rocky outcrops sites at Serra do Cipó, southeastern Brazil. (A) Low-altitude site (Cedro); (B) mid-altitude site (Pedra do Elefante); (C) high-altitude site (Quadrante 16). Green nodes represent the proportion of flowers visited by bee species for each individual plant. Blue nodes represent the frequency of interactions of each pollinator species. Grey wedges indicate individual plant–pollinator interactions. Csp1, Centris sp1; Csp2, Centris sp2; E.n_B.p, Eulaema nigrita and Bombus pauloensis; M2, morphotype 2; Ox., Oxaea sp., Pt, Ptiloglossa sp1; X.b, Xylocopa bimaculata; Xsp1, Xylocopa sp1; Xsp2, Xylocopa sp2; Xsp3, Xylocopa sp3; Xsp4, Xylocopa sp4; X.t, Xylocopa truxali. Data for E. nigrita and B. pauloensis were combined due to the morphological similarity of species and difficulty distinguishing them in the field.
Regarding flowering, individual temporal specialization (PSi) had no effect on reproductive success (z = 0.016, χ2 = 0.025, P = 0.87; Fig. 4A) or on the interaction with pollinators (all models were non-significant, P > 0.05; Supplementary Data Table S2). Therefore, increased floral display size due to high overlap did not affect the pollination and reproductive success of T. laniflora individuals. Finally, model selection indicated a positive effect of degree centrality (Cd) on reproductive success (z = 2.95, R2m = 0.21, R2c = 0.99, P = 0.003; R2m is R2 marginal, representing the variance explained by the fixed effect and R2c is R2 conditional, representing the variance explained by both the fixed and the random effects in the GLMMs; Fig. 4B), suggesting that pollinator generalists and central individuals (i.e. individuals that were visited by more pollinator species) had higher reproductive success.
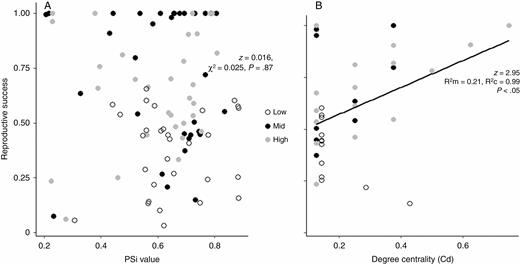
Relation of flowering overlap (A), measured as the proportional similarity index (PSi) and degree centrality (Cd) (B) to the reproductive success of individual plants of T. laniflora from Serra do Cipó, southeastern Brazil. PSi values of 1 indicate generalist individuals with high overlapping phenologies, whereas values closer to 0 indicate specialist individuals with relatively little overlap in their phenologies. Degree centrality was calculated for plant individuals that had interactions in the local plant–pollinator networks. R2 marginal (R2m) represents the variance explained by the fixed effect and R2 conditional (R2c) represents the variance explained by both the fixed and the random effects in the GLMMs (Nakagawa and Schielzeth, 2013). GLMMs were significant (P < 0.05).
DISCUSSION
Trembleya laniflora populations have a specialized pollination interaction network within a specialized crepuscular buzz-pollination system. Regarding phenology, individual temporal generalization, demonstrated by high overlap in flowering activity, did not affect interactions with pollinators or reproductive success. However, individual generalization in the interactions with pollinators, i.e. individual pollinator generalization, enhanced the reproductive success of central individuals with higher pollinator species richness. Therefore, our results show that individual levels of generalization are key in maintaining a reproductive population of a species with a highly specialized pollination system.
Our results confirmed the seasonal flowering of T. laniflora, which is concentrated during the dry season (between June and August). Seasonal flowering has been observed for most campo rupestre species (Brito et al., 2017; Soares and Morellato, 2018; Le Stradic et al., 2018), despite the continuous flowering pattern prevailing at the community level across different altitudes and vegetation types (Rocha et al., 2016; Le Stradic et al., 2018). Therefore, in the campo rupestre one can expect overall high diversity of plants with different pollination systems and of pollinators year round (Carstensen et al., 2014, 2016; Camargo et al., 2019). Seasonal phenologies are described for pollinator-dependent Melastomateceae species in rupestrian grasslands (Brito et al., 2017; Soares and Morellato, 2018) and are generally interpreted as a mechanism that enhances attractiveness to pollinators (Augspurger, 1981, 1983; Rathcke, 1983; Kudo, 2006; Brito et al., 2017; Soares and Morellato, 2018). Crepuscular buzz-pollination is rare, or at least sparsely reported, for campo rupestre and other ecosystems (Hopkins et al., 2000; Franco and Gimenes, 2011; Cordeiro et al., 2017; Krug et al., 2018). Therefore, whether co-flowering species can favour the reproductive success of T. lanifora remains uncertain and is a matter that needs further investigation.
Community-level pollination networks tend to higher generalization towards tropical latitudes (Schleuning et al., 2012), but population-level netwoks of T. laniflora showed relatively high specialization (mean H2′ = 0.65). However, it is still unclear whether population level networks show a similar geographical trend. The three populations differed in the number of pollinator visits and reproductive success. Individual temporal generalization, with highly overlapped phenology, did not affect the number of interactions with pollinators or individual reproductive success. Potential mechanisms underlying the observed differences in reproductive success among populations are abiotic factors, such as temperature and light intensity, which differ between sites (Fernandes, 2016; Silveira et al., 2016) and are known to directly or indirectly affect plant reproduction (Rathcke and Lacey, 1985; Herrera, 1995; Kudo, 2006; Morellato et al., 2016). Because environmental factors are reliable signals of the most favourable periods for plant reproduction (Elzinga et al., 2007), variations in abiotic conditions between populations might also relate to changes in flowering periods and affect both ecological interactions and reproduction success (Rathcke and Lacey, 1985; Elzinga et al., 2007).
The fact that the observed levels of individual temporal specialization were lower than expected by chance (observed IS values were higher than null values; Fig. 2) suggests that the overlap in phenology among individuals is somehow favoured in this species. Highly overlapped flowering can be beneficial by increasing the availability of potential mates and the attraction of pollinators, given the higher flower density (Kudo, 2006; Spigler and Chang, 2008; Bartkowska and Johnston, 2014). However, our results showed that at the individual level higher flowering overlap had no effect on interactions with pollinators and reproductive success of T. laniflora individuals. Thus, high flower density did not favour individual reproductive success of T. laniflora, although plant–pollinator interactions are more often thought to be under positive frequency dependence (Rathcke, 1983; Ghazoul, 2006). At the same time, potential effects of intraspecific competition for pollinators in this system may be unlikely due to the paucity of crepuscular pollinated species in the community and the high abundance of the large bee pollen vectors (Benadi and Pauw, 2018).
Within populations, greater reproductive success was related to higher frequency of visitors (high-altitude population) and more generalized pollinator interactions (mid- and high-altitude populations), suggesting a positive effect of both frequency and diversity of pollinators on reproductive success (Waser, 1983; Herrera, 1996). In species-level ecological networks, strongly linked central nodes are described as having a major impact on community structure and function (Martín González et al., 2010; Sazima et al., 2010), which is also the case for individual-level plant–pollinator interactions (Gómez and Perfectti, 2012; Lázaro et al., 2020). In agreement with previous studies on Erysimum mediohispanicum (Gómez and Perfectti, 2012), we found that central well-connected individuals (higher degree centrality) within pollination networks achieved higher reproductive success (Fig. 4B). We consider that the higher diversity of pollinators, enhancing the probability of an individual receiving conspecific pollen from different plants, is a key factor driving the reproductive success of T. laniflora. However, T. laniflora has a relatively specialized pollination system, characterized by up to 13 functionally specialist buzz-pollinating bee species in the area (Fig. 3, Supplementary Data Table S1), which determines a limit for defining generalized individuals. The individual generalized pollinator interactions might be more important for plant species having specialized pollination systems and inhabiting areas with harsh environmental conditions (Waser et al., 1996; Kuppler et al., 2016), as is the case in T. laniflora. Hence, we hypothesize that the slope of the relationship between degree centrality (or other similar metrics) and reproductive success is higher in more specialized systems. Future work evaluating this relationship in a variety of species spanning different levels of pollinator specialization should allow this hypothesis to be tested.
Our results also suggest that the degree of ecological generalization can be a variable attribute of individuals and populations rather than a fixed trait of the entire plant species (Herrera, 2005; Gómez and Perfectti, 2012). Moreover, our findings highlight the complexity of specialization/generalization in plant–pollinator interactions at distinct levels of organization, from individuals to populations, to species. We emphasize that even in highly specialized pollination systems, ecological generalization at the individual level is a mechanism that may reduce the potential costs of functional specialization at the species level, since individuals with higher pollinator generalization contribute positively to reproductive success.
SUPPLEMENTARY DATA
Supplementary data are available online at https://dbpia.nl.go.kr/aob and consist of the following. Figure S1: flowering phenology, total number of flowers and proportion of flowers produced per individual and population of T. laniflora in three rocky outcrop sites at Serra do Cipó, southeastern Brazil. Figure S2: rarefaction curves generated to fit the number of samples per population to the local abundance of pollinators visiting T. laniflora in three rocky outcrops sites at Serra do Cipó, southeastern Brazil. Table S1: pollinator species of three populations of T. laniflora from rocky outcrops located at Serra do Cipó, southeastern Brazil. Table S2: relation between individual temporal specialization and the plant–pollinator interactions of individual plants of T. laniflora from Serra do Cipó, southeastern Brazil. Appendix S1: R script to estimate individual temporal specialization.
ACKNOWLEDGEMENTS
We thank ICMBio for granting the permits needed to work at Serra do Cipo National Park (PNSC) and its buffer zone, the Environmental Protection Area Morro da Pedreira. We thank the Vellozia Reserve, the Pousada Pouso do Elefante and the Cedro Company for allowing us to work in their lands and the PELD-CRSC for the logistical support. We are also grateful to C. Schlindwein for identification of the bee species, to Luis Felipe Daibes for help during the review of the data analyses, and to André L. Giles, Annia Susin Streher, Bruno P. Souza, Denise. D. Fontana, Eduardo A. Athayde, Fabíula M. Arantes, Felipi C. Soares, Fernanda Hurbath, Jéssica G. Soares, João Pena, Kauê F. Fernandes, M. Gabriela, G. Camargo, Maressa I. Valadares, Nathália M. W. B. Rocha, Pedro Pitanguy, Rafael L. Melo, Thaís M. Mesquita and Vanessa C. Soares for assistance during the field work.
FUNDING
The present research was supported by the São Paulo Research Foundation FAPESP (FAPESP-VALE-FAPEMIG grant 2010/51307-0, FAPESP-Microsoft Research Institute grant 2013/50155-0 and FAPESP grant 2009/54208-6) and by the National Council for Scientific and Technological Development (CNPq) (grant CNPq-PVE 400717/2013-1), all to L.P.C.M. N.C.S. received a doctoral fellowship and support from Coordenação de Aperfeiçoamento de Pessoal de Nível Superior (CAPES)–Brasil (CAPES Finance Code 001), through the Programa de Pós-graduação em Ciências Biológicas (Biologia Vegetal)–UNESP; V.G.S. received fellowships from FAPESP (grants 2014/13899-4 and 2016/02312-8); L.P.C.M. receives a research productivity fellowship and grant from CNPq (311820/2018-2).
LITERATURE CITED
