


Abstract
There is a paucity of empirical research and a lack of predictive models concerning the interplay between spatial scale and disturbance as they affect the structure and assembly of plant communities. We proposed and tested a trait dispersion-based conceptual model hypothesizing that disturbance reinforces assembly processes differentially across spatial scales. Disturbance would reinforce functional divergence at the small scale (neighbourhood), would not affect functional dispersion at the intermediate scale (patch) and would reinforce functional convergence at the large scale (site). We also evaluated functional and species richness of native and exotic plants to infer underlying processes. Native and exotic species richness were expected to increase and decrease with disturbance, respectively, at the neighbourhood scale, and to show similar associations with disturbance at the patch (concave) and site (negative) scales.
In an arid shrubland, we estimated species richness and functional dispersion and richness within 1 m2 quadrats (neighbourhood) nested within 100 m2 plots (patch) along a small-scale natural disturbance gradient caused by an endemic fossorial rodent. Data for the site scale (2500 m2 plots) were taken from a previous study. We also tested the conceptual model through a quantitative literature review and a meta-analysis.
As spatial scale increased, disturbance sequentially promoted functional divergence, random trait dispersion and functional convergence. Functional richness was unaffected by disturbance across spatial scales. Disturbance favoured natives over exotics at the neighbourhood scale, while both decreased under high disturbance at the patch and site scales.
The results supported the hypothesis that disturbance reinforces assembly processes differentially across scales and hampers plant invasion. The quantitative literature review and the meta-analysis supported most of the model predictions.
INTRODUCTION
Disturbance events, such as landslides, clearcutting, digging and grazing (see Table 1), may create opportunities for plant species colonization by removing plant biomass in a community (Sousa, 1984; Huston, 1994; Shea et al., 2004). Thus, disturbance can affect assembly processes and thereby play a significant role in the structure of plant communities (Grime, 1973,1977; Connell, 1978; Huston, 1979, 1994; Root-Bernstein and Ebensperger, 2013). The spatial scale also influences community assembly processes (Weiher and Keddy, 1995). While a number of studies have assessed the effects of spatial scale and disturbance on assembly processes separately, relatively few studies have considered these factors jointly (Ding et al., 2012; de Bello et al., 2013; Laliberté et al., 2013; Biswas et al., 2016). There is not only a paucity of empirical evidence but also a lack of predictive models concerning the interplay between spatial scale and disturbance as they affect the structure and assembly of plant communities.
Summary of studies addressing the effects of disturbance on functional dispersion metrics across spatial scales
| Ecosystem type | Disturbance type | Functional metric | Increased spatial scale | Effect of disturbance scale (ha) | Reference | ||
|---|---|---|---|---|---|---|---|
| Small/fine | Intermediate | Large | |||||
| Arid shrubland | Rodent burrowing | FDisSES | ↓ | ↑ (10–4) | ↕ (0.01) | ↓ (0.25) | Current study |
| Grasslands | Developing habitat (e.g. road verges and old fields) | MPDSES | ↓ | ↕ | – | ↓ | Saar et al. (2017) |
| Managed livestock grazing | MPDSES | ↓ | ↑ (4 × 10⁻⁴) | – | ↕ (1 – 340) | ||
| Riparian plant communities | Clearcutting | FDivS | ↓ | ↑ (10–4) | – | ↑ (0.04) | Biswas et al. (2016) |
| FRicS | ↓ | ↑ | – | ↑ | |||
| FEveS | ↓ | ↑ | – | ↓ | |||
| Wildfire | FDivS | ↓ | ↑ | – | ↑ | ||
| FRicS | ↓ | ↑ | – | ↑ | |||
| FEveS | ↓ | ↓ | – | ↓ | |||
| Semi-arid grassland | Sheep grazing | FRicSES | ↓ | – | – | ↓ (0.04) | Laliberté et al. (2013) |
| FDisSES | – | ↓ (10–4) | – | – | |||
| Semi-deciduous forest | Logging and fire | Rao | – | ↕ (0.5) | – | ↑ (10) | Réjou-Méchain et al. (2014) |
| Semi-natural coastal grasslands | Land-use change | FDiv | ↑ | ↓ (2.5 × 10⁻³) | – | ↓ | Lewis et al. (2014) ‡ |
| FRic | ↓ | ↑ | – | ↓ | |||
| Sub-alpine meadow | Landslides | Filling proportion | ↓ | ↑ (2.5 × 10⁻⁵) | ↑ (1.6 × 10⁻³) | – | Smith et al. (2013) † |
| Range | ↓ | ↓ | ↓ | – | |||
| Sub-tropical floodplain lakes | Flooding –Ivinhema sub-basin | MPD | ↕ | ↕ | – | ↕ | Dunck et al. (2016)* |
| Flooding –Paraná sub-basin | MPD | ↕ | ↑ | – | ↕ | ||
| Temperate grasslands | Livestock grazing | Mantel correlations | ↓ | ↑ (10–6) | ↓ (2.5 × 10⁻⁵) | ↓ (0.02 – 11.63) | de Bello et al. (2013) |
| Therophytic Mediterranean island | Goat grazing | FDivSES | – | ↑ | ↑ | – | Karadimou et al. (2015) † |
| FEveSES | – | ↑ | ↑ | – | |||
| FRicSES | – | ↓ | ↓ | – | |||
| Tropical forest | Clearcutting | PwSES | ↓ | – | – | ↓ (0.04) | Yang et al. (2014) |
| Tropical montane rain forests | Logging on adult trees | FDisSES response traits | ↕ | ↑ | ↓ | ↕ | Ding et al. (2012) |
| FDisSES effect traits | ↓ | ↕ | ↓ | ↓ | |||
| Logging on saplings | FDisSES response traits | ↓ | ↕ (0.01) | ↓ (0.04) | ↓ (0.25) | ||
| FDisSES effect traits | ↓ | ↕ | ↓ | ↓ | |||
| Logging on treelets | FDisSES response traits | ↓ | ↓ | ↓ | ↓ | ||
| FDisSES effect traits | ↓ | ↓ | ↓ | ↓ | |||
| Shifting cultivation on adult trees | FDisSES response traits | ↑ | ↑ | ↑ | ↑ | ||
| FDisSES effect traits | ↓ | ↑ | ↑ | ↕ | |||
| Shifting cultivation on saplings | FDisSES response traits | ↓ | ↑ | ↕ | ↕ | ||
| FDisSES effect traits | ↓ | ↑ | ↓ | ↓ | |||
| Shifting cultivation on treelets | FDisSES response traits | ↓ | ↑ | ↕ | ↕ | ||
| FDisSES effect traits | ↕ | ↓ | ↕ | ↓ | |||
| Tropical montane rain forest | Logging | FDisSES | ↓ | ↑ (0.01) | ↕ (0.04) | ↑ (0.25) | Ding et al. (2019) |
| FRicSES | ↓ | ↑ | ↑ | ↑ | |||
| Woody Mediterranean island | Goat grazing | FDiv | ↑ | ↑ (10–4) | ↑ (6.4 × 10⁻³) | – | Karadimou et al. (2015) † |
| FEve | ↑ | ↕ | ↕ | – | |||
| FRic | ↕ | ↑ | ↑ | – | |||
| Percentage of cases supporting the model | 74.3 % | 60.5 % | 25 % | 51.6 % | |||
(↓) increased trait convergence, (↕) no difference among treatments, (↑) increased trait divergence and (–) pattern not tested. Expected patterns according to the conceptual model: (↓) as spatial scale increases, (↑) following disturbance at small/fine scale scales, (↕) following disturbance at intermediate scales and (↓) following disturbance at large scales. Definition and meaning of the different functional metrics are provided in Supplementary data Table S3
*Single lakes and river floodplain were defined as the small and large scales, respectively.
†The authors acknowledge that the scale used might not be sufficient to detect habitat filtering.
‡Whole study area (‘National’) was defined as the large scale.
A trait-based approach accounting for spatial scale across an environmental gradient may be useful to gain insights into the major community assembly processes (Chase, 2014; Biswas et al., 2016; Perronne et al., 2017). It has been shown that, as spatial scale increases (increase in grain size), abiotic processes over-ride the influence of biotic processes (Weiher and Keddy, 1995; Weiher et al., 2011; Garnier et al., 2016). Thus, there is a shift from trait divergence (species less similar to each other than expected by chance) to trait convergence (species more similar than expected by chance) (Weiher and Keddy, 1995; Laliberté et al., 2013; Biswas et al., 2016; Chalmandrier et al., 2017; Saar et al., 2017). This shift implies random patterns of trait dispersion when spatial scales are neither too small nor too large (‘intermediate’ spatial scales hereafter, for simplicity and operational issues) (Weiher et al., 2011; Garnier et al., 2016). At small scales, trait divergence is more likely to be found, and this is associated with a limiting similarity process, where trait differences between competing species allow their coexistence (Weiher and Keddy, 1995; de Bello et al., 2013; Laliberté et al., 2013; Chalmandrier et al., 2017; Perronne et al., 2017; Saar et al., 2017). Nevertheless, trait divergence could also result from filtering due to microscale environmental heterogeneity processes (Perronne et al., 2017) or competitive exclusion that eliminates similar species (and consequently decreases species richness) (Mayfield and Levine, 2010). If microscale heterogeneity is a determinant factor, then trait divergence may result from the accumulation of several trait convergence patterns at the microsite scale (Kraft and Ackerly 2014). Conversely, trait convergence is less likely to be found at small scales, and it would be related to exclusion of weaker competitors, where species with traits associated with low competitive ability are outcompeted (Chesson, 2000; Grime, 2006; Mayfield and Levine, 2010). At large scales, trait convergence is usually found, and this is associated with a habitat filtering process, where only species with similar trait values are able to occur within a given environment (Weiher and Keddy, 1995; Adler et al., 2013; de Bello et al., 2013; Kraft et al., 2015; Chalmandrier et al., 2017). Contrariwise, trait divergence is rarely found, and – if found – it would result from the occurrence of environmental heterogeneity within the community (de Bello et al., 2013), where different species are favoured in different microsites (Mayfield and Levine, 2010; Adler et al., 2013). Finally, random patterns often found at intermediate scales probably occur when the factors causing the aforementioned assembly processes cancel each other out (Weiher and Keddy, 1995; Weiher et al., 2011; Garnier et al., 2016).
Disturbance effects on plant diversity vary with the spatial scale (Chaneton and Facelli, 1991; Olff and Ritchie, 1998; Dorrough et al., 2007; Zhang et al., 2013). At small scales, an increase in intensity or frequency of disturbance can prevent exclusion of weaker competitors by removing plant biomass, hence reducing resource uptake and ultimately promoting trait divergence and increasing species richness (Huston, 1979, 1994; Chaneton and Facelli, 1991; Olff and Ritchie, 1998; Davis et al., 2000; Grime, 2006). Trait divergence could also result from facilitation under harsh conditions caused by disturbance (Bertness and Callaway, 1994; Perronne et al., 2017). If facilitation prevails over limiting similarity, then the volume of functional space occupied by the species present in a community (functional richness; Cornwell et al., 2006; Villéger et al., 2008) should increase with harsh conditions caused by disturbance (Schöb et al., 2012; Perronne et al., 2017). At large scales, strong selection for disturbance-tolerant plant species within the species pool may promote trait convergence and decrease species richness (Huston, 1979, 1994; Chaneton and Facelli, 1991; Weiher and Keddy, 1995; Olff and Ritchie, 1998). At intermediate scales, the outcome would be patterns of trait dispersion not distinguishable from random, as well as highest species richness at intermediate disturbance levels (Grime, 1973; Connell, 1978; Huston, 1979, 1994).
Community ecology studies on the effects of disturbance and spatial scale that consider species origin (native vs. exotic) may shed light on the processes associated with such effects (Fridley et al., 2007; Simberloff et al., 2012). Escobedo et al. (2017) showed how different responses to disturbance in terms of species richness in native and exotic species led to a null response of total species richness along a disturbance gradient. It is often assumed that natural disturbance should favour native species over exotic species, because natives are expected to be more adapted to historical disturbance regimes (Alpert et al., 2000; Daehler, 2003; Huston, 2004; Catford et al., 2012; Escobedo et al., 2017). In contrast, exotic plant species are expected to be more adapted to anthropogenic disturbance (Kowarik, 2008; Catford et al., 2012). However, the occurrence of differential responses to disturbance in native and exotic species may depend on the spatial scale of the study. Thus, species richness of native and exotic species shows a negative relationship at small scales, while at large scales the relationship is positive, thus verifying ‘the invasion paradox’ (Elton, 1958; Shea and Chesson, 2002; Davies et al., 2007; Fridley et al., 2007).
Here, we integrated earlier predictions of natural disturbance effects in communities regulated by abiotic conditions or competitive interactions (Huston, 1979, 1994; Weiher and Keddy, 1995; Grime, 2006) into a conceptual model, addressing the differential effect of disturbance on assembly processes and species richness patterns of native and exotic species depending on spatial scale. This model allows the interpretation of assembly and plant invasion processes when the abiotic/competitive control changes with spatial scale (Fig. 1). We hypothesized that disturbance would (1) reinforce limiting similarity or facilitation (trait divergence) rather than exclusion of weaker competitors (trait convergence) at small spatial scales (neighbourhood); (2) reinforce habitat filtering (trait convergence) rather than environmental heterogeneity (trait divergence) at large spatial scales (site); and (3) lead to random patterns of functional dispersion at intermediate spatial scales (patch), this because the opposing assembly processes, exacerbated by disturbance, should cancel each other out (Fig. 1B). We also predicted that disturbance should (4) favour native species over exotic species at the neighbourhood scale; (5) show a unimodal relationship with both native and exotic species at the patch scale; and (6) show a negative relationship with both groups at the site scale (Fig. 1C). We tested the model predictions in an arid shrubland with data collected at three spatial scales and considering a small-scale natural disturbance gradient caused by the burrowing activity of an endemic fossorial rodent, which generally removes dominant native grasses and herbs (Escobedo et al., 2017). Burrowing rodents create different habitats across spatial scales with their mounds, individual colonies and colony complexes, which may modify the processes shaping community structure (Reichman and Seabloom, 2002; Davidson et al., 2012).
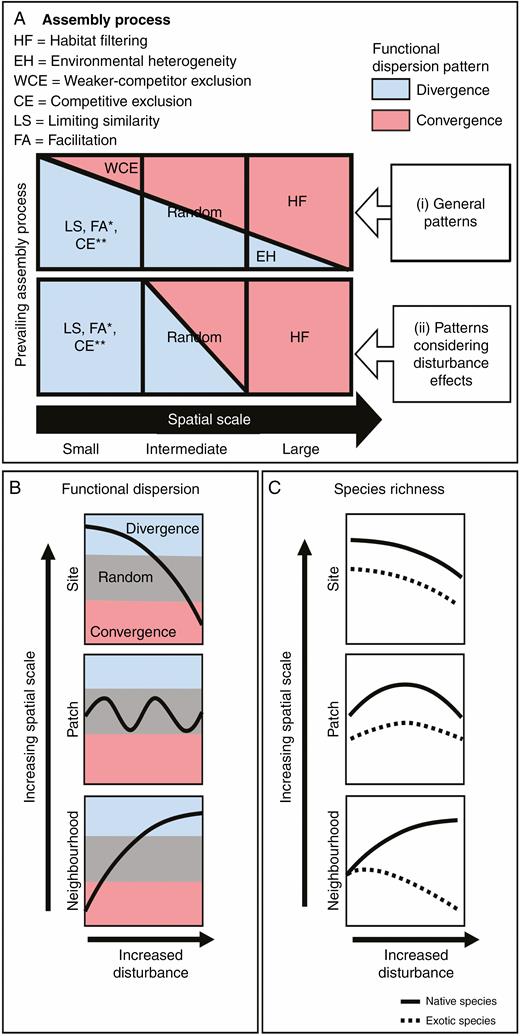
Conceptual model for predicting community assembly processes across different spatial scales considering disturbance effects. Trait assembly patterns (functional dispersion): trait divergence (blue) and trait convergence (red). (A) (i) General trait assembly patterns (based on de Bello et al., 2013), where habitat filtering (red area) prevails over environmental heterogeneity (blue area) at large spatial scales, whereas limiting similarity (or facilitation* or competitive exclusion**) (blue area) prevails over weaker-competitor exclusion (red area) at small spatial scales; a random pattern is expected at intermediate scales (equal red and blue areas). (ii) Trait assembly patterns considering disturbance effects, where the prevalence of habitat filtering over environmental heterogeneity increases at large scales (reinforced habitat filtering), whereas the prevalence of limiting similarity (or facilitation) over weaker-competitor exclusion increases at small scales (reinforced limiting similarity); the random pattern is maintained at intermediate scales. *If facilitation is the prevailing assembly process then the volume of functional space occupied by the species present in a community should also increase (see main text). **If competitive exclusion is the prevailing assembly process promoting divergence then species richness should also decrease (see main text). (B) Expected relationships between disturbance and functional dispersion across scales (neighbourhood, patch and site). The grey strip corresponds to values of functional dispersion not different from a null model (random); values above the grey strip indicate functional divergence and values below the grey strip indicate functional convergence. Disturbance increases trait divergence at the neighbourhood scale, produces mainly random patterns at the patch scale and increases trait convergence at the site scale. (C) Expected relationships between disturbance and relative species richness of native (solid lines) and exotic (dotted lines) species across spatial scales: At the neighbourhood scale, limiting similarity prevails; hence, disturbance that suppresses competitive dominance would increase native species richness, which may prevent further establishment of exotic species (Byun et al., 2018; but see Hess et al., 2019). At the patch scale, assembly processes cancel each other out, and native and exotic species richness would increase at moderate levels of mortality caused by disturbance. Native species, however, may increase slightly more than exotics due to adaptations to historic agents of disturbance; the opposite may be expected due to anthropogenic disturbance (Catford et al., 2012). At the site scale, native and exotic richness would decrease due to the prevalence of habitat filtering over environmental heterogeneity (see main text).
In addition, we estimated functional differentiation between native and exotic species to better understand variation in species richness along the disturbance gradient across spatial scales (Thuiller et al., 2010). A negative relationship between native and exotic richness may result from an increase in functional differentiation, while a lack of such differentiation may explain parallel species richness responses in native and exotic species. Finally, to assess the generalizability of our conceptual model and further test its predictions, we conducted a systematic survey of the literature from several study systems and implemented a meta-analysis. We reviewed the effects of disturbance (natural or anthropogenic) on trait assembly patterns across different spatial scales, evaluating quantitatively whether disturbance differentially reinforces the prevailing assembly process at each spatial scale.
MATERIALS AND METHODS
Study area
Research was carried out at Las Cardas Experimental Station (5436 ha; Universidad de Chile), located in the coastal desert of North-Central Chile (30°15'S,71°17'W). Las Cardas Experimental Station has an 18 ha fenced area from which both grazing by livestock and anthropogenic activities have been excluded since 1972. Las Cardas is a hyperarid, winter rainfall ecosystem (De Martonne, 1926; Díaz et al., 2016), with a mean annual temperature of 14.9 °C and a mean annual precipitation of 90.2 mm (www.ceazamet.cl). It is an open shrubland with a winter-active herbaceous stratum dominated by native species. Despite unnoticeable human impact within the fenced area, several exotic species thrive there: 15 exotics out of 66 species sampled in the study site. These exotic species are – overall – closely related to the native flora (Escobedo et al., 2017).
Disturbance gradient
Within the 18 ha enclosure, disturbance is generated by the burrowing activity of the endemic fossorial rodent Spalacopus cyanus (Octodontidae). This rodent produces conspicuous above-ground oval-shaped bare-soil mounds (0.04–0.25 m2 area, 10–20 cm height) mainly during winter and spring (July–November) when rains soften the soil and the plant growing season starts (Begall and Gallardo, 2000). Spalacopus cyanus is a social rodent and occurs in large colonies (6–26 animals; Begall and Gallardo, 2000), forming clusters of mounds (patches) encompassing areas of about 100 m2, with up to 98 mounds per patch. These patches are randomly distributed within the exclusion at a density of approx. 7 colonies ha–1 (Escobedo et al., 2017). Colonies of S. cyanus can move up to 50 m during winter and springtime, leaving several patches with abandoned mounds across the landscape (Contreras et al., 1993). Plant colonization of mounds commonly begins during the winter following the creation of mounds, i.e. it occurs on abandoned mounds. The ecological effects of disturbance by S. cyanus are likely to be mediated by physical phenomena (removal/burial of dominant plants) rather than by increased soil nutrient availability or plant consumption (Contreras et al., 1993; Escobedo et al., 2017). Mound density (Sousa, 1984, i.e. disturbance intensity sensuShea et al., 2004), is inversely associated with the abundance of dominant species, such as the grass Bromus berteroanus and the succulent annual Cistanthe longiscapa (see Supplementary data Table S1). Thus, S. cyanus modifies the habitat at different spatial scales with its mounds, individual colonies and colony complexes (Contreras et al., 1993; Begall and Gallardo, 2000), all of which may modify the processes shaping community structure across spatial scales (Reichman and Seabloom, 2002; Davidson et al., 2012). Together with the abiotic filter (aridity), increased disturbance intensity by S. cyanus (estimated as mound density) is a major factor shaping the plant community in this hyperarid environment (Scherson et al., 2017; Escobedo et al., 2017).
Sampling
We established ten 100 m2 plots (patch scale) along a S. cyanus disturbance gradient: from 0 to 98 mounds per patch (see above); plots were on average 100 m apart (see Supplementary data Fig. S1). Within each patch, 25 sub-plots of 1 m2 (neighbourhood scale; n = 250) were randomly established along five transects (five sub-plots per transect; see Supplementary data Fig S1b). We worked with the whole plant community, including native and exotic species. Thus, within each sub-plot sampled, every individual plant was recorded and identified to species or genus level using a 0.2 × 0.2 m grid (Supplementary data Fig. S1b). Species abundance at the patch scale was estimated as the cumulative sum of species occurrences in the 25 sub-plots (frequency), while at the neighbourhood scale it was calculated as the average frequency measured across sub-plots per plot. For the site scale, we used data previously obtained in the study area by our group (Escobedo et al., 2017); this sampling included sixteen 2500 m2 large plots randomly established within the enclosure (Supplementary data Fig. S1a). In that sampling, the community composition of herbaceous species and the intensity of disturbance by S. cyanus were estimated by surveying the presence or absence of species and mounds within 25 0.09 m2 quadrats placed along five parallel 25 m transects within each large plot (Supplementary data Fig. S1c), respectively. Details on plant species abundance at the site scale are available in Escobedo et al. (2017). In sum, we captured the scale-dependent signatures of community processes caused by mounds, individual colonies and colony complexes of S. cyanus at neighbourhood (1 m2), patch (100 m2) and site scales (2500 m2), respectively. We focused on neighbourhoods nested within patches and at the site scale within the enclosure to avoid habitat differences that may be confounded with the disturbance gradient and/or biotic factors.
Functional traits
We measured seven functional traits from five individuals of each of those species that together accounted for at least 90 % of total plant abundance in each patch: height (m), leaf area (mm2), basal diameter (mm), specific leaf area (SLA: the ratio of leaf area to dry weight; mm2 mg–1), leaf dry matter content (LDMC: the ratio of leaf dry mass to water-saturated leaf fresh mass; mg g–1) and – for herbaceous species only – plant biomass (mg) and root:shoot ratio (R/S: the ratio of below-ground to above-ground biomass; mg mg–1). We also categorized species in terms of three life history functional traits based on literature records (Marticorena et al., 2001; Zuloaga et al., 2008) and following Pérez-Harguindeguy et al. (2013): growth form (rosette plant, elongated, extensive-stemmed herb, tussock, shrub, tree or herbaceous vine), plant life span (annual, biennial or perennial) and life form (therophyte, hemicryptophyte, chamaephyte, geophyte or phanerophyte). For the site scale, only categorical functional traits were recorded (Escobedo et al., 2017). Finally, for each species, we recorded its origin as ‘native’ or ‘exotic’ (following Fuentes et al., 2013).
Community assembly
We used the functional dispersion (FDis) and functional richness (FRic) indices (Laliberté and Legendre, 2010) to infer assembly processes along the natural disturbance gradient. FDis and FRic were estimated using the function ‘dbFD’ in R (R Core Team, 2018) library ‘FD’(Laliberté and Legendre, 2010; Laliberté et al., 2014). FDis is a measure of functional community divergence, which is obtained from a principal co-ordinate analysis (PCoA) based on a Gower trait dissimilarity matrix with a subsequent Cailliez correction (Laliberté and Legendre, 2010). FDis measures the mean distance of each species to the centroid of all species in the community, weighted by its abundance. A decrease in FDis indicates that community composition has shifted towards species that are more similar to each other. Conversely, an increase in FDis means that community composition has shifted towards species that are less similar to each other. As spatial scale has two components, (1) grain (the area of individual plots sampled in the community) and (2) extent (the area that contains all the study plots), some assembly processes may only become apparent once the potential species pools are taken into account (de Bello et al., 2012; Chalmandrier et al., 2017). For the patch scale, to evaluate whether observed functional dispersion in each plot (i.e. grain) was lower or higher than expected from a null model, we estimated the standardized effect size (SES) of FDis (FDisSES) using 9999 randomly generated null communities (where abundance values are shuffled within each species across all sampled plots, i.e. extent; ‘Frequency’ randomization) (suggested by Götzenberger et al., 2016). We then calculated the difference between the observed FDis and null FDis divided by the s.d. of the null data, [FDisSES = (FDisobserved – FDisnull)/s.d. FDisnull], where positive and negative values indicate higher (‘divergence’) and lower (‘convergence’) functional dispersion than the null expectation, respectively. Ten FDisSES values were thus obtained, i.e. one per patch of the disturbance gradient. For the neighbourhood scale, we generated null assemblages applying a within-plot (i.e. extent) restricted randomization among 1 m2 sub-plots (i.e. grain), which kept sample species richness matrices for each sub-plot (i.e. 25 sub-plots as rows) constant but randomized abundance within samples across all species (‘Richness’ randomization) (suggested by Götzenberger et al., 2016). We pooled all the 250 FDisSES values obtained for sub-plots within each plot (n = 10 plots × 25 sub-plots) and used two-tailed t-tests to determine the occurrence of divergence (FDisSES > 0) or convergence (FDisSES < 0) for each disturbed patch at the neighbourhood scale. FDisSES values were averaged over the 25 sub-plots per plot, i.e. one per patch of the disturbance gradient. For the site scale, we used FDisSES values reported for the same study area in Escobedo et al. (2017). As a measure of functional richness, we estimated FRicSES at the neighbourhood and patch scales. FricSES, by calculating the minimal convex hull that includes all species, describes the volume of functional space occupied by a community (Cornwell et al., 2006; Villéger et al., 2008). Thus, a decrease in FRicSES indicates habitat filtering and/or exclusion of weaker competitors at large and small scales, respectively; an increase in FRicSES may be interpreted as evidence of facilitation at small scales (Perronne et al., 2017). This measure was not available for the site scale (Escobedo et al., 2017).
We performed two-tailed t-tests again to determine the occurrence of divergence or convergence for each spatial scale (patch and neighbourhood scales; ten values per spatial scale). Subsequently, to elucidate the shape of the relationships between disturbance and assembly processes at the patch and neighbourhood scales, we used generalized linear models (GLMs) including linear (Yi = β0 + β1Xi + εi) and quadratic (Yi = β0 + β1Xi + β2Xi2 + εi) estimates. We fitted models using a Gaussian family as the error term and an ‘identity’ link. The number of mounds within each plot was the predictor variable, whereas FDisSES and FRicSES were the response variables. The best-fitted model for each spatial scale was selected using the corrected Akaike information criterion (AIC). Likelihood ratio tests (LRTs) were used to determine parameter significance in the models.
Given that commonly used null models can only identify a single main process, it has been suggested that a family of null models should be used to disentangle intertwined assembly processes acting across spatial scales (Chalmandrier et al., 2013; Götzenberger et al., 2016). Thus, a single null model cannot be used for all research questions (i.e. testing for habitat filtering, limiting similarity, competitive exclusion, environmental heterogeneity or combinations thereof). Moreover, Götzenberger et al. (2016) reported that the ‘Frequency’ and ‘Richness’ null models are suitable for detecting habitat filtering processes at intermediate (or large) scales and biotic processes at small scales, respectively. To verify this point, we ran null models for each scale inversely (i.e. ‘Frequency’ and ‘Richness’ null models for the neighborhood and patch scales, respectively), and we did not detect any significant relationship (Supplementary data Fig. S2).
Diversity response
We calculated the extrapolated species richness for total, native and exotic species using the abundance-based coverage estimator (ACE) implemented in the function ‘estimateR’ in R library ‘vegan’ (Oksanen et al., 2018). Extrapolated species richness (hereafter, species richness) corrects for the number of undetected species from sample plots by way of abundance-based estimates, using counts of species (numbers of individuals). For the neighbourhood scale, species richness values were averaged across all 25 quadrats per plot. For the patch scale, species richness values were estimated per plot. The species richness values for the site scale were taken from Escobedo et al. (2017) (per 2500 m2 plot). To test for significant effects of species origin (fixed factor: native vs. exotic species) and disturbance level (covariate), we used GLMs. To determine the relationship between species richness and disturbance for both native and exotic species, we performed regression analyses based on GLMs following the same procedure used for community assembly. Additionally, to elucidate how the different filters (biotic and/or abiotic) act on specific traits, thereby influencing community assembly, we estimated the community-weighted mean (CWM; Garnier et al., 2004) for each trait along the disturbance gradient, at the neighbourhood and patch scales (we followed the same procedure used for FDis and FRic). As CWM represents the dominant trait value of plants in a given community, it could help to improve our understanding of community assembly processes. CWM values were calculated as , where pik is the relative abundance of species i at site k, and xik is the trait value of species i at site k. Then, we performed regression analyses using the same procedure as described for FDis and FRic (see above).
Functional differentiation between native and exotic species
To study coexistence patterns between native and exotic species along the natural disturbance gradient at the neighbourhood and patch scales, we used the weighted mean functional distance to the native community (Thuiller et al., 2010); hereafter, ‘functional distance’. This measure was not available for the site scale (Escobedo et al., 2017). The estimation of the functional distance between exotic species and their native neighbours is useful to understand niche differences between them (Thuiller et al., 2010), representing a link between functional variation and coexistence mechanisms. We performed regression analyses using the same procedure as described for community assembly processes and diversity response (see above).
Quantitative review and meta-analysis
To survey the literature on the effect of disturbance on trait assembly processes across different spatial scales, we conducted a search in the Web of Science with no restriction on publication years, using the search term combinations ‘disturbance’ AND ‘trait’ AND ‘assembly’ AND ‘scale’ AND ‘plant’. We further screened the reference list of the selected papers to identify other relevant publications. A total of 82 articles were reviewed in-depth to assess their suitability. To be included in the analysis, studies had to consist of a quantitative comparison (observational or experimental) of functional diversity metrics on both disturbed and undisturbed conditions (or along successional or disturbance gradients) across at least two spatial scales. If more than two levels of disturbance were reported, we used data from the two most extreme disturbance levels. To make studies comparable, we defined qualitative ranges for the different scales after the terminology used in each study (e.g. ‘smaller’, ‘fine’ or ‘neighbourhood scales’ were defined as the small scale, whereas ‘larger’, ‘broad’ or ‘regional scales’ were defined as the large scale). When studies reported results for more than two spatial scales (e.g. 1, 10 and 100 m2) without using any specific terminology for the middle scale (10 m2), we operationally defined it as the intermediate scale. Finally, 13 articles met these criteria (including the present study), and we calculated the percentage of studies verifying the model predictions at each scale (vote-counting procedure; Table 1).
Subsequently, starting with those 13 published studies, we aimed at performing a meta-analysis on the outcomes of evaluations of the effect of disturbance on trait assembly across spatial scales. To be included, studies had to meet the following criteria: (1) report measures of functional divergence in both disturbed and undisturbed conditions (or along successional or disturbance gradients); (2) those measurements had to be taken across at least two spatial scales; and (3) means, standard deviations and sample sizes for the different conditions needed to be available in tables or figures. We included a study that used functional richness as variable to identify assembly processes at the large scale (Laliberté et al., 2013). When the information was given only in figures, data were extracted using the software ImageJ. Studies that reported more than one disturbance or ecosystem type were considered separate case studies (Koricheva et al., 2013). Finally, the meta-analysis included ten articles and 23 study cases (Table 1).
To examine the mean effects of disturbance on functional divergence, we calculated Hedge’s effect size g (Hedges, 1981; Borenstein et al., 2009) as:
, where is the mean value of functional divergence for the undisturbed site and the value for the disturbed site; s.d.pooled is the within-groups standard deviation, pooled across groups; and J is a correction for small sample bias (Hedges, 1981). Negative values of g indicate that functional divergence increased following disturbance, while positive values indicate that functional divergence decreased following disturbance. Zero values of g indicate that there were no differences in the measured response between disturbed and undisturbed plots.
To test whether disturbance changes functional divergence, we conducted a random effects meta-analysis, which allows for the variation between study effects, using the function ‘rma.mv’ in R library ‘metafor’ (Viechtbauer, 2010). We used case study as random factor to account for the non-independence of different types of disturbance (see Table 1) within case studies. We also assessed the heterogeneity of effect sizes using the Q statistic. Significant heterogeneity indicates that variance in effect sizes is greater than expected by sampling error, thus suggesting that other sources of variation may be implicated. To evaluate the effect of spatial scale on the change in functional dispersion with disturbance, we used random effects meta-analyses using the ‘rma.mv’ function, with case study as a random factor and spatial scale as a moderator. We also tested the effect of each spatial scale (small, intermediate and large) separately. Heterogeneity tests (Q) were also performed.
RESULTS
Community assembly
As predicted by the model (Fig. 1), the trait dispersion parameter FDisSES showed a divergence pattern at the neighbourhood scale [x– = 0.366; t(9) = –2.992, P = 0.015] and a random pattern at the patch scale [x– = –0.039; t(9) = –0.085, P = 0.933] (Fig. 2A, B); it was earlier found that FDisSES showed a convergence pattern, i.e. habitat filtering, at the site scale (Escobedo et al., 2017) (Fig. 3). FDisSES and disturbance were positively associated at the neighbourhood scale (χ 2 = 3.48, P = 0.03) (Supplementary data Table S1; Fig. 2A) and unrelated at the patch scale (Supplementary data Table S1; Fig. 2B). At the site scale, FDisSES showed a negative relationship with disturbance (Escobedo et al., 2017). In addition, while the functional volume parameter FRicSES was lower than the null expectations at the neighbourhood scale [x– = –0.389; t(9) = –3.397, P = 0.008], it was not different from the null expectation at the patch scale [x– = –0.174; t(9) = –0.545, P = 0.599] (Fig. 2C, D). Moreover, FRicSES was not related to disturbance at any spatial scale (Supplementary data Table S1). At the neighbourhood scale, where biotic processes are expected to be more influential, increased disturbance resulted in a change from functional convergence to functional divergence, but the community functional space remained the same (Fig. 2A, C). In addition, we performed similar analyses on the 250 unpooled (FDis and FRic) SES values for the neighbourhood scale, and we did not detect any difference from pooled SES values (Supplementary data Fig. S3). Thus, disturbance promoted a limiting similarity process, resulting in the coexistence of functionally dissimilar species. Conversely, at the patch scale, neither FDisSES nor FRicSES changed with disturbance (Fig. 2B, D); thus, random processes prevail, and coexistence through functional differences is unlikely. Moreover, we found similar relationships between disturbance and CWMs at the neighbourhood and patch scales. At both scales, CWMs of basal diameter and LDMC increased with increasing disturbance; likewise, the relative abundance of shrubs, herbaceous vines, chamaephytes and phanerophytes increased with increasing disturbance (Fig. 4). Conversely, increased disturbance was associated with a decrease of SLA CWM and of the relative abundance of therophytes at both scales (Fig. 4).

Relationship between disturbance (number of mounds) and the standardized effect sizes of functional dispersion (FDisSES) (A and B) and functional richness (FRicSES) (C and D) at the neighbourhood and patch scales. The solid curve represents a statistically significant relationship (see Supplementary data Table S1 for associated GLMs). Shaded areas around regression lines represent 95 % confidence intervals. Dashed lines separate negative from positive SES values. Boxplots for FDisSES and FRicSES are also shown. Red circles (boxes) indicate lower functional dispersion = convergence (or lower volume = contraction) than the null expectation, grey circles (boxes) indicate random pattern and blue circles (boxes) indicate higher functional dispersion = divergence (or higher volume = expansion) than the null expectation.
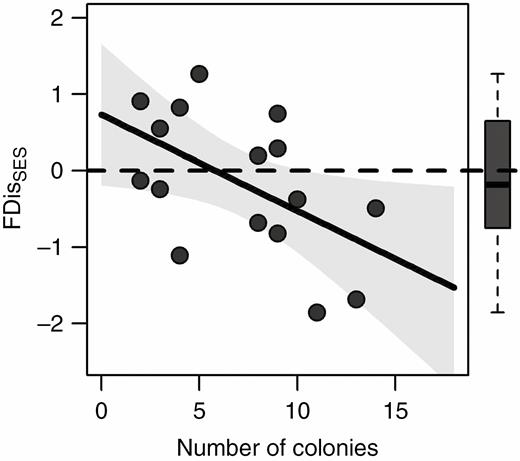
Relationship between disturbance (number of colonies) and the standardized effect size of functional dispersion (FDisSES) at the site scale. The solid curve represents a statistically significant relationship. Shaded areas around regression lines represent 95 % confidence intervals. Dashed lines separate negative from positive SES values. Boxplots for FDisSES are also shown. Redrawn and modified from data in Escobedo et al. (2017).
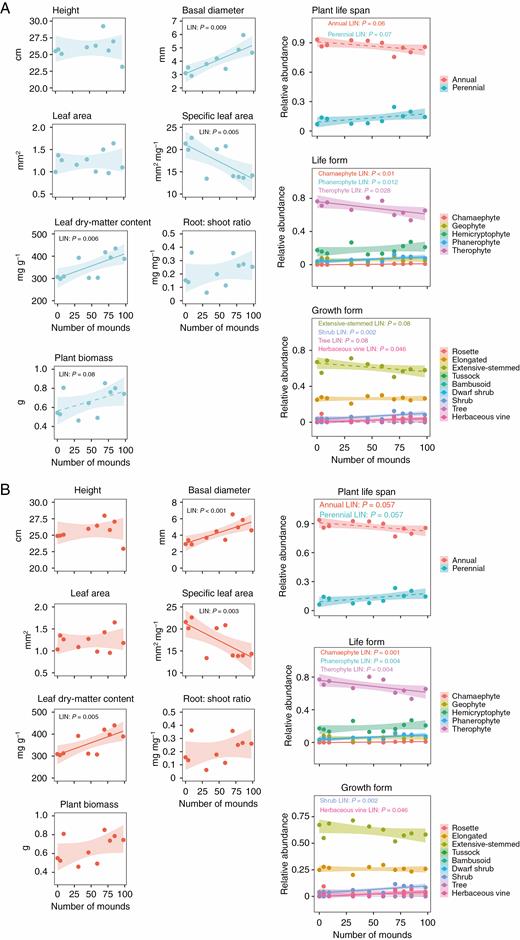
Relationships between disturbance (number of mounds) and community-weighted mean (CWM) for each trait at the (A) neighbourhood and (B) patch scales. CWMs of plant life span, life form and growth form correspond to the sum of the abundances of all classes per trait. Solid curves denote statistically significant relationships (P < 0.05), dashed curves denote marginally non-significant relationships (P < 0.08) and shaded areas around regression lines represent 95 % confidence intervals.
Diversity response
We found that the relationship between species richness and disturbance is contingent on species origin at the neighbourhood [species origin × linear component of disturbance; χ 2(1,16) = 12.09, P < 0.01] (Fig. 5A) and site scales [χ 2(1,28) = 59.59, P < 0.01; Escobedo et al., 2017], whereas at the patch scale both native and exotic species showed similar responses to disturbance [linear + quadratic components of disturbance: χ 2(1,13) = 5.69, P < 0.05; and species origin: χ 2(1,18) = 26.20, P < 0.01]. At the neighbourhood scale, native species richness increased linearly with increased disturbance (χ 2 = 4.20, P = 0.04), whereas richness of exotics decreased linearly with increased disturbance (χ 2 = 12.41, P < 0.01) (Supplementary data Table S1; Fig. 5A). At the patch scale, both native and exotic species richness showed a concave curve along the disturbance gradient, with significant (positive) linear (native, χ 2 = 6.23, P < 0.05; exotic, χ 2 = 3.99, P < 0.05) and (negative) quadratic (native, χ 2 = 6.21, P < 0.05; exotic, χ 2 = 5.58, P < 0.05) components in the model (Supplementary data Table S1; Fig. 5B). At the site scale, native species richness decreased linearly with increased disturbance, whereas exotic species richness showed a concave curve along the disturbance gradient (averaged parameters of linear and quadratic models) (Escobedo et al., 2017). Native species richness was greater than exotic species richness both at the neighbourhood scale [11.43 ± 1.18 vs. 3.69 ± 0.78 (mean ± s.e.); χ 2(1,18) = 38.54, P < 0.01] and at the patch scale [29.40 ± 4.69 vs. 9.31 ± 3.47; χ 2(1,18) = 26.20, P < 0.01] (Fig. 5A, B). The same pattern of higher native species richness was previously recorded at the site scale (Escobedo et al., 2017). Total species richness showed a concave relationship with disturbance (significant quadratic parameter and linear components in the model; see Supplementary Table S1) at the patch scale, whereas at the neighbourhood (Supplementary Table S1) and site scales (Escobedo et al., 2017) total species richness was not associated with disturbance.
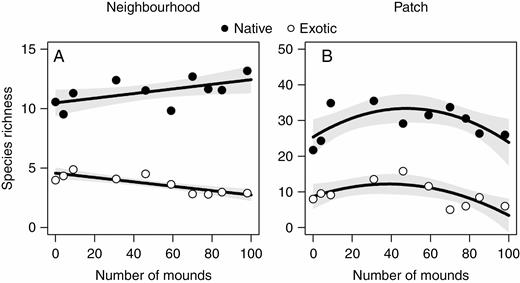
Relationships between disturbance (number of mounds) and native and exotic species at the neighbourhood (A) and patch (B) scales. All relationships were statistically significant (see Supplementary data Table S1). Shaded areas around regression lines represent 95 % confidence intervals.
Functional differentiation between native and exotic species
At the neighbourhood scale, the functional distance between native and exotic assemblages increased with disturbance (χ 2 = 3.90, P = 0.04), while it was not related to disturbance at the patch scale (Supplementary data Table S1; Fig. 6A, B). These patterns suggest that, along the disturbance gradient, coexistence between native and exotic species is sustained by functional trait differentiation at the neighbourhood scale (Fig. 6A).
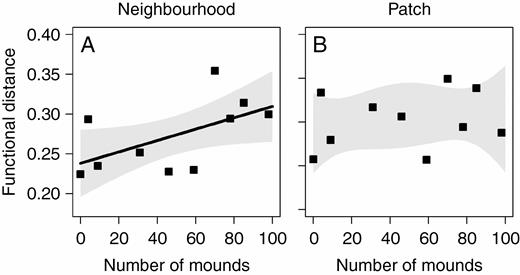
Relationship between disturbance (number of mounds) and functional distance of exotic species to the native community at the neighbourhood (A) and patch (B) scales. The solid line represents a statistically significant relationship (see Supplementary data Table S1). Shaded areas around regression lines represent 95 % confidence intervals.
Quantitative review and meta-analysis
Concerning the model predictions, the literature survey found that disturbance promoted divergence (increased trait dispersion) at small scales (60.5 % of cases) and convergence (decreased trait dispersion) at large spatial scales (51.6 % of cases). However, at the intermediate scale, where disturbance would promote random patterns (or not affect trait dispersion), we only found 25 % of support for our predictions.
The meta-analyses showed that, overall, functional dispersion did not differ between undisturbed and disturbed conditions (g = –0.32, P = 0.55). However, spatial scale explained a significant proportion of variation in effect sizes (the between-group heterogeneity was significant; QB = 8.94, d.f. = 2, P = 0.011; Supplementary data Table S2). As predicted, while disturbance increased functional divergence at small scales (g = –1.72, P = 0.045), it decreased functional divergence at large scales (g = 1.47, P = 0.049) (Fig. 7). At intermediate scales, disturbance increased functional divergence but not significantly (g = –0.75, P = 0.145) (Fig. 7). We also found significant heterogeneity among studies in almost all the analyses (Supplementary data Table S2).
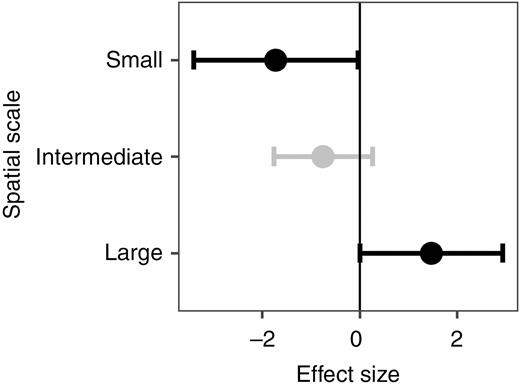
Mean effect sizes (Hedges’ g) of differences in functional dispersion between undisturbed and disturbed plant communities for small, intermediate and large spatial scales. Error bars depict 95 % confidence intervals (CIs). A mean effect size is significantly different from zero when CIs do not overlap zero. Significant results are shown in black. Negative (or positive) effect sizes indicate that disturbed sites have on average greater (or lesser) functional divergence than disturbed sites.
DISCUSSION
We found support for our conceptual model (Fig. 1), which hypothesizes that disturbance reinforces assembly processes differentially across spatial scales, with predictable consequences on patterns of native and exotic species richness. Thus, in this arid shrubland, disturbance by a fossorial rodent had opposite effects on functional dispersion at small and large spatial scales. Such patterns of functional dispersion may provide insights into the major assembly processes taking place in the community. In addition, the species richness response of natives to disturbance by S. cyanus supported our predictions: native species sequentially showed positive, unimodal and negative relationships with disturbance as spatial scale increased. As expected, exotic species richness decreased with disturbance at the neighbourhood scale and showed a concave relationship with disturbance at the patch scale. However, instead of showing the monotonic decrease with increased disturbance that we expected, exotic species richness showed a concave relationship with disturbance at the site scale (Escobedo et al., 2017). In other words, the predicted decrease in exotic species richness was only verified at high levels of disturbance. Finally, we detected that, at the neighbourhood scale, coexistence between (closely related) native and exotic species along the disturbance gradient occurs through functional differentiation.
The quantitative review across different ecosystems (Table 1) supported most of the predictions of the model. Thus, disturbance promoted divergence in >60 % of cases at small scales and promoted convergence in nearly 52 % of cases at large spatial scales. However, at the intermediate scale, where disturbance would promote random patterns, we found only 25 % support. The latter could be due to two reasons: (1) different criteria to define what is an intermediate spatial scale (an intermediate spatial scale in one study could represent a small or large scale in another study); or (2) a publication bias due to the under-reporting of non-significant results (Koricheva, 2003; Nakagawa, 2004) (in this case, disturbance did not affect trait dispersion or promoted a random pattern). Furthermore, despite the small sample size, the meta-analysis also supported the model predictions: disturbance increased, did not change and decreased functional dispersion at small, large and intermediate scales, respectively (Fig. 7). The results suggest that the aforementioned conceptual framework is of general application, as its predictions were verified across several ecosystems (Table 1). Nevertheless, we found significant heterogeneity of effect sizes in almost all analyses. This calls for the inclusion of other factors or sources of variation likely to be involved in the scale- and disturbance-dependent assembly processes.
Disturbance by S. cyanus differentially reinforced assembly processes across spatial scales. At the neighbourhood scale, increasing disturbance was associated with an increase in functionabvl divergence and a linear decrease in abundance of dominant species (e.g. the succulent annual Cistanthe longiscapa and the annual grass Bromus berteroanus; Supplementary data Table S1). We also found that the dominance of therophytes decreased with disturbance, whereas it promoted previously subordinate species (shrubs and herbaceous vines) with a more robust structure (high basal diameter CWM) and tough leaves (high LDMC CWM and low SLA CWM) (Cornelissen et al., 2003; Pérez-Harguindeguy et al., 2013) (Fig. 4). These patterns support predictions that high disturbance could promote functional divergence by suppressing competitive dominance (Grime, 2006). Small spatial scales are better suited to detect the signature of biotic processes such as limiting similarity, exclusion of weaker competitors or facilitation (Weiher and Keddy, 1995; Spasojevic and Suding, 2012; Laliberté et al., 2013; Chalmandrier et al., 2017; Perronne et al., 2017; Saar et al., 2017). Here we could rule out the role of microscale heterogeneity because burrowing disturbance showed minimal effects on assembly patterns at the microsite scale (V. M. Escobedo et al., unpubl data). Our results of trait divergence support previous findings suggesting that limiting similarity or facilitation prevail over exclusion of weaker competitors (trait convergence) at small scales (Götzenberger et al., 2012; de Bello et al., 2013). Furthermore, the lack of a relationship between functional richness (volume of community functional space) and disturbance (Fig. 2C) suggests that limiting similarity prevailed over facilitation, because the latter should have increased functional richness (Schöb et al., 2012; Perronne et al., 2017). At the patch scale, we found random patterns of assembly across the disturbance gradient, suggesting that the assembly processes prevailing at smaller and larger scales cancelled out at this intermediate scale. The observed patterns of random functional dispersion in disturbed communities at the patch scale (100 m2) are consistent with an earlier study in grazed alpine grasslands, where functional diversity in 100 m2 plots was, overall, not different from random expectations (Chalmandrier et al., 2017). Our finding that, at the site scale, the prevalence of habitat filtering is reinforced by S. cyanus disturbance (Escobedo et al., 2017) is in line with earlier studies at large scales reporting that the influence of habitat filtering on functional dispersion becomes more important than environmental heterogeneity with increasing disturbance (de Bello et al., 2013; Laliberté et al., 2013). Likewise, Huston (1994) specifically proposed that high levels of disturbance should decrease environmental heterogeneity in communities driven by abiotic conditions (those in low-productivity environments or extended over large spatial scales). Burrowing activity of S. cyanus may reinforce habitat filtering at large scales by preventing populations from recovering after biomass removal (Huston, 1979, 1994), which selects for plant species with a ruderal, opportunistic strategy (Grime, 1977; Contreras and Gutiérrez, 1991; Torres-Díaz et al., 2012; Escobedo et al., 2017). In sum, at the neighbourhood scale, communities assemble by way of species dissimilarity in ecological strategies, which allows them the use of different niche spaces caused by the disturbance agent (Chesson, 2000; de Bello et al., 2013). Conversely, at the site scale, communities tend to assemble contingent on whether species are similar in terms of traits suitable for survival in particular disturbance environments (de Bello et al., 2013; Laliberté et al., 2013; Saar et al., 2017).
Native and exotic species showed different responses to disturbance. On one hand, natural disturbance by fossorial rodents may favour the establishment of natives over exotics (Wesche et al., 2007; El-Bana, 2009) because native species tend to be better adapted to natural or historical disturbance regimes (Alpert et al., 2000; Daehler, 2003; Huston, 2004). In fact, such natural/historical disturbance regimes have been advocated as tools for exotic species management in low-productivity habitats (Alpert et al., 2000; Huston, 2004). We found at the neighbourhood scale that native species richness increased with disturbance, while exotic species richness decreased with disturbance (Fig. 5A). We also found that disturbance by S. cyanus increased functional distance between native and exotic species (Fig. 6A). The results revealed contrasting functional responses of native and exotic species to disturbance, even between these closely related assemblages (Escobedo et al., 2017; no phylogenetic signal for origin: native vs. exotic). This pattern supports the proposed negative relationship between native and exotic species richness at small scales (Elton, 1958; Shea and Chesson, 2002; Fridley et al., 2007). Disturbance by S. cyanus favoured native plants that have historically coped with (and presumably adapted to) this ecological factor, compared with recently arrived exotic species (Fuentes et al., 2013), thus being able to maintain population densities sufficient to prevent invasion at fine scales (Davies et al., 2007; Byun et al., 2018). On the other hand, it seems that high disturbance is detrimental to both native and exotic species at the patch (Fig. 5B) and site (Escobedo et al., 2017) scales. Specifically, both native and exotic species richness decreased at the most disturbed end of the gradient. This agrees with theoretical models (Grime, 1973; Connell, 1978; Huston, 1979, 1994, 2004) and the evidence of parallel responses in species richness of native and exotic species at large scales (Elton, 1958; Shea and Chesson, 2002; Stohlgren et al., 2003; Fridley et al., 2007; Davies et al., 2007). It might be suggested that suppressed competitive dominance, driven by local disturbance, tends to fade away at large spatial scales, where species sorting occurs because of moderate to high levels of disturbance. At the patch scale, patterns of species richness (Fig. 5B) and functional distance (Fig. 6B) of native and exotic species along the disturbance gradient agree with coexistence schemes proposed by Huston (1994, 2004), which assume that functional differences between natives and exotics may be ignored. Specifically, moderate levels of disturbance by S. cyanus could increase environmental heterogeneity, thus allowing random coexistence of several species in different microsites, including natives and exotics. Native and exotic species richness may thus be expected to respond to disturbance in a similar way at the patch scale, because life history strategies of native and exotic species are often constrained by similar trade-offs (van Kleunen et al., 2010; Leishman et al., 2010; Palacio-López and Gianoli, 2011). In other words, patches that are good for native species generally also turn out to be suitable for exotic species (Stohlgren et al., 2003; Huston, 2004).
Conclusions
The effects of spatial scale and disturbance on community assembly processes and plant invasion have seldom been considered jointly. To our knowledge, this study is the first integrative functional approach in this regard, including specific predictions at different scales and concerning native and exotic species. We found empirical support for our conceptual model, which proposes that disturbance reinforces assembly processes differentially across spatial scales. In addition, we illustrated how variation in native and exotic species richness across a disturbance gradient depends on spatial scale. At the neighbourhood scale, increased disturbance promotes functional trait divergence by suppressing competitive dominance. At the patch scale, disturbance leads to random patterns of functional dispersion. At the site scale, disturbance drives a habitat filtering process resulting in the coexistence of functionally similar species.
We refined our model to include the interplay of spatial scale and disturbance in shaping patterns of native and exotic species richness, finding support for most of the predictions. At the neighbourhood scale, inverse patterns of species richness variation were consistent with their contrasting functional responses to disturbance. Likewise, at the patch scale, the parallel responses of natives and exotics to disturbance may be accounted for by the lack of functional differentiation between these assemblages. Finally, at the site scale, native and exotic species richness decreased at the most disturbed end of the gradient, where native and exotic assemblages show, overall, functional convergence. Our conceptual model can be of general application since the quantitative review and the meta-analysis across different ecosystems supported most of its predictions. We stress that the use of several functional approaches, together with considering native and exotic species richness patterns, provides a better understanding of community assembly processes and how they are shaped by disturbance across different spatial scales. We advocate the use of this conceptual model as a standard yet flexible starting point for understanding scale- and disturbance-dependent assembly processes underlying plant invasions in different ecosystems.
SUPPLEMENTARY DATA
Supplementary data are available online at https://dbpia.nl.go.kr/aob and consist of the following. Table S1: relationships between disturbance and community assembly processes, plant invasion process and functional differentiation. Table S2: total heterogeneity and between-group heterogeneity of effect sizes. Table S3: overview of the functional metrics in the review. Figure S1: overview of the study area and schemes of sampling design. Figure S2: relationship between disturbance and the standardized effect size of functional dispersion. Figure S3: relationship between disturbance and unpooled standardized effect size values.
FUNDING
This work was funded by a FONDECYT grant (1180334) awarded to E.G.
ACKNOWLEDGEMENTS
We thank Universidad de Chile for granting permits to work at Las Cardas Experimental Station. V.M.E., R.S.R. and E.G. conceived the ideas and designed methodology; V.M.E. and Y.A.O. collected the data; V.M.E. and Y.A.O. analysed the data; V.M.E., R.S.R. and E.G. wrote the manuscript.
LITERATURE CITED
