


Abstract
Plant elemental composition is of fundamental importance for plant growth and metabolic functions. However, knowledge of how multi-elemental stoichiometry responds to varying nitrogen (N) and phosphorus (P) availabilities remains limited.
We conducted experimental manipulations with nine repeat experiments to investigate the effects of N and P supply on the concentrations and variability of six elements, carbon (C), N, P, potassium (K), calcium (Ca) and magnesium (Mg), in leaves of Arabidopsis thaliana.
N supply increased the concentrations of N, K and Mg, decreased the concentration of P, but exerted little influence on the concentrations of C and Ca in green leaves. P supply increased the concentrations of P and Ca, decreased the concentration of C, initially increased and then decreased the concentration of K, but showed little influence on the concentrations of N and Mg in green leaves. Multivariate patterns among the concentrations of these six elements in green leaves was influenced by the type of nutrient supply (i.e. N or P). Elemental variability decreased with increasing elemental concentrations in green leaves at the intraspecific level, supporting the Stability of Limiting Elements Hypothesis that was originally proposed from a meta-analysis of pooled data across species or communities. Compared with green leaves, the senesced leaves showed greater variability in C, N, P, K and Mg concentrations but lower variability in Ca concentration.
N and P supplies exerted differential influences on the concentrations of C, N, P, K, Ca and Mg in green leaves. The specific C content should be considered when assessing C cycling under global nutrient changes. Stage-dependent patterns of leaf stoichiometric homeostasis differed among elements with various chemical characteristics. These findings can help to improve our understanding of plant eco-physiological responses and acclimation under global nutrient changes from the stoichiometric perspective of multiple elements.
INTRODUCTION
Plant metabolism and physiological functions rely on approx. 30 elements, including both macronutrients and micronutrients (Marschner and Marschner, 2012). Given the interdependent assimilation and utilization of multiple indispensable elements, it is imperative to maintain sufficient nutrient concentrations and stoichiometric balance in plant tissues for healthy growth without inducing nutrient deficiency and toxicity (Sterner and Elser, 2002; Ågren, 2008). However, nutrient availability in the environment frequently does not parallel the plant’s physiological requirements, resulting in ubiquitous nutrient limitation in terrestrial ecosystems (Aerts and Chapin, 2000; Elser et al., 2007). Therefore, comprehensive knowledge of the variability of multiple elements and the associated drivers is pivotal for a holistic understanding of plant nutrition status and biogeochemical cycling.
Carbon (C) forms the structural basis and substrate for metabolism in plants, and constitutes roughly half of a plant’s dry mass (Thomas and Martin, 2012; Ma et al., 2017). Nitrogen (N) is an important component of chlorophyll and the Rubisco protein that are directly involved in photosynthesis (Lambers et al., 2008). Phosphorus (P) is present in nucleic acids that drives the production of proteins, and is crucial to energy transfer as a constituent of adenosine phosphates (Lambers et al., 2008). Potassium (K) plays fundamental roles in enzyme activation, plant osmoregulation, stomatal conductance and phloem transport (Sardans and Peñuelas, 2015). Calcium (Ca) mediates a myriad of physiological processes, such as cell-wall rigidity, plasma membrane stabilization and osmoregulation, and acts as a second messenger when encountering environmental stimuli (White and Broadley, 2003). Magnesium (Mg) occupies a central position in chlorophyll and regulates photosynthetic processes and enzyme activation (Marschner and Marschner, 2012). These six elements are functionally coupled in biological systems (Garten, 1978; Wright et al., 2005; Ågren and Weih, 2012).
N and P availabilities on land have been drastically enhanced under human intervention through various processes, such as addition of N/P fertilizers and N/P deposition (Galloway et al., 2008; Peñuelas et al., 2013). Broadly, N inputs increase plant N concentration and the probability of P limitation, whereas P inputs increase plant P concentration and the probability of N limitation (Yuan and Chen, 2015; Ostertag and DiManno, 2016; Deng et al., 2017; Yan et al., 2017). Atmospheric N deposition can decrease plant K, Ca and Mg concentrations across several terrestrial ecosystems, mainly attributed to soil acidification and subsequent leaching-induced depletion of base cations (Bowman et al., 2008; Lucas et al., 2011; Sardans and Peñuelas, 2015; Mao et al., 2018). Experimental manipulations have shown that N supply can decrease K concentration in maize (Riedell, 2010), whereas other fertilization experiments showed that N supply increased the concentrations of K, Ca and Mg in vegetative tissues of winter wheat (Hamnér et al., 2017) and in ginkgo seedlings (Son, 2002). Collectively, how the other essential elements (e.g. K, Ca and Mg) in plants respond to increasing N availability in ambient environments remains of debate. In contrast, the effects of increasing P availability in ambient environments on the multi-elemental stoichiometry in plants have not been well studied (but see Reinbott and Blevins, 1994; Li et al., 2010). Few studies have concentrated on the effects of nutrient changes on plant C concentration, which is often considered an important and constant parameter in assessing the C cycle (Thomas and Martin, 2012; Ma et al., 2017).
Plants have the regulation capacity to maintain relatively constant elemental compositions under varying environments, i.e. stoichiometric homeostasis (Sterner and Elser, 2002). Recently, two views regarding controls on the capacity of stoichiometric homeostasis have been proposed. First, Han et al. (2011) proposed that elements with high internal concentrations and most often limiting in ecosystems were less variable and less sensitive to environmental variations (i.e. the Stability of Limiting Elements Hypothesis), which was widely reported in various studies (e.g. Zhang et al., 2012; Hao et al., 2014; Zhao et al., 2016). Nonetheless, this hypothesis has mainly been studied through analysis of pooled data across species or communities, with little knowledge at the intraspecific level. A test of the hypothesis at the intraspecific level can provide more details on the intrinsically stoichiometric composition and on nutrient coupling by eliminating the confounding effects of interspecific variation (Alonso and Herrera, 2001; De Frenne et al., 2013). Secondly, Schreeg et al. (2014) and Yan et al. (2016) suggested that green leaves showed more constrained N and P stoichiometry under changing nutrient environments relative to senesced leaves because of the important physiological functions and nutrient requirements in green leaves. That is, N and P stoichiometry in senesced leaves could be stronger indicators of soil N and P availability than that in younger leaves. However, whether the stage-dependent pattern in leaf N/P stoichiometric homeostasis could be extrapolated to other elements (e.g. C, K, Ca and Mg) requires further research.
In this study, through experimental manipulations with five levels of N and P supplies and nine repeat experiments, we investigated the effects of N and P supply on the stoichiometry of six elements (i.e. C, N, P, K, Ca, Mg) in Arabidopsis thaliana leaves. We conducted the experiments using A. thaliana, mainly because it has a short life span and can be planted over several repeated experiments in a short period. We aim to explore the following specific hypotheses:
(1) N and P supplies can exert differential influences on the concentrations of these six elements (i.e. C, N, P, K, Ca, Mg) in green leaves, because these six elements have idiosyncratic roles in plant physiological processes, and show different magnitudes and directions of change with plant growth (Lambers et al., 2008; Marschner and Marschner, 2012).
(2) Multivariate patterns among the concentrations of these six elements in green leaves could be influenced by the type of nutrient supply, as nutrient supply can occasionally override intrinsically physiological requirements and biochemical associations between elements (Güsewell, 2004; Ågren, 2008).
(3) The Stability of Limiting Elements Hypothesis could be applicable at the intraspecific level, given the ubiquitous and common requirements of stoichiometric balance in plants across different species (Sterner and Elser, 2002; Ågren, 2008).
(4) The stage-dependent pattern of leaf stoichiometric homeostasis differs among the six elements due to various chemical characteristics and phloem mobility (Marschner and Marschner, 2012; Vergutz et al., 2012).
MATERIAL AND METHODS
Plant materials and experimental design
Arabidopsis thaliana ecotype ‘Columbia’, a model plant for molecular biological studies (Meinke et al., 1998), was used to conduct the experimental manipulations with five levels of N and P supply. We repeated nine such experiments. Seeds originated from one common Columbia founder, and were grown in different nutrient treatments. All experiments were carried out under the same conditions and manipulated with analogous experimental processes. The experimental set-up was provided by a phytotron with long days (16-h light/8-h dark photoperiod) at approx. 20 °C and 60–70 % relative humidity (Yan et al., 2015, 2016). Before sowing, we used 70 % (v/v) ethanol/0.5 % (v/v) Tween 20 to surface-sterilize the seeds and then stratified them in a 0.1 % (w/v) agar dish at 4°C in the dark for 4 d. We then sowed these seeds in 27 pots (3 replicates × 9 treatments), each having 24 small divisions to raise 24 plants. Sterilized vermiculite with medium particle size was used to fill these pots, which were immersed in nutrient solutions containing various N and P concentrations. We randomly rearranged these pots every 2 d to minimize micro-environmental effects.
We designed nine nutrient treatments, including five levels of N supply (1, 2, 4, 8 and 12 mmol N L−1, added as NH4NO3; indicated as N1, N2, N3, N4 and N5) at the optimal level of P supply (0.25 mmol P L−1; indicated as P3) and five levels of P supply (0.0625, 0.125, 0.25, 0.5 and 1.0 mmol P L−1, added as KH2PO4 and NaH2PO4; indicated as P1, P2, P3, P4 and P5) at the optimal level of N supply (4 mmol N L−1; indicated as N3). N supplies share the same treatment of N3P3 with P supplies. According to previous trials, the optimal levels of nutrient addition were determined as the level at which plant growth at the harvest stage first reached maximum. These treatments had the same concentrations of all other macro- and micro-elements besides N and P in the nutrient solutions (i.e. each nutrient solution equally contained, per litre, 2 mm CaCl2, 0.75 mm K2SO4, 0.65 mm MgSO4, 0.1 mm Fe-EDTA, 0.01 mm H3BO3, 1 μm MnSO4, 1 μm ZnSO4, 0.1 μm CuSO4 and 0.035 μm Na2MoO4). pH in the nutrient solutions was adjusted to 5.8. The chemistry and concentrations of these nutrient solutions were ascertained according to Hoagland’s formula (Hoagland and Arnon, 1950) and our preliminary experiments (Yan et al., 2015).
Sampling and measurement
Leaves at two developmental stages were sampled. Firstly, we harvested all green leaves at 2 weeks after initiation of stem bolting with the four largest rosette leaves fully expanded (Weaver et al., 1998). Secondly, we sampled senesced leaves when the four largest rosette leaves appeared yellow or shrivelled. Given the differences in growth rates among different treatments, leaf samples were harvested at the respective date based on the developmental stage of each individual plant. We selected five or six plants with similar growth performance per pot, and then pooled their leaves together as one replicate.
Subsequently, green-leaf and senesced-leaf samples were oven-dried at 65 °C to constant weight, and then ground using a mortar and pestle before we determined elemental (i.e. C, N, P, K, Ca and Mg) concentrations. Leaf C and N concentrations were measured using the Dumas combustion method with an elemental analyser (Elementar vario EL III, Elementar, Hanau, Germany; Jones, 2001). Leaf P, K, Ca and Mg concentrations were determined by using inductively coupled plasma optical emission spectroscopy (Thermo 6300; Thermo Scientific, West Palm Beach, FL, USA) after HNO3–HF–HClO4 digestion (Jones, 2001).
Data analysis
The effects of N and P supplies on the concentrations of these six elements in green leaves were delineated using one-way analysis of variance (ANOVA) and the least significant difference post-hoc test. Pearson correlation analyses were used to examine correlations among these six elements. Principal component analyses (PCAs) were conducted to examine whether covariation of the concentrations of these six elements in green leaves could be discriminated between N and P supplies. We performed the PCAs using pooled data of the five levels of N (or P) supply. To test the Stability of Limiting Elements Hypothesis, the coefficient of variation (CV) of each element was calculated as an indicator of the variance in elemental concentrations, with higher CV values indicating greater variability. Linear regression was then conducted to assess the relationship between mean leaf elemental concentration and its CV value.
Furthermore, to explore the stage-dependent pattern of leaf stoichiometric homeostasis, we performed reduced major axis (RMA) regression to determine the scaling relationship of elemental concentrations between green and senesced leaves (Warton et al., 2006). RMA analyses were expressed by log10y = α*(log10x)+β, where x and y denote elemental concentrations in green and senesced leaves, and α and β are the scaling exponent and normalization constant of the regression line, respectively. The relationship between y and x is considered isometric when the 95 % confidence interval (CI) of α contains 1, whereas a 95 % CI of α above (or below) 1 suggests that y increases faster (or slower) than linearly with x. All statistical analyses were carried out using pooled data from the nine repeated experiments in R 2.15.2 (R Development Core Team, 2012).
RESULTS
Effects of N and P supply on elemental concentrations in green leaves
N and P supplies exhibited differential influences on the concentrations of the six elements studied (Figs 1 and 2). With increasing N supply, the concentrations of N, K and Mg initially increased sharply and then levelled off at higher supply; the concentration of P showed a rapid decrease at lower supply levels and then levelled off; and the concentrations of C and Ca presented nearly invariant trends (Fig. 1). In contrast, with increasing P supply, P and Ca concentrations showed a steep increase at lower supply levels and then a more gradual increase before reaching a plateau; K exhibited a shift from a sharp increase to a steep decline; C showed a sharp decrease at lower supply levels and then a more gradual decrease before reaching a plateau; and N and Mg showed nearly invariant trends (Fig. 2).
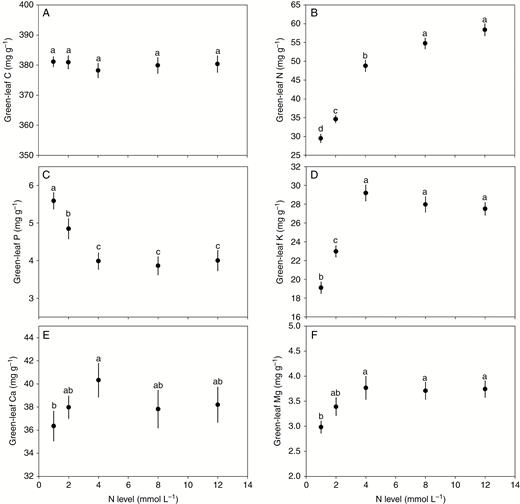
Effect of N supply on the concentrations of C, N, P, K, Ca and Mg in green leaves. Points and error bars denote the means and standard errors of elemental concentrations, respectively. Different letters above the error bars indicate a significant difference (P<0.05) among the five levels of N supply based on one-way analysis of variance (ANOVA) and the least significant difference post-hoc test.
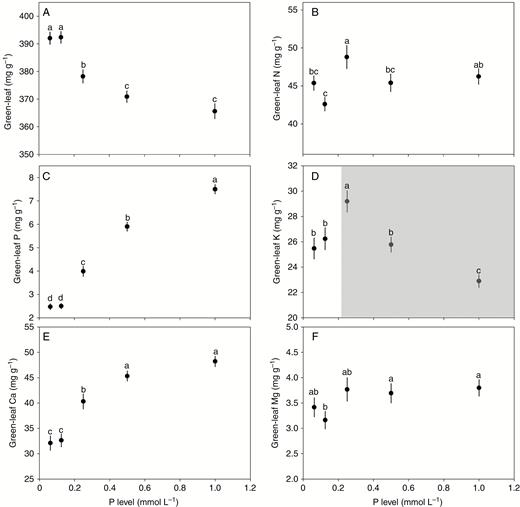
Effect of P supply on the concentrations of C, N, P, K, Ca and Mg in green leaves. Points and error bars denote the means and standard errors of elemental concentrations, respectively. Different letters above the error bars indicate a significant difference (P<0.05) among the five levels of P supply based on one-way analysis of variance (ANOVA) and the least significant difference post-hoc test. The shaded area in D highlights that leaf K concentration exhibits a shift from a sharp increase to a steep decline with increasing P level.
Covariation of elemental concentrations in green leaves
There were divergent pairwise correlations among concentrations of C, N, P, K, Ca and Mg in green leaves: C was negatively related to the other five elements, especially P and Ca; P showed a relatively larger and positive correlation with Ca; and N, K and Mg exhibited relatively larger and positive relationships between each other (Fig. 3).
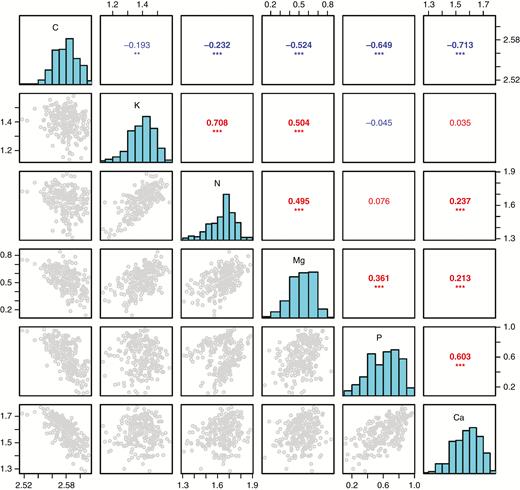
Correlation matrix of concentrations among C, N, P, K, Ca and Mg in green leaves. On the diagonal are distribution histograms of each element, the upper right gives the correlation coefficient with level of significance, and the bottom left presents the scatter diagram. Data were log10-transformed before analysis. Statistical significance is indicated by *P < 0.05, **P < 0.01, ***P < 0.001.
Multivariate patterns among the concentrations of these six elements at the intraspecific level were influenced by the type of N and P supply. Based on data from the five N supply levels pooled (i.e. N levels), PCA of the concentrations of these six elements showed that C, N, K and Mg loaded mainly on the first PCA axis, explaining 45.4 % of the total variability; C, N, P and K loaded on the second axis, explaining 24.3 % of the total variability; and P, Ca and Mg loaded on the third axis, explaining 15.6 % of the total variability (Table 1). Based on data from the five P supply levels pooled (i.e. P levels), PCA of the concentrations of these six elements showed that C, P, Ca and Mg loaded mainly on the first PCA axis, explaining 53.1 % of the total variability; K and Ca loaded on the second axis, explaining 25.9 % of the total variability; and N and Mg loaded on the third axis, explaining 8.2 % of the total variability (Table 1).
Loadings of concentrations of six elements in green leaves of Arabdopsis thaliana on the top three PCA axes
| Element | N level | P level | ||||
|---|---|---|---|---|---|---|
| PC1 | PC2 | PC3 | PC1 | PC2 | PC3 | |
| C | −0.417 | 0.413 | −0.159 | −0.498 | 0.193 | −0.366 |
| N | 0.480 | 0.413 | 0.099 | 0.382 | 0.375 | −0.736 |
| P | 0.225 | −0.579 | −0.487 | 0.468 | −0.295 | −0.127 |
| K | 0.473 | 0.416 | 0.071 | 0.182 | 0.666 | 0.086 |
| Ca | 0.326 | −0.381 | 0.656 | 0.431 | −0.408 | −0.165 |
| Mg | 0.464 | 0.068 | −0.541 | 0.410 | 0.354 | 0.522 |
| Total variation explained (%) | 45.4 | 24.3 | 15.6 | 53.1 | 25.9 | 8.2 |
The proportions of overall variation explained by each principal component are shown. N (or P) levels indicate the analysis using data from the five levels of N (or P) supply pooled. Data are log10-transformed before analysis.
Variability in the concentrations of these six elements in green leaves (as indicated by the CV) increased in the rank order C (3.8 %) < K (18.2 %) < Ca (21.5 %) < N (23.4 %) < Mg (27.0 %) < P (41.6 %) (Fig. 2B). Importantly, the CVs of these six elements were significantly negatively correlated with elemental concentrations in green leaves (r2 = 0.78, P = 0.020) (Fig. 4), supporting the Stability of Limiting Elements Hypothesis at the intraspecific level.
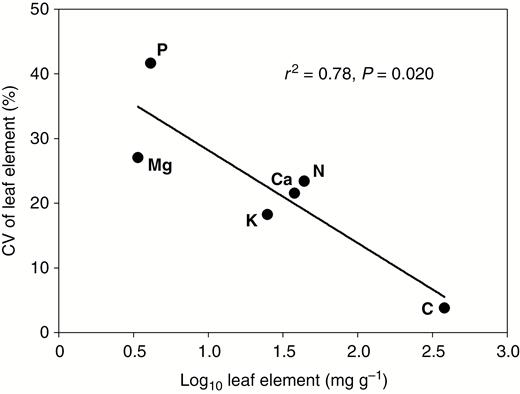
Relationships between mean elemental concentration and its coefficient of variation (CV) in green leaves. Linear regression was used to determine the fitted line.
Scaling relationships between concentrations of elements in green and senesced leaves
Elemental concentrations in green leaves were tightly associated with those in senesced leaves, and could be well characterized by the scaling relationship (Fig. 5). In the case of concentrations in senesced leaves vs. green leaves, the scaling exponents (and 95 % CIs) for C, N, P, K, Ca and Mg were 1.729 (1.484, 2.015), 1.751 (1.534, 1.998), 1.466 (1.333, 1.613), 3.049 (2.573, 3.613), 0.790 (0.702, 0.888) and 1.489 (1.281, 1.730), respectively (Fig. 5). These results suggested that, in comparison with green leaves, senesced leaves had higher variabilities in C, N, P, K and Mg concentrations but lower variability in Ca concentration in response to changing nutrient availabilities.
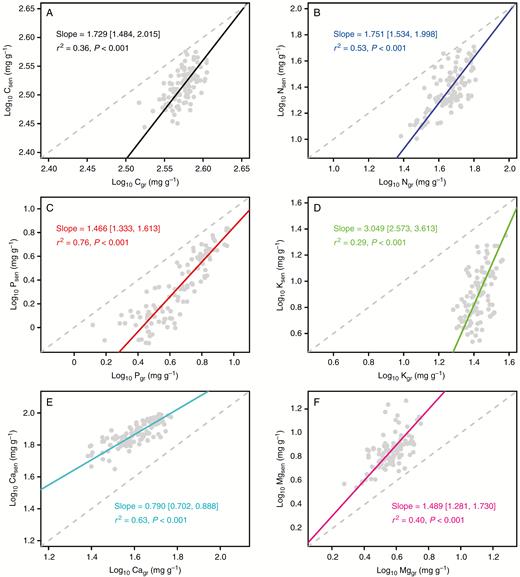
Scaling relationships between the elemental concentrations in green leaves and senesced leaves. Reduced major axis (RMA) regression was used to determine the line of significance. Numbers in square brackets are the lower and upper 95 % confident intervals of the RMA slopes. Data were log10-transformed before analysis. Nutrients in gree and senesced leaves are indicated by Nugr and Nusen (e.g. Cgr and Csen), respectively. Note with regard to sampling and analysis that senesced leaves were only sampled in four of the nine repeated experiments.
DISCUSSION
N and P supplies exerted differential influences on the concentrations of the six elements in green leaves
In the present study, N supply had different influences on the concentrations of these six elements in green leaves of A. thaliana. Generally, N supply increased the concentrations of N, K and Mg but decreased the concentration of P, possibly related to the differences between dilution and synergistic responses. A dilution response of elemental concentrations occurs when dry-weight accumulation outpaces elemental accumulation (Jarrell and Beverly, 1981; Ågren, 2008). Conversely, a synergistic response of elemental concentrations occurs when the accumulation of nutrients increases more than dry-weight accumulation, resulting in increasing nutrient concentrations (Jarrell and Beverly, 1981; Ågren, 2008). Thus, in our N fertilization experiments, synergistic responses may occur for N, K and Mg, whereas a dilution response may occur for P with relatively suboptimal availability in the nutrient solution.
Compared to N supply, P supply exerted differential effects on the leaf concentrations of these six elements. Leaf P and Ca concentrations increased significantly with increasing P supply, perhaps attributed to synergistic effects with the outpacing of P and Ca uptake as compared with dry-weight accumulation. P is the main element in nucleic acids that promotes cell division and growth rate (Sterner and Elser, 2002; Lambers et al., 2008). Ca is an indispensable component in cell division and elongation (White and Broadley, 2003; Marschner and Marschner, 2012). Increases in plant growth rate by P supply thus should increase tissue P and Ca concentrations to match physiological requirements (Reinbott and Blevins, 1994; Li et al., 2010). In contrast, P supply decreased leaf C concentration sharply, perhaps because P supply promoted carbohydrate export from leaf to other tissues via phloem short-/long-distance transport (Lambers et al., 2008) and the accumulation of mineral elements (Poorter and Bergkotte, 1992).
Interestingly, we further found that leaf K concentrations exhibited a shift from a sharp increase to a steep decline with increasing P supply. This pattern may be attributed to the different P forms among the five levels of P supply. In our experiments, KH2PO4 was used to provide the five levels of P supply. However, given the large effect of K+ on plant growth and nutrient balance, the concentration of K+ should be controlled to the same level when exploring the effects of P supply. We thus used KCl and NaH2PO4 to adjust the levels of P supply to the same level as K supply. The five levels (components) of P supply were 0.0625 mmol P L−1 (0.0625 mmol L−1 KH2PO4 + 0.1825 mmol L−1 KCl), 0.125 mmol P L−1 (0.125 mmol L−1 KH2PO4 + 0.125 mmol L−1 KCl), 0.25 mmol P L−1 (0.25 mmol L−1 KH2PO4), 0.5 mmol P L−1 (0.25 mmol L−1 KH2PO4 + 0.25 mmol L−1 NaH2PO4) and 1.0 mmol P L−1 (0.25 mmol L−1 KH2PO4 + 0.75 mmol L−1 NaH2PO4). Although the concentrations of Na+ and Cl− inevitably differed among the five P treatments, these two ions are known to have subtle effects on growth and nutrient utilization of plants in the family Brassicaceae (Marschner and Marschner, 2012). Accordingly, the increasing level of P supply from 0.0625 to 0.25 mmol P L−1 could result in an over-proportional increase in K+ uptake, thus increasing the leaf K concentration (Jarrell and Beverly, 1981). As the level of P supply continued to increase from 0.5 to 1.0 mmol P L−1, functional substitution of K by sodium (Na) occurred, which decreased the leaf K concentration (Li et al., 2010; Marschner and Marschner, 2012).
Covariation of elemental concentrations in green leaves
Pairwise elemental correlations are commonly reported in interspecific contexts, but to a very limited extent at the intraspecific level (Alonso and Herrera, 2001). Study of the correlations among different elements at the intraspecific level can provide more details of intrinsically multi-elemental links by eliminating the confounding effects of interspecific variation, and may also improve our understanding of how plants regulate their stoichiometric composition and nutrient coupling in response to environmental changes (Alonso and Herrera, 2001; De Frenne et al., 2013). Our study found divergent pairwise correlations among leaf concentrations of C, N, P, K, Ca and Mg. Leaf C concentration was found to correlate negatively with the concentrations of leaf mineral elements, which was in accordance with previous results that variations in leaf C concentration among species were largely due to the accumulation of (carbon-free) minerals (Poorter and Bergkotte, 1992). Concentrations of N, K and Mg, elements that are tightly associated with the photosynthetic apparatus (Marschner and Marschner, 2012), correlated positively with each other. Similarly, concentrations of P and Ca, which are functionally coupled in cell division and extension (Lambers et al., 2008), also correlated positively with each other.
In addition, given the tightly functional link between N and P in plants, their concentrations in leaves often show a closely stoichiometric scaling relationship across species (Niklas and Cobb, 2006; Reich et al., 2010; Tian et al., 2018). However, in the present study, we found that the scaling relationship between these two elements was not significant (P > 0.05) for the individual species. The plant N–P scaling relationship is presumably contingent on ambient N and P availabilities (Güsewell, 2004; Ågren, 2008). Excess uptake of N (or P) might occur under N (or P) addition that potentially increases the likelihood of P (or N) deficiency (Ågren, 2008; Yan et al., 2017). Plants growing under N limitation often absorb excess P for storage and vice versa (Aerts and Chapin, 2000; Güsewell, 2004). The excess uptake of nutrients could mask variability in stoichiometric characteristics of elements required solely for basic metabolic processes, and then drastically modify the leaf N–P scaling relationship (Ågren, 2008). Thus, we speculated that the non-significant scaling relationship of leaf N to P concentrations might be attributed to the influence of excessive uptake and nutrient deficiency in the fertilization experiment. Nutrient conditions could occasionally override intrinsically physiological requirements and biochemical associations between elements. In another study, we found that the scaling relationship of leaf N to P concentrations was closely regulated by the type and level of nutrient addition, and analyses of the leaf N vs. P scaling relationships using pooled data could hide much more useful information rooted in nutrient requirements and stoichiometric balance (data not shown).
Previous PCAs of leaf elemental concentrations across species divided mineral elements into three ‘sets’ with differential biochemical behaviour and chemical properties. These three different sets reflect the differential roles that these groups of elements play in leaves (Wright et al., 2005). The first axis represented variations in N, P, Cu, S and Fe, which were associated with the metabolically active ‘nucleic acid–protein set’; the second axis was mainly loaded with K, Ca, Mg, N and Mn, which were related to the ‘structural and photosynthetic set’; and the third axis was mainly loaded with K, Mg and Mn, which were closely linked to the ‘enzymatic set’ (Garten, 1978; Wright et al., 2005; Ågren and Weih, 2012; Zhang et al., 2012). In contrast, we recognized different multivariate patterns at the intraspecific level, which were influenced by the type of N and P supplies. Our PCAs showed that the first axis was mainly loaded with C, N, K and Mg based on data from N levels, but with C, P, Ca and Mg based on data from P levels; the second axis was mainly loaded with C, N, P and K based on data from N levels, but with K and Ca based on data from P levels; and the third axis was mainly loaded with P, Ca and Mg based on data from N levels, but with N and Mg based on data for P levels. These divergent patterns may be attributed to the differences in elemental interactions, physiological requirements and substrate nutrient availability. Moreover, the classifications of these six elements overlapped on the PCA axes, presumably resulting from multiple functions for some elements or the arbitrariness in forming categories when using PCA with scattered data (Ågren and Weih, 2012).
Stage-dependent pattern of leaf stoichiometric homeostasis relies on the type of elements
Given the important physiological functions and nutrient requirements in young leaves, studies have largely suggested that green leaves have a more constrained elemental composition than senescent leaves under varying nutrient environments (e.g. Han et al., 2013; Schreeg et al., 2014; Yan et al., 2016). However, this understanding has largely been limited to N and P, with little knowledge of other elements. Scaling relationships of multi-elemental concentrations between green leaves and senesced leaves indicated that senesced leaves had higher variabilities of C, N, P, K and Mg concentrations but lower variability of Ca concentration under changing nutrient availabilities (Fig. 5). This suggests that the stage-dependent pattern of leaf stoichiometric homeostasis differed among elements with different chemical characteristics.
Variation in elemental mobility might help to explain the contrasting patterns observed for different elements. Of the six elements, C, N, P, K and Mg are commonly considered as readily mobile, whereas Ca in plants is phloem-immobile with nearly no resorption during leaf senescence (Marschner and Marschner, 2012; Vergutz et al., 2012). Thus, green leaves could maintain relatively stable concentrations of C, N, P, K and Mg through nutrient regulation via senesced leaves or other tissues (Aerts and Chapin, 2000; Lambers et al., 2008), resulting in higher variability of element concentrations in senesced leaves under changing nutrient availability (Vergutz et al., 2012). Conversely, Ca in plants accumulated continuously in leaf tissue over plant ontogeny, leading to a lower and then more variable concentration in green leaves relative to senesced leaves (White and Broadley, 2003; Marschner and Marschner, 2012).
CONCLUSIONS
Our results showed that N and P supplies exerted differential influences on C, N, P, K, Ca and Mg concentrations in green leaves. These patterns may be closely related to variations in elemental interactions, physiological requirements and substrate nutrient availability (Lambers et al., 2008; Marschner and Marschner, 2012; Yan et al., 2015). We found divergent pairwise correlations among concentrations of C, N, P, K, Ca and Mg in green leaves. Multivariate patterns among the concentrations of these six elements in green leaves were influenced by the type of nutrient supply (i.e. N or P). Elemental variability decreased with increasing elemental concentration in green leaves, suggesting that the Stability of Limiting Elements Hypothesis was applicable at the intraspecific level. Compared with green leaves, senesced leaves had higher variabilities of C, N, P, K and Mg concentrations but lower variability of Ca concentration, presumably due to the variation in phloem mobility among these elements (Marschner and Marschner, 2012; Vergutz et al., 2012).
This study advances our holistic understanding of plant eco-physiological responses and acclimation under varying nutrient environments from the stoichiometric perspective of multiple elements. Plant C content is differentially influenced by N and P supplies, suggesting that specific C content should be incorporated into an assessment of C cycling under global change. Given the effects of N and P supplies, our results indicate that there is no fixed integration among the concentrations of multiple elements in plants. Moreover, our findings indicate that the chemical characteristics of various elements should be considered when selecting the most favourable plant tissue for diagnosing nutrient availability across ecosystems. Whether the patterns observed here in A. thaliana can be applied to other species requires further study.
ACKNOWLEDGEMENTS
We thank N. Y. Kim, H. Y. Guan, X. P. Li, W. J. Fang and Q. Cai for assistance in the laboratory. This study was jointly supported by China Postdoctoral Science Foundation (Project nos. 2017M620004 and 2018T110008), the National Natural Science Foundation of China (Project nos. 31621091 and 31330012) and the National Key Research and Development Program of China (2017YFC0503900).
