


Abstract
Seedling herbivory is an important selective filter in many plant communities. The removal of preferred food plants by both vertebrate and, more commonly, invertebrate herbivores can destroy entire seedling cohorts, and consequently dictate plant community assembly. Nevertheless, our understanding of how and why some seedlings are more prone to herbivore attack than their neighbours remains limited. For seedlings, where even minor tissue damage is fatal, avoiding contact with herbivores is probably advantageous and, on this basis, volatile organic compounds (VOCs) are strong candidates to fulfil a primary defensive role.
We quantified seedling selection by snails (Cornu aspersum) for 14 common, European grassland species. Seedling acceptability was subsequently compared with species-specific expression of constitutive secondary defence metabolites (CSDMs), and VOCs to determine their relative influence on seedling selection.
We found no relationship between seedling acceptability and CSDMs, but seedling selection was strongly associated with VOC profiles. Monoterpenes (specifically β-ocimene) were identified as likely attractants, while green leaf volatiles (GLVs) (3-hexen-1-ol acetate) were strongly associated with low seedling acceptability.
By elucidating a relationship between VOCs and seedling acceptability, we contradict a long-held, but poorly tested, assumption that seedling selection by herbivores in (semi-)natural plant communities centres on CSDMs. Instead, our results corroborate recent work showing how GLVs, including 3-hexen-1-ol acetate, deter crop seedling selection by molluscs. Although our failure to establish any early-ontogenetic relationship between VOCs and CSDMs also suggests that the former do not ‘advertise’ possession of the latter, we nevertheless reveal the role that VOCs play in defending seedlings against herbivory before lethal damage occurs.
INTRODUCTION
Plants synthesize and release a varied array of volatile organic compounds (VOCs) to protect themselves against abiotic stresses, to communicate the availability of floral rewards and fruits to pollinators and seed dispersers, and to defend themselves against pathogens and herbivores (Dudareva et al., 2013). Their role as herbivore feeding and oviposition cues is particularly well established (Unsicker et al., 2009; Hare, 2011), but as with most aspects of plant–herbivore interactions, the research focus has been on established plants. Despite the pivotal role seedling herbivores play in shaping the dynamics and structure of established vegetation (Barton and Hanley, 2013), remarkably few studies have set out to examine how VOCs influence seedling herbivory. This omission may in part be ascribed to the view that physiological and biochemical constraints limit the development and expression of seedling defences (Boege and Marquis, 2005). Indeed, studies on ontogenetic shifts in plant chemical defence show that, in general, seedlings are less well defended than older conspecifics (Elger et al., 2009; Barton and Hanley, 2013; Hanley et al., 2013; but see Goodger et al., 2013).
There are, nevertheless, good reasons to expect seedlings to defend themselves. Herbivores such as molluscs prefer herbaceous plants during their early ontogenetic stages (Barton and Koricheva, 2010). Moreover, unlike mature plants, seedlings often suffer immediate and total destruction following herbivore attack with limited opportunity to compensate for extreme tissue loss (Hanley et al., 1995, 2004; Barton, 2016). Like mature plants, however, there is species-specific variation in seedling selection by herbivores (see Hanley et al., 1996;,Hanley, 2004; Barlow et al., 2013), with concomitant implications for the composition of established vegetation (Barton and Hanley, 2013; Hanley and Sykes, 2014). Given the limited opportunity for the development of structural defences during early ontogeny (Hanley et al., 2007), the assumption is that seedling selection is based on variation in the expression of constitutive secondary defence metabolites (CSDMs) (Hulme, 1994; Barlow et al., 2013; Barton and Hanley, 2013). Nevertheless, we are aware of only one study that has actually tested this hypothesis; Hanley and Lamont (2001) reported a strong negative relationship between concentrations of phenolic compounds and herbivory in cotyledon-stage Proteaceae seedlings in Western Australia. However, their study focused on seedlings exposed to (unknown) herbivores in established Mediterranean-climate heathlands. In fact, seedling regeneration in this system is generally restricted to the immediate post-fire period when herbivore abundance is much reduced; this scenario is very different from temperate grasslands where invertebrate herbivores such as molluscs are numerous and particularly active when seedlings appear.
Possession of CSDMs alone may, however, be insufficient to protect a very young seedling from herbivory. If the herbivore is unaware of the defence until it actually removes tissue, significant negative repercussions for immediate seedling survival, or even subsequent longer-term growth and reproductive potential, may ensue (Hanley and Fegan, 2007; Hanley, 2012; Barton, 2013). Consequently, there seems to be a compelling reason why seedlings might advertise defensive capabilities before substantial damage occurs. Indeed, observation of snail feeding behaviour in experimental arenas suggests that some seedlings (i.e. Jacobaeae vulgaris) are avoided even before physical contact is made (Hanley, 1995). Moreover, olfactory detection of seedling VOCs by molluscs is likely given that slugs and snails exhibit strong physiological and behavioural responses to volatiles from established plants (Birkett et al., 2004; Kiss, 2017).
Empirical evidence for VOC-linked defence in seedlings is nonetheless extremely limited. Hanley et al. (2011) reported that snail (Cornu aspersum syn. Helix aspersa) olfactory preferences were strongly correlated with seedling (gustatory) acceptability, but based the former on the use of macerated seedlings whose volatile profiles are probably very different from intact or even partially damaged seedlings. A similar limitation is also true of Hanley et al.’s (2013) study of ontogenetic shifts in olfactory selection of Plantago lanceolata. In fact, the only studies on herbivore (Spodoptera frugiperda) response to seedling VOCs have been conducted on crop species (Carroll et al., 2006, 2008), and reveal little about how species-specific seedling volatile profiles affect herbivore selection. Recently, however, Shannon et al. (2016) not only reported considerable variation in VOC profiles from six different oilseed rape (OSR; Brassica napus) cultivars, but that these VOC profiles corresponded to mollusc gustatory preferences: specifically, monoterpenes acting as attractants and green leaf volatiles (GLVs) as repellents. Consequently, for this crop plant at least, there is evidence that terrestrial molluscs use volatile signals to detect and select preferred seedlings.
It remains the case, however, that the role of both VOCs and CSDMs in influencing patterns of seedling selection by herbivores is unclear for the majority of plant species. Here we examine the relative roles of VOCs and CSDMs in dictating patterns of seedling selection of 14 common grassland species by terrestrial molluscs (the snail Cornu aspersum Müller). Specifically, and based on an assumption that seedlings deter herbivores before any damage occurs, we test the following hypotheses:
seedling selection by herbivores is more closely associated with VOC profiles than CSDMs; and
if seedlings possess effective CSDM deterrents, they advertise them with distinct VOC profiles.
MATERIALS AND METHODS
Study species
Seeds of 11 dicotyledonous herb species (Achillea millefolium L., Centaurea nigra L., Cerastium fontanum Baugm., Jacobaeae vulgaris Gaertn., Leontodon hispidus L., Lotus corniculatus L., Leucanthemeum vulgare Lam., Plantago lanceolata L., Taraxacum officinale F.H. Wigg, Trifolium pratense L. and T. repens L.) and three grasses (Dactylis glomerata L., Festuca rubra L., Holcus lanatus L.) were obtained from a commercial supplier (Herbiseed Ltd, Twyford, UK). These species are common components of many European grassland ecosystems and include a relatively wide cross-section of dominant Asteraceae, Fabaceae and Poaceae species, along with representatives from two other common grassland plant families (Caryophyllaceae and Plantaginaceae). Many of these species have been included in field and laboratory feeding trials with molluscs (Hulme, 1994; Fenner et al., 1999; Hanley, 2004; Barlow et al., 2013; Hanley and Sykes, 2014), such that they offer a broad range of likely seedling acceptability. Following Hanley et al.’s (2004) definition of the term ‘seedling’, all assays were performed only on plants still dependent on their cotyledons for nutrition and use of the term hereafter is restricted to this definition.
Snail collection and culture
As the principal seedling herbivore in temperate grasslands (Hulme, 1994; Allan and Crawley, 2011), molluscs are particularly important in shaping interactions between component plant species (Barton and Hanley, 2013). In addition, not only is the feeding activity of both snails and slugs influenced (negatively) by CSDMs such as phenolics (Fritz et al., 2001), cyanogenic glycosides (Horrill and Richards, 1986) and alkaloids (Speiser et al., 1992), terrestrial molluscs also detect and respond to a range of common plant VOCs (Birkett et al., 2004; Kiss, 2017).
Three hundred snails (Cornu aspersum) were collected from sites around Plymouth, UK, and subsequently retained in large plastic containers in controlled conditions (15 ± 0.2 °C, 12-h day/night illumination) and fed on a diet of lettuce (supplemented with cuttlefish to provide calcium) for at least 1 month prior to experimental use. Consequently, all snails experienced the same environmental and dietary conditions for several weeks prior to the start of the experiment, reducing the potential for individual preference and hunger to confound seedling selection (Clark et al., 1997; Hanley et al., 2003). As a generalist herbivore, Cornu diet is highly varied, probably further reducing selective bias and making the species ideal for plant selection trials (Hanley, 1995). Individuals ranged between 20 and 30 mm in shell diameter, although individual size has little effect on patterns of seedling selection in the short-duration experiments such as those conducted here (Hanley et al., 2003).
Seedling acceptability
Seeds were set to germinate in large plastic trays (350 × 215 × 70 mm deep) filled with John Innes No. 2 potting compost and maintained in a controlled plant growth room (mean daily temperature 15.0 ± 0.2 °C; 12-h day/night). All species germinated within 3–5 d. Immediately following radicle appearance, seedlings were transferred to 50-mm-diameter plastic plant pots containing John Innes No. 2 potting compost. Two newly germinated, conspecific ‘Test’ seedlings were planted 45 mm apart and grown in controlled plant growth room conditions (mean daily temperature 15.0 ± 0.2 °C, 12-h day/night) for 7 d. At this time two newly emerged lettuce seedlings (‘Little Gem’) were planted 45 mm apart in the same pot, perpendicular to the ‘Test’ seedlings (such that all four seedlings were arranged in a square). Lettuce seedlings, cultivated simultaneously in large plastic trays containing commercial potting compost, were used to ascertain the relative acceptability of the ‘Test’ species (Fenner et al., 1999). Rapid development of lettuce seedlings compared with the test species meant that 7-d-old seedlings were at approximately the same ontogenetic stage as 14-d-old test seedlings (i.e. cotyledons with initiation of first true leaf).
When the ‘Test’ seedlings were 14 d old they were exposed to snails. Five replicate pots for each ‘Test’ species were sunk into large plastic propagator trays (350 × 215 × 70 mm deep) filled with commercial potting compost, such that the top of each pot was flush with the level of the compost. One pot was placed into the centre of each tray, with the remaining four pots located in the tray corners. This arrangement was replicated ten times for each ‘Test’ species. Three snails were then added to each tray and retained overnight (approx. 16 h) using a clear plastic propagator lid (350 × 215 × 115 mm deep). The total number of ‘Test’ species and lettuce index seedlings attacked by snails was determined for each replicate tray. These values were used to calculate an acceptability index (AI) for ‘Test’ species seedlings within individual trays, based on the formula given by Fenner et al. (1999):
Average seedling AI for each species was then calculated across all replicate trays for each species. AI ranges between 0 (highly unacceptable) and 1 (highly acceptable) where a value of 0.5 represents equal acceptability to the lettuce control. Acceptability trials were conducted between October 2014 and January 2015 such that the timing of trials for each species was interspersed at random with all other species.
Seedling constitutive second ary defence metabolites
For each species, 20 newly emerged seedlings were cultivated in each of 20 replicate 90-mm-diameter pots filled with John Innes No. 2 potting compost maintained in a controlled plant growth room (mean daily temperature 15.0 ± 0.2 °C; 12-h day/night). Fourteen-day-old seedlings were cut at ground level and immediately flash frozen in tin foil packets in liquid nitrogen, before storage at −80 °C. Samples were subsequently placed in an Edwards Modulyo freeze drier (Edwards Ltd, Burgess Hill, UK) for 48 h until dry before being transferred into airtight tubes. Seedlings from individual pots were ‘bulked up’ in order to generate sufficient sample replication (4) for subsequent CSDM analysis.
Phenolic content was determined using the Hagerman and Buttler method (see Smolders et al., 2000). Three hundred milligrams of lyophilized tissues was ground and extracted with 1 mL of 80 % methanol for 60 min. The samples were centrifuged at 800 g for 2 min and the supernatant was analysed. Five hundred microlitres of 10 mm FeCl3 solution was added to 500 µL of supernatant. The reduction of Fe III to Fe II by the phenolic compounds was measured at a wavelength of 510 nm (Shimadzu UV-1280 spectrophotometer). Tannic acid was used as a standard. Extraction of alkaloids was performed using the method described by Tikhomiroff and Jolicoeur (2002). Three hundred milligrams of lyophilized tissues was ground and extracted at room temperature in 1 mL of methanol for 60 min. The extract was centrifuged at 30 240 relative centrifugal force for 5 min at room temperature and the supernatant was filtered through a PTFE 0.45-mm filter and desalted on a Sephadex G25 column with elution medium [100 mm Hepes-KOH, pH 7.5, 2 mm dithiothreitol, 10 % (v/v) glycerol, 5 mm MgCl2] and then used to determine quantities of total alkaloids. The determination of total alkaloids used the Dragendorff’s reactive method (Pothier et al., 1983). Alkaloid concentration was assessed by the absorbance of the solution using a Shimadzu UV-1280 spectrophotometer measured at a wavelength of 555 nm after addition of the reactive. Veratrine hydrochloride was used as a standard.
Cyanogenic glycosides were quantified using the method of Bradbury and Egan (1992), based on the natural liberation of volatile HCN after plants were crushed and CN was reacted with picrate paper. Three hundred milligrams of the lyophilized potential cyanogenic sample was ground and placed in a glass vial, followed by 2 mL of phosphate buffer at pH 6. A strip of filter paper was previously prepared by dipping the paper in 0.02 m picric acid, drying in air and cutting into 2-cm2 pieces. The picrate paper was suspended above the cyanogenic sample and the vial was immediately tightly stoppered. The vials were placed in an oven at 30 °C for 12 h. The paper was immersed in distilled water for about 30 min and the absorbance was measured using a Shimadzu UV-1280 spectrophotometer at 510 nm against a similarly prepared blank developed in the absence of cyanogen. Standards were made with commercial products of linamarin (α-hydroxyisobutyronitrile β-d-glucopyranoside) and linamarase (β-glucosidase EC 3.2.1.21).
Seedling VOC profiles
For each species, 20 newly emerged seedlings were grown in 90-mm-diameter pots filled with John Innes No. 2 potting compost as described above. Due to the high number of seedlings required to provide enough VOCs to be detectable, it was not possible to isolate the aerial parts of the plants from the soil and pot to eliminate background volatiles. Instead, at 14 d old, the seedlings and compost were gently removed from the pots and soil was carefully washed away to avoid damage. Up to 140 seedlings per replicate (i.e. seven individual pots) were placed together in a 200-mL glass beaker with 100 mL of distilled water (see Rohloff and Bones, 2005; Shannon et al., 2016). This process was repeated four times for each species. We had previously established that while this approach eliminated volatiles from the soil and the pot, it did not alter the plant VOC profile (Shannon et al., 2016) and allowed us to quantify a 1.1–75.3 % cultivar-specific range of the major constituent GLV, 3-hexen-1-ol acetate, for Brassica napus.
All collections took place within an environment-controlled room (ECR) at 15 °C. Each beaker was placed inside a 46 × 56-cm polyester (PET) oven bag (Lakeland, Windermere, UK) (Stewart-Jones and Poppy, 2006) with one corner cut off, through which a Teflon tube was inserted before being tied shut. Air was drawn from the ECR air inlet via Tygon tubing (Saint-Gobain S.A., Paris, France), passed through an activated charcoal filter and pumped into the bag at a rate of 1000 mL min−1 using a Neuberger KNDC B pump (Neuberger, Freiburg, Germany). Three samples and one control (a bag containing a beaker with distilled water) were taken simultaneously, under two racks of compact fluorescent bulbs, giving approx. 200 μmol photons m−2 s−1 of photosynthetically active radiation at canopy height, equivalent to an overcast day. The open end of the bag was tied around a manual solid-phase microextraction (SPME) fibre holder (Supelco Inc., Bellefont, PA, USA) until the bag inflated, after which the SPME holder was removed. The bag was left for 1 h with the pump running to completely purge unfiltered air and allow the plants to acclimatize. The SPME holder was then replaced, the bag allowed to fully inflate and the SPME fibre exposed (Blue PDMS/DVB 65-μm fibre 57310-U, all from the same lot, Supelco Inc.). The airflow to each bag was reduced to 100 mL min−1 to maintain positive pressure, preventing contamination over the 2 h of VOC collection. As the volume of each tied and inflated bag was approx. 14 litres, this small airflow would only result in one change of air every 140 min (over a 120-min collection time). The SPME fibres were never saturated with any particular VOC. The maximum amount collected was a total ion count of around 10 000 000 – five to ten times less than typically collected when running standards. We had established previously that the proportion of each volatile in the profile remained constant as collection time increased, so there was no effect of volatile exclusion from a saturated fibre due to a long collection time (Shannon et al., 2016).
VOCs were detected using an Agilent 7890 gas chromatography (GC) system fitted with an HP Innowax column (polyethylene glycol, 30.0 m × 250 µm i.d. × 0.25 µm film) coupled to an Agilent 5977A Mass Selective Detector (MS) (Agilent Technologies Inc., Santa Clara, CA, USA) run in EI mode. Immediately following collection, the VOCs were thermally desorbed for 10 min from the fibre in the injector port. The GC system was operated in splitless mode, with helium carrier gas at 7.45 psi and the inlet temperature at 250 °C. The oven was maintained at 50 °C for the first 2 min, then increased by 5 °C min−1 for 4 min, followed by 10 °C min−1 for 17 min, ending at 240 °C. The GC-MS device was controlled by Agilent Mass Hunter software and data were analysed by Agilent Qualitative Analysis version B.06.00 software (Agilent Technologies). VOCs were initially identified using the NIST database, and confirmed by comparing retention time with standards (Sigma-Aldrich Ltd, Poole, UK) and calculating their Kovats retention index [by reference to the retention times of an alkane series (C7–C17) analysed using the same method as our samples – see Hanley et al. (2013)].
As several SPME fibres from the same manufacturing batch were used in collection of the VOCs, we used the percentage of each volatile in the total VOCs collected for each sample rather than using the total ion count to quantify VOCs, after first removing artefacts identified from our controls as arising from the SPME fibres or the GC column. We did not impose a lower limit for the percentage of total VOCs for individual compounds, as this would have excluded some that we had reason to expect might influence snail behaviour (Hanley et al., 2013; Shannon et al., 2016). However, we only included VOCs that appeared in the majority of samples from at least one species, to ensure consistency (Van Dam and Poppy, 2008).
Statistical analysis
To test the hypothesis (1a) that AI was influenced by CSDMs, we conducted Kendall’s Tau correlation tests between the mean values of the three groups of chemicals (phenolics, alkaloids and cyanogenics) and the AI. To test the hypothesis (1b) that seedling acceptability (AI) was linked with identifiable VOC profiles, we first established that each species had a distinct VOC profile using a canonical discriminant analysis. Due to the great diversity of VOCs collected from 14 species this was not suitable to subsequently use to compare with the AI. Having first performed a logit transformation on the VOC percentage data, we used Pearson’s product-moment correlations to establish whether AI was influenced by any of the major classes of VOCs, namely monoterpenes, sesquiterpenes and GLVs. To test Hypothesis 2, that seedlings expressing high concentrations of CSDMs advertise defensive capability with distinct VOC profiles, we conducted Kendall’s Tau correlation tests between the three groups of CSDMs and the three major groups of VOCs.
RESULTS
Seedling acceptability
The 14 plant species exhibited a very broad range of seedling acceptability (Table 1), extending from an AI score of zero for Jacobaeae vulgaris (where no ‘Test’ seedlings were attacked) to highly acceptable Centaurea nigra. Overall, of the total 424 seedlings attacked and damaged by snails, 300 (71 %) were consumed completely, probably immediately after initial contact was made. For seedlings of two species (Centuarea nigra, 38 % killed; Leucanthemum vulgare, 35 % killed), however, the likelihood of complete consumption after contact appeared to be markedly lower than the average for all other species, suggesting that snails were deterred from further attack after inflicting initial damage to seedlings.
Seedling acceptability (AI) and the concentrations of major constitutive secondary metabolites quantified from 14-d-old seedlings of 14 western European grassland plant species
| Species | Acceptability (AI) | n | Phenolics (mg g d. wt−1) | Alkaloids (mmol g d. wt−1) | Cyanide (mmol g d. wt−1) | ||||
|---|---|---|---|---|---|---|---|---|---|
| Mean | s.e. | Mean | s.e. | Mean | s.e. | Mean | s.e. | ||
| Asteraceae | |||||||||
| Achillea millefolium | 0.74 | 0.07 | 5 | 14.3 | 1.1 | ND | ND | ||
| Centaurea nigra | 0.94 | 0.08 | 4 | 15.3 | 1.7 | ND | ND | ||
| Jacobaea vulgaris | 0 | 0 | 4 | 12.6 | 1.1 | 3.0 | 0.4 | 0.9 | 0.1 |
| Leontodon hispidus | 0.74 | 0.10 | 5 | 15.4 | 1.1 | ND | ND | ||
| Leucanthemum vulgare | 0.57 | 0.06 | 7 | 16.6 | 1.1 | 6.7 | 1.3 | ND | |
| Taraxacum officinale | 0.44 | 0.10 | 4 | 20.3 | 0.9 | 6.0 | 1.6 | ND | |
| Caryophyllaceae | |||||||||
| Cerastium fontanum | 0.48 | 0.10 | 3 | 10.4 | 0.5 | 6.1 | 0.5 | ND | |
| Fabaceae | |||||||||
| Lotus corniculatus | 0.78 | 0.09 | 4 | 11.9 | 0.8 | 0.4 | 0.1 | 12.5 | 1.6 |
| Trifolium pratense | 0.61 | 0.03 | 5 | 11.1 | 0.6 | ND | 13.3 | 1.5 | |
| Trifolium repens | 0.59 | 0.12 | 5 | 12.0 | 0.4 | ND | 10.8 | 1.6 | |
| Plantaginaceae | |||||||||
| Plantago lanceolata | 0.68 | 0.09 | 4 | 16.9 | 0.9 | 5.7 | 1.3 | ND | |
| Poaceae | |||||||||
| Dactylis glomerata | 0.44 | 0.13 | 4 | 6.9 | 0.9 | ND | ND | ||
| Festuca rubra | 0.58 | 0.16 | 4 | 9.8 | 0.5 | ND | ND | ||
| Holcus lanatus | 0.22 | 0.07 | 4 | 9.8 | 0.9 | ND | ND | ||
ND (not detected) denotes a failure to detect any quantity above the detection limit. All acceptability trials were conducted on a minimum of ten replicate assays.
Constitutive secondary defence metabolites
All species contained phenolic compounds (Table 1), with the highest concentrations in the Asteraceae, while the Poaceae contained relatively low phenolic concentrations (and with no other compounds detected). Alkaloids were detected in six species and cyanogenic compounds in only four, the latter being most prevalent in the Fabaceae. There were, however, only very weak relationships between seedling AI and the amount of phenolic (Kendall’s Tau correlation r2 = 0.07; τ = 0.990, P = 0.322), alkaloid (r2 = 0.05; τ = −0.187, P = 0.392) or cyanogenic (r2 = 0.04; τ = 0.094, P = 0.677) compounds present in seedling leaf tissue. Indeed, a number of species with the highest concentrations of single (e.g. cyanide – Lotus, phenolics – Centaurea) or even multiple (phenolics and alkaloids – Plantago) CSDMs were amongst species with the highest (>0.68) AI. Consequently, we conclude that species-specific seedling selection by snails was unrelated to the expression of major CSDMs.
Volatile compounds
A large number of different VOCs were collected, including many that could be categorized as monoterpenes, GLVs or sesquiterpenes (Supplementary Data Table S1). In any investigation of this nature (i.e. 14 different species), a number of unknown VOCs are likely to be detected. Most unknown compounds could, however, be classified as mono- or sesquiterpenes, based on their molecular weights, retention times and Kovats retention indices. Each species had a distinct VOC profile and the canonical discriminant analysis categorized each sample into its correct species with 100 % accuracy (Fig. 1). The GLV 3-hexen-1-ol acetate was the dominant VOC for most species (Table 2); only Cerastium fontanum (6.9 % of total profile) and Lotus corniculatus (4.2 %) had profiles where this compound contributed <10 % of all VOCs. Other GLVs made a relatively minor contribution, except for Jacobea vulgaris, where 3-hexen-1-ol comprised 16.4 % of the total VOCs, although as with the other species 3-hexen-1-ol acetate was still the dominant GLV, comprising 75.7 % of the total VOCs. Jacobea vulgaris was also noteworthy in that its volatile profile was dominated (>96 %) by GLVs. Of the monoterpenes, β-ocimene (>15 % of all VOCs) dominated species volatile profiles. Although sesquiterpenes were detected in most species, they were generally present at only low amounts, and none were detected in Festuca rubra, Taraxacum officinale and Trifolium repens. In four species, however, Achillea millefolia, Cerastium fontanum, Centaurea nigra and Leucanthemum vulgare, sesquiterpenes contributed between 22 and 30 % of their total VOCs.
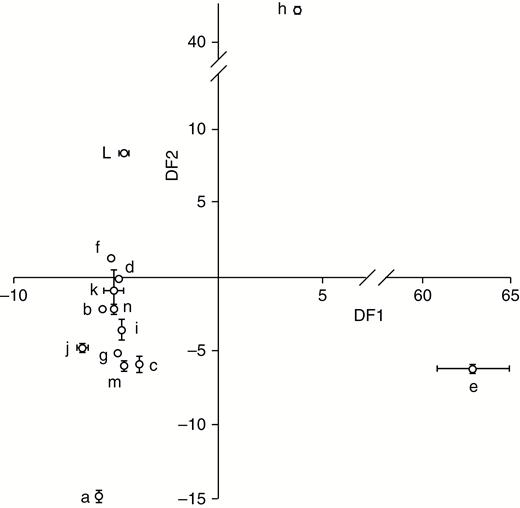
Discriminant factor 1 (DF1) and DF2 from a canonical discriminant analysis conducted on the mean (± s.e.) proportion of volatile organic compounds collected from seedlings of 14 grassland species. Key to species: a – Achillea millefolium; b – Cerastium fontanum; c – Centaurea nigra; d – Dactyllis glomerata; e – Festuca rubra; f – Holcus lanatus; g – Leontodon hispidus; h – Lotus corniculatus; i – Leucanthemum vulgare; j – Plantago lanceolata; k – Jacobaea vulgaris; l – Taraxacum officianale; m – Trifolium pratense; n – Trifolium repens.
Relative composition (% of total profile) of major groups of volatile organic compounds (most common individual component of each shown) quantified in 14 d-old seedlings of 14 grassland plant species. ND (Not Detected) denotes failure to detect any quantity above the detection limit. N = 4 for all samples except for Dactylis glomerata (N = 3).
| Species | Monoterpenes (%) | GLVs (%) | Sesquiterpenes (total %) | Other compounds (total %) | Unknown (%) | ||
|---|---|---|---|---|---|---|---|
| β-Ocimene | Total | 3-Hexen-1-ol acetate | Total | ||||
| Asteraceae | |||||||
| Achillea millefolium | 7.3 ± 7.3 | 38.5 ± 6.3 | 14.2 ± 6.6 | 14.3 ± 6.7 | 24.3 ± 3.4 | 9.6 ± 9.1 | 13.2 ± 7.3 |
| Centaurea nigra | 9.6 ± 5.0 | 29.0 ± 9.8 | 34.6 ± 14.1 | 35.1 ± 14.3 | 22.3 ± 7.9 | 1.3 ± 1.3 | 12.3 ± 4.9 |
| Jacobaea vulgaris | ND | 1.0 ± 1.0 | 75.7 ± 2.2 | 96.6 ± 1.7 | ND | 0.4 ± 0.4 | 2.1 ± 0.9 |
| Leontodon hispidus | 23.6 ± 13.3 | 65.4 ± 19.7 | 23.7 ± 18.1 | 25.4 ± 19.8 | 4.7 ± 2.8 | ND | 4.5 ± 0.6 |
| Leucanthemum vulgare | 13.6 ± 4.6 | 34.8 ± 10.8 | 12.5 ± 6.9 | 13.4 ± 7.8 | 25.8 ± 8.9 | 4.2 ± 1.3 | 21.8 ± 5.2 |
| Taraxacum officinale | ND | ND | 91.6 ± 3.5 | 94.8 ± 2.1 | ND | 1.9 ± 0.4 | 3.3 ± 1.7 |
| Caryophyllaceae | |||||||
| Cerastium fontanum | ND | 4.6 ± 4.6 | 7.9 ± 7.9 | 7.9 ± 7.9 | 30.2 ± 15.6 | 9.4 ± 9.4 | 47.9 ± 19.7 |
| Fabaceae | |||||||
| Lotus corniculatus | 57.4 ± 6.2 | 83.5 ± 4.0 | 4.6 ± 0.9 | 4.6 ± 0.9 | 9.0 ± 2.4 | 1.9 ± 1.2 | 0.9 ± 0.5 |
| Trifolium pratense | 40.3 ± 10.6 | 53.8 ± 7.6 | 17.3 ± 2.8 | 18.7 ± 2.9 | 6.3 ± 4.4 | 9.7 ± 7.3 | 11.4 ± 4.3 |
| Trifolium repens | 24.4 ± 10.3 | 31.7 ± 14.3 | 25.9 ± 12.0 | 27.8 ± 13.7 | 0.6 ± 0.6 | 28.8 ± 23.8 | 11.1 ± 6.4 |
| Plantaginaceae | |||||||
| Plantago lanceolata | 29.8 ± 10.3 | 32.2 ± 17.8 | 17.1 ± 16.3 | 17.5 ± 16.7 | 10.4 ± 8.4 | ND | 40.0 ± 19.8 |
| Poaceae | |||||||
| Dactylis glomerata | 36.1 ± 17.3 | 42.8 ± 16.5 | 14.8 ± 13.7 | 14.9 ± 13.8 | 1.2 ± 0.9 | 23.3 ± 12.9 | 17.7 ± 8.4 |
| Festuca rubra | 6.6 ± 1.2 | 19.8 ± 4.3 | 69.1 ± 6.0 | 71.5 ± 6.0 | ND | 5.1 ± 0.8 | 3.6 ± 1.2 |
| Holcus lanatus | 10.8 ± 3.9 | 15.9 ± 5.4 | 45.0 ± 14.1 | 45.5 ± 14.1 | 4.0 ± 1.1 | 9.8 ± 9.8 | 24.7 ± 3.6 |
ND (not detected) denotes a failure to detect any quantity above the detection limit. n = 4 for all samples except Dactylis glomerata (n = 3).
Snail preferences (AI) were positively correlated with the proportion of monoterpenes (Pearson’s product-moment correlation, r2 = 0.549, t = 2.274, d.f. = 12, P = 0.042) (Fig. 2A), and with β-ocimene in particular (Pearson’s product-moment correlation, r2 = 0.568, t = 2.394, d.f. = 12, P = 0.034), collected from each species (Fig. 2b). We also detected a (‘marginally significant’) positive relationship between AI and the proportion of sesquiterpenes in the VOC profile of each species (Fig. 2C) (r2 = 0.528, t = 2.151, d.f. = 12, P = 0.053). Although falling above the P < 0.05 convention, there was a negative relationship (Fig. 2D) between AI and the contribution of total GLVs (r2 = −0.490, t = −1.948, d.f. = 12, P = 0.075), probably reflecting the influence of the principal GLV, 3-hexen-1-ol acetate (r2 = −0.464, t = −1.816, d.f. = 12, P = 0.094) (Fig. 2E).
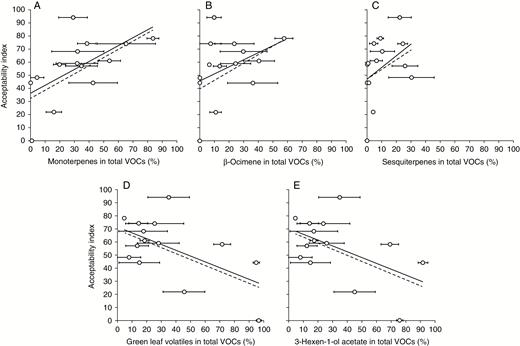
Relationship between seedling acceptability (AI) and the relative proportion (% in total profile) of major volatile organic compounds quantified from cotyledon-stage seedlings of 14 grassland plant species. Panels show: A, monoterpenes; B, β-ocimene; C, sesquiterpenes; D, green leaf volatiles; E, 3-hexen-1-ol acetate, and include results obtained when two species (Centaurea nigra and Leucanthemum vulgare – denoted by light grey circles) were excluded from analysis (see text for explanation). The solid line represents the regression when all 14 species are included, dashed line when 12 species are included.
Based on their anomalously lower post-attack mortality and an assumption that snail damage to Centuarea nigra and Leucanthemum vulgare elicited a seedling or snail response that prevented further attack (e.g. possible induction of CDSM or VOC defences), we repeated the analysis with the remaining 12 plant species only. In this case, AI remained positively correlated with monoterpenes (r2 = 0.587, t = 2.298, d.f. = 10, P = 0.044) and β-ocimene (r2 = 0.580, t = 2.251, d.f. = 10, P = 0.048) (Fig. 2A, B). While the positive relationship between AI and sesquiterpenes remained tentative (Fig. 2C) (r2 = 0.497, t = 1.811, d.f. = 10, P = 0.100), the negative relationship between AI and total GLVs (r2 = −0.701, t = −3.107, d.f. = 10, P = 0.011) and 3-hexen-1-ol acetate (r2 = −0.515, t = −1.900, d.f. = 10, P = 0.087) (Fig. 2D, E) strengthened. We therefore conclude that seedling selection by Cornu was more closely associated with VOC profiles than CSDMs, specifically that monoterpenes (and potentially sesquiterpenes) have a positive influence on snail selection, while GLVs probably have a negative influence (Hypothesis 1).
We performed Kendall’s Tau correlation tests between the CSDMs (alkaloids, cyanogenics and phenolics) and the VOC groups (monoterpenes, GLVs and sesquiterpenes) and found that none were correlated. We thus found no evidence to support our second hypothesis that VOCs signal the possession of CSDMs to putative herbivores.
DISCUSSION
Although our results support the assumption (Hulme, 1994; Barlow et al., 2013; Barton and Hanley, 2013) that species-specific variation in seedling herbivory hinges on the expression of chemical defences, surprisingly we found that CSDMs had little or no role in seedling selection by snails. Relative seedling acceptability was instead most closely associated with the proportions of two major classes of volatile compounds present in seedling VOC profiles, i.e. a positive relationship with monoterpenes and a negative relationship with GLVs. Consequently, not only does this study identify the likely mechanism by which terrestrial molluscs select and attack seedlings of different grassland plant species, we show that selection is most closely associated with VOCs (olfaction) rather than CSDMs (gustation).
GLVs function as primary seedling defence
To date, and probably by virtue of the fact that GLVs are synthesized in the same oxylipin pathway as jasmonic acids, GLVs have more frequently been associated with the priming or induction of plant defences or so-called SOS signalling, rather than playing a direct role in plant defence (Scala et al., 2013). However, recent studies have demonstrated a link between GLVs and food plant selection by snails. Hanley et al. (2013) reported that GLV concentrations in Plantago lanceolata increased during early ontogeny, while at the same time, snail olfactory selection (of macerated material) declined. Shannon et al. (2016) also found that seedling acceptability to snails was negatively associated with GLV-dominated volatile profiles and suggested the mechanism underpinning their deterrent effect when the application of a GLV blend to seedlings of the most acceptable OSR cultivar resulted in reduced olfactory selection. Although we were unable to determine whether one particular GLV compound or blend of compounds influenced snail selection in the present study, we do show that low acceptability species were those expressing GLV-dominated volatile profiles. Moreover, the single most abundant VOC in this study, the GLV 3-hexen-1-ol acetate, was one of the primary constituents of the GLV blend shown to repel snails in Shannon et al.’s (2016) olfactometer trials.
The role of monoterpenes in seedling selection by snails
It is also possible that snails use monoterpenes to locate preferred seedlings. Although relatively little is known about mollusc detection of, and response to, terpenoid compounds, working on six different chemotype populations Linhart and Thompson (1995) established that snails (Helix aspersa) actively selected Thymus vulgaris plants containing linalool, but avoided those dominated by monocyclic monoterpenes (carvacrol and thymol). Dodds et al. (1996) also showed that the monocyclic monoterpene carvone elicited neurophysiological activity in the slug Deroceras reticulatum suggestive of a repellent effect on mollusc feeding. We detected relatively few monocyclic monoterpenes in our samples (e.g. β-phellanderene, γ-terpinene and limonene); instead, and particularly for some high acceptability species such as Achillea, Leontodon, Lotus and Plantago, terpenoid profiles were dominated by acyclic monoterpenes (β-myrcene and β-ocimene) more similar to linalool, and/or bicyclic compounds (e.g. α- and β-pinene). Interestingly, Shannon et al. (2016) identified α-pinene and β-myrcene as putative snail attractants. By comparison, the very low acceptability species in our study (Jacobaea and Holcus) contained few or no monoterpene compounds at all (0 % and 20 %, respectively).
Possible herbivore induction of volatile defences
The fact that we found a stronger negative relationship between GLVs and seedling acceptability when Leucantheum vulgare and Centaurea nigra were excluded from the analysis raises two important issues. First, with only around one-third of seedlings killed after the initiation of snail attack, and no apparent exceptional allocation to CDSMs, our results indicate that Centuarea and Leucantheum seedlings may be capable of rapid upregulation of anti-herbivore defences at the cotyledon stage. Induction of anti-herbivore defences in very young seedlings has, however, never been documented, nor indeed considered likely, due to the view that plants at such an early ontogenetic stage are unable to synthesize chemical defences de novo (Boege and Marquis, 2005; Barton and Hanley, 2013). Secondly, for the remaining 12 species where attack led to complete consumption for at least 75 % of all attacked seedlings, our results suggest that high relative concentrations of GLVs in the volatile profile perform a deterrent role, preventing snail attack before any damage occurs.
Implications for our understanding of seedling defence
Given that we found no relationship between CSDMs and patterns of seedling selection by snails, our failure to elucidate any association between VOC profile and CSDM expression is perhaps unsurprising. A reliance solely on volatiles means that cotyledon-stage seedlings are unlikely to use VOCs to signal other defences. Indeed, given the usually catastrophic impact herbivory at the cotyledon stage has on seedling fitness and survival (Hanley and Fegan, 2007; Hanley, 2012; Barton, 2013), an ability to deter herbivores before contact is made seems especially adaptive for seedlings with probably limited capacity to allocate resources to anti-herbivore defence. GLVs may be a good candidate for this role; they are C-based, low-molecular-weight VOCs (Scala et al., 2013) and the oxidation and conversion of seed-stored fat reserves to sugars after germination is likely to release GLVs before other secondary defence metabolites accumulate to levels sufficient to defend the seedling.
This situation is, however, likely to change as the plant ages. Indeed as Barton and Boege (2017) point out, a failure to establish a clear relationship between trait (CSDM) expression and strength of an interaction (seedling section by herbivores) cannot discount the possibility that these compounds are effective deterrents at later ontogenetic stages and/or have other important functions at the life-history stage under investigation. Indeed, for most of our study species, (mono- and sesqui-)terpenes, phenolics, alkaloids and cyanogenic glycosides, are for established plants, important anti-herbivores defences (Grime et al., 2007). It is likely also that their relative roles (in isolation or combination) vary according to the selective impact of different herbivores throughout ontogeny (see Iason et al., 2011; Goodger et al., 2013). Establishing how, why and when a transition occurs from GLV-dominated defence to one where other metabolites and structural defences assume more importance (with VOCs perhaps playing a more significant role in signalling or induced defence) would go some way to better understanding the evolution and ecology of ontogenetic defence trajectories (Barton and Boege, 2017). Our study suggests, however, that some plant species counter the usually fatal consequences of seedling herbivory with GLV-based, volatile defences.
SUPPLEMENTARY DATA
Supplementary data are available online at https://dbpia.nl.go.kr/aob and consist of the following. Table S1: Relative (%) composition of total profile of major VOCs.
ACKNOWLEDGEMENTS
We thank Jane Akerman, Felicity Thom, Roberto Lo Monaco and Mike Cotton for technical assistance. This work was supported by the Leverhulme Trust (grant number RPG-083 to MEH, PLN and GMP).
