


Abstract
Background and Aims The patterning of floral ultraviolet (UV) pigmentation varies both intra- and interspecifically in sunflowers and many other plant species, impacts pollinator attraction, and can be critical to reproductive success and crop yields. However, the genetic basis for variation in UV patterning is largely unknown. This study examines the genetic architecture for proportional and absolute size of the UV bullseye in Helianthus argophyllus, a close relative of the domesticated sunflower.
Methods A camera modified to capture UV light (320–380 nm) was used to phenotype floral UV patterning in an F2 mapping population, then quantitative trait loci (QTL) were identified using genotyping-by-sequencing and linkage mapping. The ability of these QTL to predict the UV patterning of natural population individuals was also assessed.
Key Results Proportional UV pigmentation is additively controlled by six moderate effect QTL that are predictive of this phenotype in natural populations. In contrast, UV bullseye size is controlled by a single large effect QTL that also controls flowerhead size and co-localizes with a major flowering time QTL in Helianthus.
Conclusions The co-localization of the UV bullseye size QTL, flowerhead size QTL and a previously known flowering time QTL may indicate a single highly pleiotropic locus or several closely linked loci, which could inhibit UV bullseye size from responding to selection without change in correlated characters. The genetic architecture of proportional UV pigmentation is relatively simple and different from that of UV bullseye size, and so should be able to respond to natural or artificial selection independently.
INTRODUCTION
The incredible diversity of floral displays found in the natural world is a product of the need to attract pollinators (e.g. Møller, 1995; Bradshaw and Schemske, 2003), and floral diversity has played a key role in the ecology and evolution of flowering plants. Furthermore, successful pollinator attraction is critical for high yield in many agricultural crops (Klein et al., 2007). For these reasons, the genetic architecture of floral traits has intrigued biologists since Mendel (Weldon, 1902). However, a still poorly understood aspect of floral display is ultraviolet (UV)-absorbing pigmentation patterns, or nectar guides. These patterns, made by UV-absorbing pigment invisible to humans but visible to many pollinators, can affect pollinator attraction (Yongsheng et al., 2001; Koski and Ashman, 2014; Brock et al., 2016). A better understanding of the genetics of UV nectar guides is a key step towards understanding their ecology and evolution, and can provide valuable information to agricultural breeding programmes for species that rely on animal pollination.
Much of the work on UV nectar guides has focused on their effect on pollinators (Harborne and Smith, 1978; Penny, 1983; Leonard and Papaj, 2011). Research has shown that most insect pollinators and some birds can perceive UV light (Cuthill et al., 2000; Briscoe and Chittka, 2001; Ödeen and Håstad, 2013). Most insects that have been studied have visual pigments sensitive to UV-A light (315–400 nm), including pollinators in Hymenoptera and Lepidoptera (Briscoe and Chittka, 2001). UV nectar guides are often hypothesized to improve pollinator efficiency through faster flower handling time and increased attractiveness (Waser and Price, 1985; Dinkel and Lunau, 2001; Lunau et al., 2006). In radially symmetrical flowers and composite flowerheads, UV pigments are often found in the centre and on the inner portion of the petals or ray florets, a pattern called the UV bullseye (Fig. 1). The size of this UV bullseye varies within and among species and can affect pollinator activity (Scogin, 1978; Horth et al., 2014). UV bullseyes are more often found on bee-pollinated flowers than on bird-pollinated flowers, and bees are more likely to make initial contact on UV-pigmented areas of patterned artificial flowers (Papiorek et al., 2016). Thus, the presence or size of the UV bullseye may have large implications for plant reproductive success.

(A) A representative Helianthus argophyllus flowerhead photographed in the visible spectrum. (B) A representative H. argophyllus flowerhead photographed in UV spectrum (dark = UV absorbed). Indicated are the two measures of disc diameter and the measurements made for ray ligule length and ray ligule UV-pigmented length (on three ligules per flowerhead, asterisks).
Beyond the effect on pollinators, floral UV pigments may be useful to the plant directly. UV light is potentially damaging or mutagenic, and UV pigment in reproductive structures has been shown to protect against these effects in maize (Stapleton and Walbot, 1994). Similarly, UV pigment in petals or ray florets may reduce UV light reflected onto pollen or reproductive disc florets (Day and Demchik, 1996), which may be why floral UV pigmentation is correlated with altitude and latitude in some systems (e.g. Koski and Ashman, 2015a, b). Finally, UV pigments in floral tissue may act to deter or be toxic to insect herbivores (Gronquist et al., 2001). More broadly, UV light helps to regulate plant growth through the reception by UV pigments including cryptochromes, phototropins and UVR8 (Liu et al., 2011; Heijde and Ulm, 2012).
UV-absorbing floral pigments have been identified in a number of systems and are primarily flavonols and flavones from the flavonoid biosynthetic pathway (Thompson et al., 1972; Scogin et al., 1977; Rieseberg and Schilling, 1985; Gronquist et al., 2001; Sasaki and Takahashi, 2002; Schlangen et al., 2009). Genes regulating floral colour are generally conserved across angiosperms (Rausher, 2008; Davies et al., 2012; Sobel and Streisfeld, 2013), and often involve members of the MYB or UDP-glycotransferase families or proteins containing WD40 or bHLH repeat domains (Walker et al., 1999; Heim et al., 2003; Ramsay and Glover, 2005; Schwinn et al., 2006). However, until recently, the genes regulating UV bullseye and other floral UV pigmentation patterns have not been the focus of much research, probably due to the difficulty of phenotyping traits invisible to the human eye. One recent study has identified an MYB transcription factor as regulating interspecific differences in UV floral patterning in Petunia (Sheehan et al., 2016), and another recent quantitative trait loci (QTL) study in Brassica rapa found evidence suggesting that an MYB transcription factor targeting a flavonoid biosynthesis gene is responsible for differences in UV bullseye presence between crop and wild accessions (Brock et al., 2016). To our knowledge, our study is the first to examine the genetic architecture of this ecologically and agriculturally important trait in the Asteraceae.
Helianthus argophyllus, the silverleaf sunflower, is an excellent system for studying variation in UV patterning. Like many species in the Asteraceae, the composite flowerheads of this species have a UV bullseye composed of uniformly UV-pigmented disc flower petals and ray ligules [fused petals of the outermost whorl(s) of flowers] that express UV-absorbing pigments on the portion closest to the disc (Fig. 1). The size of the UV bullseye and the proportion of the ray ligule that expresses UV pigments varies intraspecifically (Supplementary Data Fig. S1). This variation may affect the reproductive ecology of this species: H. argophyllus is self-incompatible and relies on insect pollination by generalist pollinators (Heiser et al., 1969). The silverleaf sunflower is also the sister species to H. annuus, the wild progenitor of the domestic sunflower, with which it is partially reproductively compatible and to which it has donated several agronomically important alleles (e.g. Christov, 1990; Wieckhorst et al., 2010). Domestic sunflowers are a globally important oilseed crop (Weiss, 2000), and commercial production uses hybrid seeds, so efficient pollination is a critical component of commercial production. Considering the effect of UV floral patterning on pollinator behaviour, it represents an under-appreciated area for sunflower breeders, and information on the genetics of UV patterning could open up this trait to selective breeding. UV patterning may also play a role in reproductive barriers between species and speciation, and Helianthus is a model system for these processes (Kane et al., 2013).
To better understand the genetic architecture of floral UV pigmentation, we map QTL for UV bullseye diameter (absolute size) and the proportion of ray flower ligule length expressing UV-absorptive pigments (relative size, referred to throughout as ‘proportional UV pigmentation’; Fig. 1B) in an intraspecific H. argophyllus F2 population, and compare these to QTL for three measures of flowerhead size. We ask: (i) how many loci of what effect size control these traits? (ii) Are these loci predictive of phenotypic variation in natural populations? This latter question gives us insight into whether our observed genetic architecture(s) is broadly applicable to the species or specific to our particular bi-parental population. Finally, we speculate on possible candidate genes underlying these QTL, and how the genetic architecture of these traits might influence how they respond to natural or artificial selection.
MATERIALS AND METHODS
Natural history
Helianthus argophyllus is an annual sunflower native to the Texas Coastal Bend, where it grows on deep sands along the coast, along waterways and on the barrier islands (Lehman et al., 2005). Like all sunflowers, it is primarily pollinated by bees, but is also visited by flies, moths and beetles (Heiser et al., 1969; B. T. Moyers, pers. observ.). Helianthus argophyllus exhibits substantial variation in life history, both within populations and across its relatively small range (Moyers and Rieseberg, 2016). Some individuals initiate flowering relatively early (in May/June), reach a mature height of 1–2 m and produce larger composite flowerheads, while others flower later (in September/October), grow up to 4 m tall and produce relatively smaller flowerheads. This variation appears to be under simple, pleiotropic genetic control (B. T. Moyers, pers. observ.).
We know from the literature and preliminary observations that UV bullseye size and proportional UV pigmentation vary within this species and within the Helianthus genus (Fig. S1; Scogin, 1978). UV pigmentation in Helianthus can vary from fully UV-pigmented ligules to little or no pigmentation, and flowerhead size also varies among and within species (Heiser et al., 1969).
Population design
We created an F2 mapping population by reciprocally cross-pollinating one plant from the Helianthus argophyllus accession ARG-1805 (USDA PI 494571) with one plant from the accession ARG-1834 (USDA PI 494582) in 2010, and then reciprocally cross-pollinating three pairs of F1 offspring in 2011. Detailed information about USDA accessions is available through the USDA Germplasm Resources Information Network at http://www.ars-grin.gov/, using the accession Plant Introduction (PI) number. We kept track of both cytoplasmic inheritance and F2 family for all F2 individuals. This mapping population was created to investigate the genetic architecture of other phenotypic differences and the two parental accessions do not differ significantly in proportional UV pigmentation (t = 1·416, d.f. = 30·53, P = 0·167) or UV bullseye diameter (t = 0·493, d.f. = 30·86, P = 0·626). We noticed, however, that the F1 population generated from this cross had significantly larger proportional UV pigmentation (t = 5·129, d.f. = 14·69, P = 0·0001) and UV bullseye diameter (t = 2·677, d.f. = 12·39, P = 0·0197) than both parent accessions, suggesting that the genetic basis of floral UV pigmentation was different or heterozygous in the two parent individuals. This motivated us to examine the genetic architecture of floral UV pigmentation variation in this F2 mapping population.
In 2012 we grew 400 F2 individuals along with 20 F1, 20 ARG-1805 and 20 ARG-1834 plants in a professionally managed, uniform agricultural field near Woodland, CA, USA. This area is outside of the species range and consequently does not harbour any native range pests. We also grew 20 individuals from each of two other USDA accessions: ARG-1820 (USDA PI 494580) and ARG-1575 (USDA PI 468651), to look at phenotypic and genotypic variation in the species more broadly. To standardize germination timing, on 6 March we scarified seeds by cutting off the top third of the pericarp/endosperm and then placed them on moist filter paper in the dark for 1 week, until most had produced a root and shoot. We planted the germinated seedlings into seedling medium in 72-cell flats (approx. 44 ml capacity per cell). We grew the seedlings at ambient light and temperature in a greenhouse for 3 weeks, then acclimatized the plants in a shaded outside area for 4 days. On 3–4 April we transplanted the seedlings every 1 m into six rows separated by 5 ft (∼1·52 m). Each row was equipped with two parallel buried drip tapes for irrigation. We randomly assigned plants to row locations in groups of 20 (F2) or five (all others) individuals. We planted an additional five plants at each end of each row and an extra row on each side of the plot to buffer against edge effects. For the first week after transplanting, we watered the plot daily and replaced those individuals that died (<5 %) with plants from the same genotype group. After the first week, we watered the plot three times per week unless it rained, and did not replace any further dead individuals (<1 %). We hand-weeded the plot weekly until harvest.
Phenotyping
To measure individual UV pigmentation, we used a Nikon D70s digital camera. This camera model has poor internal UV filtering, making it ideal for UV photography. The camera was fitted with a Noflexar 35-mm lens and a reverse-mounted 2-inch Baader U-Filter (Baader Planetarium, Mammendorf, Germany), which only allows the transmission of light between 320 and 380 nm. We chose this wavelength range because it was beyond human visual perception and overlapped with insect UV visual pigment sensitivity (Briscoe and Chittka, 2001). We phenotyped all F2 and F1 individuals, as well as representatives from the parental accessions ARG-1805 and ARG-1834 and the non-parental accession ARG-1820. We removed one reproductively active flowerhead (preferentially choosing those with fully expanded ray floret ligules) per plant and photographed it within 5 min of collection. We used ambient sunlight as a UV light source, and minimized light variation by taking all photos in direct sunlight on cloudless days within 5 h around midday (0930–1430 h). In all cases, UV patterning was clearly visible in these photos (Data available from the Dryad Digital Repository: http://dx.doi.org/10.5061/dryad.h21v2). We analysed photographs in ImageJ (Schneider et al., 2012). For each flowerhead photo we measured the horizontal and vertical widths of the flowerhead disc along with the full length and pigmented length of three ray florets around the disc (Fig. 1B). We preferentially chose the fully extended ray floret ligules nearest three standardized locations, starting with 0° as vertical North: 45°, 180° and 315° (Fig. 1B, asterisks). We included an object of known length (a binder clip) in all photographs to transform pixel measurements into centimetres. We calculated proportional UV pigmentation for each plant by dividing the UV-pigmented length by the full length of each measured ligule, and then taking a mean across the three measurements. In H. argophyllus, the disc florets uniformly express UV pigments, so we also calculated the diameter of the UV bullseye as the mean diameter of the disc (horizontal and vertical measurements) plus twice the mean UV-pigmented length of the three ray florets. Additionally, to examine how UV pattern size varied with flowerhead size, we calculated disc diameter as the average of the two measurements, ligule length as the average of the three full length measurements, and total flowerhead diameter as two times ligule length plus disc diameter. We also scored flowerhead maturity into four bins of either <25, <50, <75 or up to 100 % of disc floret whorls reproductively active. Our final dataset contains measurements for 365 F2 plants as well as F1, parent and natural population individuals.
We calculated broad sense heritability (H2) for each trait as VG/VP, where VP is the phenotypic variance in F2 individuals and VG is that variance minus the average variance in the two parental populations (Falconer and Mackay, 1996). We calculated Pearson pairwise and partial pairwise correlations among traits in F2 individuals using the R package ppcor (Kim, 2015).
Genotyping
We collected 10-mm discs of young leaf tissue from all plants in the field and stored these on ice for <2 h before lyophilization. We also collected whole young leaves from the two parent individuals from accessions ARG-1805 and ARG-1834 in 2010, and stored these leaves at − 80 °C. We extracted DNA using a modified 96-well plate DNeasy (Qiagen, Valencia, CA, USA) protocol optimized for common issues with sunflower extractions (described in Horne et al., 2004), and randomly assigned each sample to a well within an extraction plate. We re-extracted samples that had concentrations of < 20 ng µL–1 (BR assay, Qubit 2.0 Fluorometer, Life Technologies, Carlsbad, CA, USA), or that exhibited 260/230 or 260/280 absorbance ratios <1·6 (NanoDrop Spectrophotometer, Fisher Scientific, Pittsburg, PA, USA).
We prepared multiplexed genotyping-by-sequencing (GBS) libraries following a modified version of the two-enzyme protocol developed by Poland et al. (2012). This protocol uses a frequent cutter (MspI) and a rare cutter (PstI), which helps to create a set of reproducible GBS fragments in species with large, complex genomes like Helianthus. We used 10 mm Tris-HCl (pH 8·0) as our elution and storage buffer throughout. First, we digested 100 ng of sample DNA at 8·5 ng µL–1 with 8 units each of PstI–HF and MspI restriction enzymes (New England BioLabs, Ipswich, MA, USA) for 5 h at 37 °C, followed by 20 min at 65 °C to heat inactivate the enzymes. We then ligated one of 192 unique barcoded adapters (1·8 ng) and a common Y-shaped adapter (0·25 µm, following Poland et al., 2012) to each digested sample by incubating them with ∼200 units of T4 DNA Ligase (New England BioLabs) and ATP for 34 h at 22 °C, followed by 20 min at 65 °C. After ligation, we pooled sets of 96 uniquely barcoded samples, then cleaned and concentrated the pooled libraries using a home-made SeraMag Speed Bead mix (following Rohland and Reich, 2012) at 1·6× volume, eluting into ∼125 µL volume. For each library we then selected all fragments from 250 to 750 bp using a QIAquick gel extraction kit (Qiagen, Hilden, Germany). We cleaned and concentrated the extracted fragments using another 1·6× volume SeraMag Speed Bead, then amplified these libraries with the paired-end Illumina primers and PCR protocol (14 cycles) described in Poland et al. (2012). After PCR, we again cleaned and concentrated these libraries using a 1·6× volume SeraMag Speed Bead protocol. Two libraries (96 uniquely barcoded samples each) were then quantified and sequenced. For all other libraries, we performed a duplex-specific nuclease (DSN) treatment following Matvienko et al. (2013) with modifications optimized for our libraries (M. Todesco, University of British Columbia, Canada, unpubl. res.). After the DSN treatment, we re-amplified the libraries using the same primers and PCR protocol for eight cycles, then cleaned and concentrated these amplified libraries with a 1·6× volume SeraMag Speed Bead protocol. This step reduces the proportion of high-copy fragments (e.g. chloroplast sequence) in each library from >25 % to < 5 %, allowing us to further multiplex libraries into 192 uniquely barcoded samples. We sequenced each library (96 or 192 multiplex) for paired-end reads on one lane of the Illumina HiSeq 2000 platform (Illumina Inc., San Diego, CA, USA). Other than a reduction in high-copy fragments, we do not observe differences in the sequence data or downstream products (e.g. genotype calls) due to the DSN treatment (B. T. Moyers, pers. observ.). All sequence data were output in fastq format converted by Illumina-supported CASAVA 1·8.4 (Illumina Inc.).
We generated a set of bi-allelic single nucleotide polymorphisms (SNPs) using the uneak pipeline (from TASSEL 3, Lu et al., 2013). As uneak is built for single-end sequence data, we translated the paired-end fastq sequencing files into two independent sets of individually barcoded reads with a custom Perl script (Data available from the Dryad Digital Repository: http://dx.doi.org/10.5061/dryad.h21v2). We called and merged tag counts for technical replicates of each individual with the UMergeTaxaTagCountPlugin, requiring a minimum count of 50 per tag and a maximum tag number of 109. The merged tag count file of all samples contained 82 057 452 tags, 1120 616 of which passed the count minimum and were represented by 1664 296 401 matching reads. We set the sequencing error tolerance rate for the UTagCountToTagPairPlugin at 0·03, which is typically what we observe in our GBS sequencing libraries (B. T. Moyers, pers. observ.). This step generated 381 555 tag alignments (358 474 at size = 1 plus 23 081 error curated from size >1), within which we found 80 730 reciprocal tag pairs. We next used the UTagPairToTBTPlugin to generate a tag by taxa matrix for these tag pairs, then the UTBTToMapInfoPlugin to identify SNPs and call SNP genotypes for each individual. Finally, we outputted genotype and tag data for all individuals at a set of 65 886 SNPs filtered for minor allele frequency >0·05 using the UMapInfoToHapMapPlugin. This last plugin generates three files: (1) a HapMap file containing individual SNP genotype calls, (2) a HapMapCount file with the tag counts for each individual at each tag pair and (3) a HapMapFasta file containing the tag sequences.
Using bash commands (Data available from the Dryad Digital Repository: http://dx.doi.org/10.5061/dryad.h21v2), we called genotypes using more stringent filters than the standard uneak HapMap plugin, starting with the HapMapCount file (for each individual at each tag pair: minimum of ten tags, heterozygote if the ratio of the two tags <10, homozygote if the ratio of the two tags >50, otherwise N), filtered the resulting file for sites with alternate homozygous genotypes in the two parent individuals (7875 sites), filtered those sites for a minimum coverage of 50 % across all individuals and observed heterozygousity of 0·3–0·7, and then formatted these genotypes for import into R/qtl. The filtered dataset included 715 SNPs genotyped in 386 F2 individuals. We aligned the tags used in QTL mapping against the HA-412 H. annuus genome (HA412.v1.1.bronze) using BWA-MEM (with -k 30; Li and Durbin, 2010) to examine synteny and putative chromosomal regions underlying our QTL. Helianthus annuus is the sister species to H. argophyllus, with an estimated divergence time of 1·2–2·0 Mya (J. L. Strasburg, University of Minnesota Duluth, USA, unpubl. res.). The two species each have 17 chromosomes that are largely syntenic, although they differ by an estimated eight translocations and ten inversions (Barb et al., 2014), and the H. argophyllus genome is approximately 16 % larger than that of H. annuus (1C = 4·43 versus 3·7 pg; Kantar et al., 2014).
Linkage map construction and QTL mapping
We constructed our linkage map using the R package qtl (v1.38-4; Broman et al., 2003). We formed linkage groups with a maximum recombination frequency of 0·2 and a minimum LOD score [(logarithm (base 10) of odds] of 8, before reordering markers in windows of five using a likelihood approach. We filtered out SNP markers with: <55 % coverage (12 markers), identical genotypes across individuals (zero markers), highly statistically significant segregation distortion (P < 0·0001, 154 markers) or that decreased the LOD of individual linkage groups by more than 40 (19 markers). We filtered out F2 individuals with: >30 % missing data (30 individuals), one of each pair with >80 % identical genotypes (four individuals with more missing data), or > 50 cross-over events in the final linkage map (25 individuals). Finally, we identified and set as missing the individual genotypes likely to be genotyping errors: single genotypes out of phase with nearby closely linked markers.
We identified QTL using multiple QTL modelling as implemented in R/qtl (Broman et al., 2003; Arends et al., 2010). We first used the scanone() and scantwo() functions to identify putative single and two-way epistatic QTL, then used these QTL as the initial state for the function stepwiseqtl(), which performs a forwards and backwards stepwise selection to identify the multiple QTL model with the highest penalized LOD score (pLOD). Multiple QTL modelling is based on model selection rather than hypothesis testing, and has several advantages: (1) it increases the power of the analysis to detect QTL, (2) it is better able to disentangle the effects of linked and interacting QTL, and (3) it protects against model over-fitting (Arends et al., 2010). We used Haley-Knott regression, penalized model LOD using a set of 1000 permutations of the scantwo() function, allowed for a maximum of 20 QTL and included F2 family as a covariate. We removed any model terms (QTL or covariate) that did not significantly alter the model when dropped (α = 0·05), and calculated the 95 % credible interval for each QTL using the bayesint() function. We estimated the per cent variance explained by the final QTL model, as well as the per cent variance explained and additive and dominance effects of each QTL and QTL interaction, using the fitqtl() function. To examine whether flowerhead maturity affected our QTL analyses for the four traits with significant associations (UV bullseye diameter, ray floret ligule length, disc diameter and total flowerhead diameter), we re-ran these QTL analyses with subsets of individuals that did not have significantly different values due to flowerhead maturity in Tukey’s post-hoc tests. For disc diameter, this included those with >25 % active flowerheads (270 individuals), and for the other three traits those with >50 % active flowerheads (200 individuals).
Natural populations
We predicted proportional UV pigmentation and UV bullseye size in 37 individuals from three natural populations from their genotypes at the markers closest to each QTL LOD peak. These three populations included the parental USDA accessions ARG-1805 (n = 11) and ARG-1834 (n = 15) and an additional accession ARG-1820 (n = 13; USDA PI 494580). In our simple predictive model, we added the additive and dominance effects for each genotype of each QTL from the multiple QTL model (Table 2) to the model intercept to predict the phenotype from each individual’s genotype. These predictions were compared with actual phenotypes measured from photographs using Pearson’s product-moment correlation tests, as implemented in the R stats package (R Core Team, 2013).
We also calculated allele frequencies for the markers closest to each QTL LOD peak in four populations (the three above and ARG-1575, USDA PI 468651). ARG-1805 and ARG-1834 are the accessions from which parental individuals were drawn, while the other two accessions were not involved in creating the F2 mapping population. We examined if the genotype frequencies for each locus across these four populations violated Hardy–Weinberg equilibrium (HWE) using Fisher’s exact tests and adjusted the resulting P values for multiple testing following Holm (1979).
Candidate loci
To examine genes underlying the QTL for proportional UV pigmentation, we used the most recent annotation of the HA-412 H. annuus genome (Version 1.1.bronze, http://www.sunflowergenome.org). All genes in the chromosome regions spanned by aligned GBS tags of each QTL (i.e. SNP markers under each QTL’s Bayesian 95 % credible interval) were translated and matched against the Arabidopsis thaliana TAIR10 protein database using blastp (e < e–20; Lamesch et al., 2011). Using the TAIR10 database, we selected A. thaliana proteins known to be associated with flower patterning, specifically proteins with WD or bHLH functional domains or part of the MYB or UDP-glycotransferase families (Ramsay and Glover, 2005). We did not do this for the single QTL underlying the four other traits because we think it likely that the effect of this QTL is due to pleiotropy from a flowering time locus (see Discussion).
RESULTS
Phenotypes
UV bullseye diameter is strongly positively correlated with proportional UV pigmentation, disc diameter and total flowerhead diameter, but negatively correlated with ray ligule length, in each case when controlling for the other traits (Table 1). This indicates that disc diameter and proportional UV pigmentation both contribute to UV display. These two components are strongly negatively correlated when bullseye diameter and other flowerhead size traits are taken into account: for a given UV bullseye size, larger flowerheads have a smaller proportion of UV pigment expression (Table 1).
Pearson’s pairwise (bottom diagonal) and partial pairwise (top diagonal, italics) correlations among UV and flowerhead size traits among 365 F2 individuals; all correlations are significant at P < 0·01
| Trait | Proportional UV pigmentation | UV bullseye diameter | Flowerhead disc diameter | Ray ligule length | Total flowerhead diameter |
|---|---|---|---|---|---|
| Proportional UV pigmentation | — | 0·978 | –0·925 | 0·573 | –0·971 |
| UV bullseye diameter | 0·504 | — | 0·95 | –0·591 | 0·996 |
| Flowerhead disc diameter | 0·178 | 0·852 | — | 0·808 | –0·941 |
| Ray ligule length | 0·161 | 0·841 | 0·622 | — | 0·561 |
| Total flowerhead diameter | 0·18 | 0·918 | 0·794 | 0·97 | — |
Broad-sense heritability (H2) for UV bullseye diameter was 0·53, somewhat higher than for proportional UV pigmentation at 0·36. For the non-UV measures of flowerhead size heritability was more variable, 0·57 for disc diameter, 0·22 for total diameter and 0·02 for ligule length. Heritability for ligule length was relatively small, as variance among parental accession individuals was almost as high as variance in this trait in the F2 population. This indicates that this trait as measured in this study has a large environmental component.
We find no evidence that cytoplasmic origin (mother or grandmother from either accession) affects proportional UV pigmentation (t = −0·502, d.f. = 359·230, P = 0·616). However, the three F2 families did differ significantly in this trait (F2,366 = 12·678, P < 0·0001), suggesting that at least one of the genetic loci underlying proportional UV pigmentation was heterozygous in one or both parents. Absolute UV bullseye diameter may have some maternal component: cytoplasmic origin had a marginally significant effect (t = −1·827, d.f. = 359·61, P = 0·068), while F2 family did not (F2,362 = 1·312, P = 0·271).
F1 individuals have on average larger UV bullseye diameters than either parent accession (t = 2·677, d.f. = 12·391, P = 0·0197; Fig. 2), primarily due to larger proportional UV pigmentation (t = 5·1294, d.f. = 14·692, P = 0·0001; Fig. 2). F1 individuals are not significantly differ from either parental accession for the three measures of flowerhead size (Fig. 2).
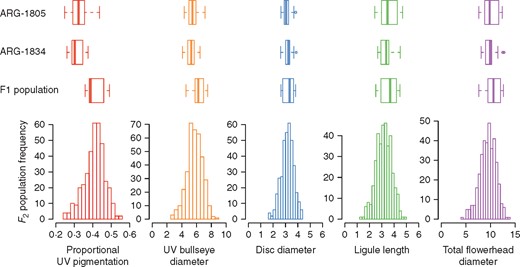
Trait distributions for each genotype class: the two parental accessions (ARG-1805, n = 21; and ARG-1834, n = 18), F1 individuals (n = 22) and F2 individuals (n = 369). Proportional UV pigmentation on the ray ligule is bounded from 0 to 1, while the other four traits are length in centimetres. For each box-and-whisker plot, the central line represents the median, the boxes represent the first and third quartile, and the whiskers extend to roughly 95 % of the distribution. The F2 individual values are represented by frequency histograms.
As intended, our sampling was biased towards more mature flowerheads (∼12, 22, 29 and 38 % in each bin of < 25, <50, <75 and up to 100 % reproductively active disc floret whorls, respectively). This sampling distribution was not significantly different across F2 family, cytoplasmic origin or date of sampling. This distribution also did not differ across parental, F1 and F2 individuals. While flowerhead maturity did not affect proportional UV pigmentation (F3,432 = 1·960, P = 0·119), it did affect UV bullseye diameter (F3,428 = 21·441, P < 0·0001), ligule length (F3,428 = 50·039, P < 0·0001), disc diameter (F3,428 = 8·884, P < 0·0001) and total flowerhead diameter (F3,428 = 34·057, P < 0·0001). For all four traits, more mature flowerheads had larger values. Tukey’s post-hoc tests distinguished flowerheads with <25 % mature disc floret whorls from more mature flowerheads in disc diameter and flowerheads with <50 % mature disc floret whorls from more mature flowerheads for the other three traits. Phenotype and genotype data are available from the Dryad Digital Repository: http://dx.doi.org/10.5061/dryad.h21v2; Moyers et al., 2017).
Linkage map and QTL
The final linkage map data include 530 SNPs genotyped in 327 F2 individuals, with an average genotyping rate of 89 % and an estimated genotyping error rate of 1–1·25 %. Our map is composed of the expected 17 linkage groups (LGs) totalling 1124·1 cM (from 20·8 to 147·0 cM; 13–56 markers/LG; Supplementary Data Fig. S2). Eleven markers are not assigned to any of these LGs, although four and two of these cluster together. A comparison of our genetic map against physical locations in the HA-412 H. annuus genome shows that they are largely syntenic outside of known major chromosomal rearrangements between the two species (Supplementary Data Fig. S3; Barb et al., 2014).
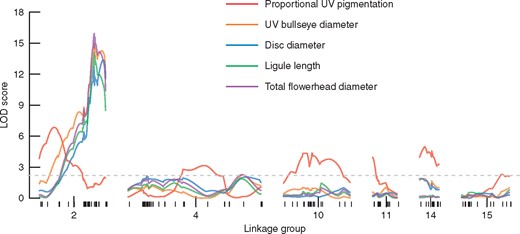
Linkage mapping LOD traces for five traits (absolute and proportional UV pigmentation size and three measures of flowerhead size) along the six linkage groups with significant QTL. Marker spacing on each linkage group is indicated by the lower rug marks, and the dashed grey line represents the genome-wide 95 % significance threshold based on 1000 permutations.
Our QTL analyses find two genetic architectures for our five traits (Fig. 3). Proportional UV pigmentation is controlled by six moderate effect QTL on six LGs that interact additively (Table 2; Supplementary Data Fig. S4). Parent ARG-1805 (USDA PI 494571) contributes positive effect alleles at four QTL, while parent ARG-1834 (USDA PI 494582) contributes positive effect alleles at the other two QTL (Table 2; Fig. S4). At two QTL the alleles interact additively (QTL 10@46·0 and 14@18·0), while the other four QTL show partial or full allelic dominance (Table 2; Fig. S4). Collectively, these QTL explain 35·2 % of the observed variance and have a total LOD score of 29·32 (Multiple QTL model F12,298 = 5·15, P < 0·0001).
QTL position, 95 % Bayesian credible interval, peak LOD score, per cent variance explained (PVE), the additive (a, effect of the ARG-1834 allele) and dominance (d) effects, the absolute value of the ratio of d/a, and the H. annuus genome major syntenic region (chromosome: Mb span) for each QTL for proportional UV pigmentation on the ray ligule (0–1 scale) and UV bullseye diameter, flowerhead disc diameter, ray ligule length and total flowerhead diameter (cm)
| Trait | Map LG | Peak (95 % CI) (cM) | Peak LOD | PVE | a ± s.e. | d ± s.e. | d/a | Syntenic region in H. annuus |
|---|---|---|---|---|---|---|---|---|
| Proportional UV pigmentation | 2 | 18·0 (12·0–23·0) | 10·2 | 10·6 | –0·027 ± 0·004 | 0·008 ± 0·006 | 0·296 | Hann 15: 3·73– 65·88 |
| 4 | 60·8 (59·0–73·0) | 5·2 | 5·2 | 0·013 ± 0·004 | 0·015 ± 0·006 | 1·154 | Hann 17: 39·20–227·19 | |
| 10 | 46·0 (22·0–56·0) | 6·3 | 6·3 | –0·020 ± 0·004 | –0·002 ± 0·006 | 0·100 | Hann 11: 8·40–193·72 | |
| 11 | 0·4 (0·0–3·0) | 5·2 | 5·1 | 0·014 ± 0·004 | 0·014 ± 0·005 | 1·000 | Hann 3: 50·80–143·93 | |
| 14 | 18·0 (12·3–27·3) | 4·2 | 4·1 | –0·016 ± 0·004 | –0·001 ± 0·005 | 0·063 | Hann 2: 2·82–176·61 | |
| 15 | 45·0 (40·0–52·9) | 4·1 | 4 | –0·015 ± 0·004 | 0·007 ± 0·005 | 0·467 | Hann 8: 7·85–96·71 | |
| UV bullseye diameter | 2 | 60·9 (60·0–72·1) | 15 | 20·1 | –0·530 ± 0·080 | 0·624 ± 0·104 | 1·177 | Hann 6: 40·31–99·17 |
| Flowerhead disc diameter | 2 | 70·0 (60·6–73·1) | 13·1 | 17·6 | –0·163 ± 0·037 | 0·392 ± 0·054 | 2·405 | Hann 6: 40·31–99·17 |
| Ray ligule length | 2 | 60·9 (56·1–72·1) | 14·4 | 19 | –0·364 ± 0·049 | 0·280 ± 0·063 | 0·769 | Hann 6: 40·31–99·17 |
| Total flowerhead diameter | 2 | 60·6 (59·0–68·0) | 16·1 | 21·2 | –0·914 ± 0·124 | 0·910 ± 0·161 | 0·996 | Hann 6: 40·31–99·17 |
LG, linkage group.
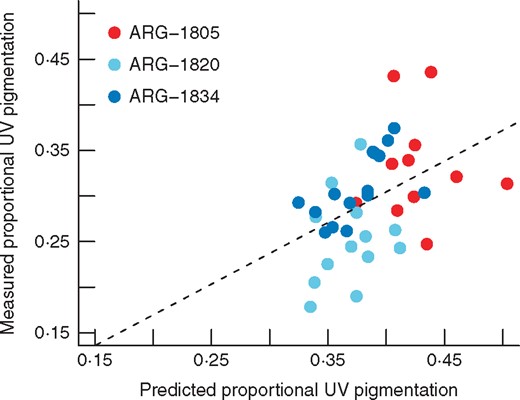
QTL-predicted proportional UV pigmentation versus observed values in individuals from three natural populations. ARG-1805 and ARG-1834 are the F2 mapping population parent accessions, while ARG-1820 is an accession with significantly smaller proportional UV pigmentation. The dashed line represents the linear model regression line (F1,32 = 6·21, P = 0·018, adj. R2 = 0·136).
In contrast, for each of UV bullseye size, disc diameter, ray ligule length and total flowerhead diameter we identify a single QTL on LG 2 that explains 17·6–21·2 % of the trait variance and is syntenic with the distal end of H. annuus chromosome 6 (Table 2; Supplementary Data Fig. S4). The allelic effect at this QTL varies from partially dominant (for total flowerhead diameter) to fully dominant (for UV bullseye size and ray ligule length) to overdominant (for disc diameter), with the parent ARG-1805 allele having a positive effect for each trait (Table 2; Fig. S4). These four traits were affected by flowerhead maturity, so we re-ran our QTL analyses with subsets of more mature flowerheads for which the trait values did not differ in post-hoc tests. There were no major differences in genetic architecture in these subset analyses. All four traits retained a single QTL (now all centred at exactly the same map location: cM 60·9 on LG 2), with slightly narrower confidence intervals, lower LODs and higher per cent variance explained (PVEs). Table S1 reports these subset QTL model results versus the full model results.
Natural populations
QTL-predicted values for proportional UV pigmentation are significantly correlated with observed measures of this trait in individuals from three natural populations, the two parental accessions and ARG-1820 (t = 3·008, d.f. = 37, P = 0·005; r = 0·443) (Fig. 4). However, the single large-effect QTL for UV bullseye diameter is not significantly predictive of this trait in the same individuals (t = 1·736, d.f. = 37, P = 0·091; r = 0·274).
Genotype frequencies of the two loci located directly under the QTL LOD peaks for UV bullseye diameter violate expected frequencies under HWE (Fisher’s exact P < 0·0001 for both loci; Supplementary Data Fig. S5). In contrast, five of the six loci for proportional UV pigmentation appear to be in HWE (Fisher’s exact P > 0·1; Fig. S5). The last locus for proportional UV pigmentation, QTL11@0·4, appears to violate HWE (Fisher’s exact P < 0·0001). However, this locus probably includes a null allele that is at high frequency in one of the four natural populations, ARG-1575, where 23/24 (0·96) individuals have no genotype calls (versus a mean missing proportion of 0·05 for this population at other loci and 0·31 for other populations at this locus; Fig. S5). If this locus does have a null allele (e.g. a large deletion), our observed genotype frequencies in natural populations are biased. We should note that we do not expect that this null allele is segregating in our mapping population: the proportion of missing data at this locus is 0·08 versus 0·11 across all 530 linkage map loci.
Candidate loci
Of the 44 144 annotated genes in the most recent H. annuus annotation (http://www.sunflowergenome.org), 33 393 had a blastp hit to the Arabidopsis thaliana protein database. Under the six QTL for proportional UV pigmentation, there were 8728 genes, of which 6385 had a blastp hit. We think it most probable that each QTL is represented by no more than a few genes, and so are not surprised that the annotated genes under these QTL showed no significant enrichment for genes belonging to the large MYB or UDP-glycotransferase families or containing WD40 or bHLH repeat domains (χ2 tests with Yates’ correction, α = 0·05 corrected for multiple testing; Holm, 1979). This leaves us with 63 MYB transcription factors, 45 UDP-glycotransferases, 66 genes with bHLH repeat domains and 534 genes with WD40 repeat domains under the six QTL for proportional UV pigmentation (in addition to the many other genes with and without annotations; Data available from the Dryad Digital Repository: http://dx.doi.org/10.5061/dryad.h21v2).
DISCUSSION
Floral colour patterning is an important ecological trait. A substantial body of research has examined variation in floral colour patterning and its genetic basis (e.g. Schwinn et al., 2006; Chiou and Yeh, 2008; Shang et al., 2011; Davies et al., 2012). Despite this, UV floral patterning has been relatively understudied for these same questions (although see Koski and Ashman, 2013; Brock et al., 2016; Sheehan et al., 2016). Given that visual perception in the UV spectrum is common in pollinator groups and UV patterning can affect pollinator behaviour, this is an important research gap to address. In the first study of its kind in Asteraceae, we describe the genetic architecture of UV floral pigmentation in the silverleaf sunflower, Helianthus argophyllus. We examine two UV floral pigmentation characters: the proportion of ray flower ligule length expressing UV-absorptive pigments (relative size; referred to here as proportional UV pigmentation) and UV bullseye diameter (absolute size), and explore how alleles linked to our identified QTL vary in wild populations.
The genetic architecture of proportional UV pigmentation
Proportional UV pigmentation is moderately heritable and is controlled by six intermediate-effect loci that interact additively in our mapping population. This relatively simple genetic architecture is still more complex than that reported in similar studies, two of which found a single large-effect locus probably underlain by an MYB transcription factor (Brock et al., 2016; Sheehan et al., 2016). In both of these cases, the parent genotypes differed by the presence/absence of UV bullseyes and were more distantly related than in the present study, either between species (Petunia; Sheehan et al., 2016) or between domesticated and wild populations (Brassica rapa; Brock et al., 2016). Similarly, a single Mendelian locus of unknown function and genomic location appears to control the presence or absence of a UV runway pattern in Mimulus guttatus (Peterson et al., 2015).
The observed genetic architecture for proportional UV pigmentation is also more complex than has been reported for other floral pigmentation traits. In Clarkia, petal spots are under the control of two epistatically interacting loci (Gottlieb and Ford, 1988), one of which was recently mapped to the promoter of the CgMyb1 gene (Martins et al., 2016). In Chilean Mimulus species anthocyanin patterning is seemingly controlled by a single Mendelian locus (Cooley and Willis, 2009). In Mimulus cardinalis and M. lewisii, carotenoid pigmentation is controlled by three large-effect QTL (Bradshaw et al., 1998). Similarly, nectar guide area differences between Iris fulva and I. brevicaulis are controlled by two moderate-effect QTL (Bouck et al., 2007). That the genetic architechture for proportional UV pigmentation is relatively more complex may reflect that these other traits have large or discrete differences across populations or species, rather than the continuous within-population variation we see in proportional UV pigmentation.
We have mapped these QTL to the closely related H. annuus genome, but we are not able to identify a short list of candidate genes under these regions due to their number and size. Under the 95 % Bayesian credible intervals for these QTL we find slightly less than 20 % of the genes in the most recent H. annuus annotation, about 75 % of which have blast-identified orthologues in Arabidopsis thaliana. Examining this gene list uncovers numerous genes with a plausible connection to flower patterning, from which we have compiled a long list of 708 candidates (members of the gene families and functional domains that have conserved functions in floral patterning; available as supplementary material). Considering the size of the syntenic regions and the number of genes on this list, fine mapping will be needed to reduce it to a tractable size.
Although we cannot identify specific genes, the correlation of QTL-predicted and measured proportional UV pigmentation in three natural populations (Fig. 4) suggests that these six SNP loci have wide applicability within H. argophyllus populations and are not limited to the specific cross we made, possibly due to close genetic linkage with the actual loci underlying this trait. The three natural populations span the native range of this species (Heiser et al., 1969). Further, the SNP loci closest to each QTL peak are variable within four natural populations (Fig. S5), suggesting that this trait has significant genetic variation upon which selection could act. Five of these loci do not violate HWE expectations, which indicates that they are probably not under selection in these populations, and the sixth locus includes a putative null allele that would bias our test of HWE. Some alleles (e.g. the ARG-1805 allele at the SNP closest to QTL 15@45·0) appear relatively rare, while others are at moderate frequency in all four populations (e.g. alleles at the SNP closest to QTL 4@60·8; Fig. S5).
UV bullseye size QTL co-localizes with flowerhead size and possibly flowering time QTL
Independently from proportional UV pigmentation, UV bullseye diameter is genetically controlled by a single large-effect QTL, a genetic architecture that is shared by our measures of flowerhead size: disc diameter, ray ligule length and total flowerhead diameter. The effect of the ARG-1805 allele at this QTL is partially to completely dominant, except for disc diameter where we observe overdominance (Table 2; Fig. S4). These measures of flowerhead size are strongly negatively correlated with flowering time in wild populations of H. argophyllus when grown in a common environment (Moyers and Rieseberg, 2016), although we note that this study did not examine floral UV patterning. As might be expected given a genetic architecture of the kind we observe for flowerhead size, flowering time in H. argophyllus is strongly bimodal, with two clear peaks of flowering (Moyers and Rieseberg, 2016). However, we do not observe this kind of distribution for UV bullseye diameter or our three measures of flowerhead size in our F2 population (Fig. 2). Instead, all four traits appear unimodal, suggesting either the presence of many small-effect loci that we were not able to detect in this study or a relatively large effect of the environment. It is possible that the proportional UV pigmentation QTL could have a small pleiotropic effect on UV bullseye size, given that the two traits are phenotypically correlated (Table 1). However, when we examine the ten next best multiple QTL models for UV bullseye diameter (which include up to ten additional QTL), we see only one QTL that co-localizes with a QTL for proportional UV pigmentation (QTL14@14·3, data not shown). The best model for UV bullseye diameter that includes this putative pleiotropic QTL has a penalized LOD of 8·452, which is < 0·1 % as probable as the QTL model we report here (only QTL2@60·9, pLOD = 11·485). A large environmental effect might account for the unimodal distribution of ray ligule length, which has a very low heritability in this study, but seems unlikely for the other traits with H2 from 0·22 to 0·57. We note that our estimates of heritability may be conservatively low, given that both parental populations are segregating variation at most QTL loci and our estimating method assumes that all variance in the parental population is due to environmental factors. The QTL 2@60·9 also does not significantly predict UV bullseye diameter in natural populations, which adds further evidence that the genetic basis of this trait may involve undetected small-effect loci or a large environmental effect. The poor fit of our predictive model may also result from a bi-allelelic single locus only allowing for three possible states (for the two homozygous and the heterozygous genotypes) when the trait is in fact quantitative, or from recombination in natural populations generating linkage equilibrium between our locus and the locus affecting the trait.
The two SNP loci closest to the UV bullseye diameter QTL peak both violate expectations under HWE: wild populations have high frequencies of alternative alleles (Fig. S5). We hypothesize that this locus or a closely linked locus may be under divergent selection among these populations. Alternatively, these populations might have not exchanged genes for some time due to physical barriers or other neutral processes, and these loci may have alternatively drifted to high frequencies in the absence of selection. Given that the six loci for UV ligule proportion are in HWE among these populations, we think that the first hypothesis is more likely. To underscore this, a recent study found evidence to suggest that a life history syndrome including flowerhead size, flowering time and a suite of other traits is under divergent selection in this species (Moyers and Rieseberg, 2016). As flowerhead size and UV bullseye diameter share a genetic architecture and are phenotypically correlated in our study, UV bullseye size may be another component of this life history syndrome and consequently under direct or indirect divergent selection.
Our UV bullseye and flowerhead size QTL co-localizes with a large-effect QTL for flowering time in H. annuus, which explains 7·6–36 % of the variance of flowering time across three studies (Burke et al., 2002; Wills and Burke, 2007; Baack et al., 2008). It is possible that this locus is conserved across the sister species, as the primary candidate gene Ha-FT1 (found on chromosome Hann6 at 58·6 Mb, syntenic with our QTL peak) functionally complements the major flowering time gene FLOWERING LOCUS T in Arabidopsis thaliana (Turck et al., 2008; Blackman et al., 2010, 2011). Given that UV bullseye diameter is genetically correlated with flowerhead size in our study, which is phenotypically correlated with flowering time in wild populations (Moyers and Rieseberg, 2016), we think that the hypothesis of a single, highly pleiotropic locus that controls both flowering time and flowerhead size, and consequently UV bullseye size, is worth pursuing in future research.
CONCLUSIONS
Although we might expect proportional UV pigmentation to be genetically correlated with UV bullseye diameter, the genetic architectures for the two traits are independent in this study. This result underlines that measures of proportion do not necessarily correlate with measures of absolute length. The QTL for UV bullseye diameter and the largest effect QTL for proportional UV pigmentation are on the same linkage group, but they do not overlap, with peaks separated by over 40 cM. This independence suggests that most of the variation in UV bullseye size in our population is due to changes in overall flowerhead size, and not changes in proportional UV pigmentation. It is possible we failed to detect small-effect pleiotropic QTL. However, given that proportional UV pigmentation and UV bullseye diameter are genetically independent, these traits could be fine tuned separately by selection. The pleiotropic effects on flowerhead size and possibly flowering time may make it difficult for selection to act on UV bullseye size directly. In the context of crop species, we note that proportional UV pigmentation could possibly be modified without affecting flowerhead size, a critical trait in domestic sunflowers. This assumes that the genetic architecture of these traits is conserved across the species and domestication boundaries, which has proved to be the case in other studies of Helianthus (e.g. Baack et al., 2008; Wieckhorst et al., 2010; Blackman et al., 2011). Further research is needed to confirm this, to determine how pollinators respond to variation in either of these traits in sunflower, and to pin down the specific genetic changes underlying the QTL we have identified.
SUPPLEMENTARY DATA
Supplementary data are available online at www.aob.oxfordjournals.org and consist of the following. Table S1: QTL model, QTL position, 95 % Bayesian credible interval, peak LOD score, per cent variance explained, the additive and dominance effects, the absolute value of the ratio d/a, and the H. annuus genome major syntenic region for each QTL for UV bullseye diameter, flowerhead disc diameter, ray ligule length and total flowerhead diameter. Figure S1: flowerheads and ray flower ligules photographed in the UV spectrum, demonstrating variation in UV pigmentation within and among Helianthus species. Figure S2: Helianthus argophyllus genetic linkage map created from 530 markers genotyped in 327 F2 individuals. Figure S3: Helianthus argophyllus genetic linkage map positions versus H. annuus genome physical positions for 412 markers that align against H. annuus chromosomal sequence. Figure S4: observed and predicted genotype effects of each QTL: first six rows of panels for the six proportional UV pigmentation QTL, then UV bullseye diameter, disc diameter, ligule length and total flowerhead diameter. Observed panels show individual data as well as each genotype class mean ± s.e. Predicted panels show hidden Markov simulated phenotypes for each genotype class based on observed values, allowing for genotyping errors and accounting for missing data. Figure S5: mosaic plots of QTL genotype frequencies in four natural populations for the two markers that map to the QTL peak for UV bullseye diameter and the closest marker to each of the six QTL for proportional UV pigmentation.
ACKNOWLEDGEMENTS
We thank Glenn Cole, Suzie Snyder and others at Pioneer for assistance with fieldwork and data collection, Jerold Chu for assistance with UV photography measurements, and Alexandra Paquet and Ada Roman for assistance with DNA extraction and GBS library preparation. We would also like to thank Pioneer Hi-Bred International, Inc. for allowing us to use field space and other resources at its Woodland, CA, campus. We are grateful to two anonymous reviewers who provided thoughtful comments on an earlier version of the manuscript. This work is part of the Genomics of Sunflower project, funded by the Genome Canada Applied Genomics Research in Bioproducts or Crops (ABC) competition, with co-funding from Genome BC.
LITERATURE CITED
Author notes
G. L. Owens and B. T. Moyers are co-first authors.
