


Abstract
Background and Aims In Costa Rica, coffee (Coffea arabica) plants are often grown in agroforests. However, it is not known if shade-inducing trees reduce coffee plant biomass through root competition, and hence alter overall net primary productivity (NPP). We estimated biomass and NPP at the stand level, taking into account deep roots and the position of plants with regard to trees.
Methods Stem growth and root biomass, turnover and decomposition were measured in mixed coffee/tree (Erythrina poeppigiana) plantations. Growth ring width and number at the stem base were estimated along with stem basal area on a range of plant sizes. Root biomass and fine root density were measured in trenches to a depth of 4 m. To take into account the below-ground heterogeneity of the agroforestry system, fine root turnover was measured by sequential soil coring (to a depth of 30 cm) over 1 year and at different locations (in full sun or under trees and in rows/inter-rows). Allometric relationships were used to calculate NPP of perennial components, which was then scaled up to the stand level.
Key Results Annual ring width at the stem base increased up to 2·5 mm yr−1 with plant age (over a 44-year period). Nearly all (92 %) coffee root biomass was located in the top 1·5 m, and only 8 % from 1·5 m to a depth of 4 m. Perennial woody root biomass was 16 t ha−1 and NPP of perennial roots was 1·3 t ha−1 yr−1. Fine root biomass (0–30 cm) was two-fold higher in the row compared with between rows. Fine root biomass was 2·29 t ha−1 (12 % of total root biomass) and NPP of fine roots was 2·96 t ha−1 yr−1 (69 % of total root NPP). Fine root turnover was 1·3 yr−1 and lifespan was 0·8 years.
Conclusions Coffee root systems comprised 49 % of the total plant biomass; such a high ratio is possibly a consequence of shoot pruning. There was no significant effect of trees on coffee fine root biomass, suggesting that coffee root systems are very competitive in the topsoil.
Introduction
Net primary productivity (NPP) is the sum of visible growth and litter production of above- and below-ground components (Roy et al., 2001). NPP is a key determinant of crop productivity and a highly relevant metric to assess the ‘limits to growth’ of human consumption (Meadows and Meadows, 2007; Running, 2012). Food systems contribute 19–29 % to global anthropogenic greenhouse gas (GHG) emissions and are likely to be profoundly affected by climate change. Therefore, approaches that integrate mitigation and adaptation strategies in agricultural systems are desperately required (Vermeulen et al., 2012). NPP is a useful indicator of the suitability of these strategies.
Nationally Appropriate Mitigation Actions (NAMA, 2014) were introduced recently as a mechanism to enhance mitigation and also adaptation to climate change (Lipper et al., 2014). Costa Rica implemented NAMA-Café in 2015 and declared its ambition to become the first carbon (C)-neutral country in 2021 and to lead global development of C-neutral coffee certification. Coffee (Coffea arabica) is a major export product in Costa Rica and in many developing countries; it provides livelihoods for tens of millions of people. The evaluation of above- and below-ground biomass, NPP and soil organic matter (SOM) in coffee plantations is thus an important component of the NAMA-Café strategy, allowing calculation of the baseline of C stocks and follow-up during the C-neutral certification of coffee farms. To date, the estimates of total biomass and NPP of coffee plantations are unsatisfactory as they do not consider the below-ground compartment, especially at depth, nor the spatial heterogeneity of coffee plots where coffee plants are grown in full sunlight or under the shade of trees (e.g. the nitrogen-fixing tree Erythrina poeppigiana, which enriches soil through the deposition of leaf litter). However, it is not known if shade trees reduce coffee plant biomass through root competition, and hence alter overall productivity.
Plant roots are an essential component of NPP that should be considered in projects seeking mitigation and adaptation to climate change. In contrast to the above-ground plant tissues, roots senesce directly in the soil matrix, and thus root litter-derived organic matter may be stabilized on soil minerals more efficiently (Cotrufo et al., 2013), either through incorporation into microbial biomass prior to stabilization or through the remaining litter mass (Pansu et al., 2009). Roots are thus major contributors to stable SOM build-up, especially in deep soil layers (Rasse et al., 2005). A better knowledge of total root biomass, productivity and turnover, including roots in deep soil layers, as well as the spatial heterogeneity induced by agroforestry, is essential to take account of long-term C dynamics and storage.
The biomass of perennial roots is usually measured using different types of excavations (Levillain et al., 2011), or estimated via allometric relationships based on stem basal area (Clark et al., 2001; Saint-André et al., 2005; Kenzo et al., 2009). In coffee agroforestry systems, plot structure and coffee management techniques are particularly complex (Charbonnier et al., 2013), because of the presence of trees, row effects, multiple seedlings per location, selective pruning of the unproductive shoots (approx. every 5 years, leaving only an aerial stump) or continuous replacement of dead coffee plants. Such management practices create high intra-plot heterogeneity. Therefore, it is necessary to devise or adapt techniques to estimate the root biomass of coffee plants. We propose an approach based on growth rings to assess age, annual radial growth and NPP of perennial parts, both above and below ground. From estimates of biomass and aerial growth parameters, NPP can be calculated and used as an indicator of the productivity of a plantation.
Fine roots have been estimated to stock around 5 % of the total atmospheric C pool, they have a high replacement rate (turnover) of about 100 % per year, and the ratio between root and whole plant NPP is around 33 % (Jackson et al., 1997). The sequential coring method (Persson, 1978) is commonly used to estimate the dynamics of fine root biomass (Fairley and Alexander, 1985) in superficial soil layers (< 30 cm). This technique can also take into account the decomposition rate of dead roots between two observation dates (Clark et al., 2001; Jourdan et al., 2008). In addition, sequential coring documents seasonal variations in biomass and necromass (i.e. dead biomass), thus allowing the calculation of fine root turnover on an annual basis.
Few data exist on coffee root biomass, especially with regard to the whole rooting profile (Padovan et al., 2015). The sequential coring method has been used to estimate shallow fine root NPP for coffee plants in Costa Rica (Schaller et al., 2003; van Kanten et al., 2005), but results have never been extrapolated to the whole rooting profile. Coffee plant roots may grow several metres into the soil, but below-ground estimations of NPP have focused only on superficial soil layers. We expect that coffee root biomass differs between shallow and deep roots, as do a number of functional traits (Prieto et al., 2015).
Our overall hypothesis was that the plot heterogeneity and the presence of shade-inducing trees in a coffee agroforestry system would affect coffee root biomass and thus NPP distribution at the plantation level. Within an agroforestry plot we assessed how tree presence, soil depth, position in a row, plant age and seasonality affected the distribution of total root biomass, fine root turnover, decomposition rates and estimates of NPP.
Our objectives were to: (1) estimate biomass and NPP of different root components of coffee plants, including fine, coarse and tap roots throughout the entire rooting profile; (2) understand the effects of shade-inducing trees on coffee root growth; and (3) determine the temporal and spatial variability in root biomass.
Materials and Methods
This study focuses on both perennial roots, i.e. tap, coarse (<10 mm) and medium (2–10 mm) roots, as well as ephemeral (fine <2 mm) roots (Fig. 1).
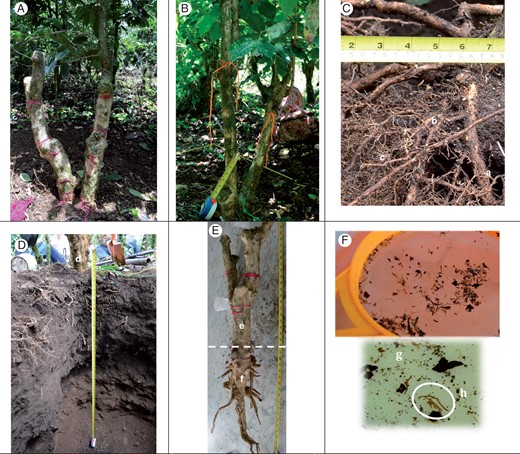
Accessing the coffee root system and aerial stump: (A) aerial stump with two fused aerial stumps; (B) aerial stump with three young resprouts on the right and two old resprouts on the left; (C) root categories separated into (a) coarse, (b) medium (c) and fine roots; (D) internal view of the shallow trench, i.e. excavated Voronoi polygon, to a depth of 1·5 m, where (d) is the aerial stump; (E) coffee stump separated into (e) aerial and (f) below-ground (taproot) components; (F) manual sorting of fine roots using a 0·5-mm sieve under tap water and zoom of the sieve showing (g) the organic debris (black) and (h) fine roots.
Study site
The study was conducted in the Central-Caribbean region of Costa Rica, in one of the largest coffee farms of the country (Cafetalera Aquiares, a Rainforest Alliance certified farm, situated at an altitude ranging from 750 to 1400 m). The farm is located 15 km from the Centro Agronómico Tropical de Investigación y Enseñanza (CATIE, Turrialba) and the coordinates of the experimental plot are 9·938°N, −83·729°W, at an altitude of 1000 m.
According to the Köppen–Geiger classification (Peel et al., 2007), the climate is tropical humid with no dry season and is strongly influenced by Caribbean climatic conditions (Sánchez-Murillo et al., 2015). Mean annual rainfall for the period 1973–2009 was 3014 mm. Monthly rainfall is usually lowest between February and April with less than 200 mm per month. The driest month is March, with a 10-year average of 123 mm, whereas the wettest month is December, with an average of 329 mm. More details on local climate are available in Gómez-Delgado et al., (2011).
Soils belong to the order of andisols (USDA-NRCS, 2005), originating from volcanic ejecta, having high allophane and organic matter contents (Kinoshita et al., 2014), very high infiltrability (Benegas et al., 2014) and a high proportion of large blocks, characteristic of volcanic mudflows. As weeds are frequently and severely controlled (chemically), the soil was assumed to be bare or covered mainly by aerial litter. Soil depth was 4–5 m, below which was bedrock.
The Aquiares farm was planted with coffee (Coffea arabica L., mainly ‘Caturra’) in the 1960s, with an initial planting distance of 1·11 m between plants along the row and 1·43 m between rows (inter-rows). Total plant density was 6300 seedlings ha−1, but only 5580 plants ha−1 remained in 2011, with two coffee stumps per location, often intertwined, resulting in composite plants. Plants are pruned every 5 years, and so shoot resprouts, leaves and fruits were not considered in our study.
Coffee plants do not typically undergo drought stress at our study site. We did not find any evidence of a reduction in pre-dawn leaf water potential during the drier months (unpubl. data), but growth ceased during the drier period, corresponding also to the minimum leaf area index (LAI). LAI fluctuated seasonally in the farm between 2·2 and 4·4 (Taugourdeau et al., 2014). To comply with the eco-certification criteria of the Rainforest AllianceTM (promoting tall trees to provide more habitats for biodiversity), shade was provided in the coffee plots since 2001 by growing Erythrina poeppigiana (Walp.) trees (Fabaceae), the most widely used shade-inducing tree in Costa Rican coffee agroforests. In 2010, trees had an average canopy height of 20 m and a planting density of 7·4 trees ha−1. The mean canopy projection was assessed on 570 ha by Taugourdeau et al. (2014) and was 15·7 ± 5·5 % (mean ± s.d.).
The farm was managed intensively, with nitrogen (N) fertilizers applied three times a year, up to 214 ± 44 kg N ha−1 yr−1 (2000–2012). As an indicator of overall productivity, green coffee yield averaged 1351 ± 347 kg ha−1 yr−1 between 1994 and 2013.
Biomass of perennial components
Our first objective was to build allometric relationships between the basal surface area at the stem base, or basal area at root collar (BAC: the independent variable), and the biomass of the perennial (woody) components of coffee plants, i.e. the aerial stump, tap, coarse (> 10 mm in diameter) and medium roots (10 mm < diameter < 2 mm) (Fig. 1).
BAC was calculated from an inventory of 697 coffee plants (Fig. 2) in the same plot (Charbonnier, 2013; Charbonnier et al., 2013). We measured the smallest and largest diameters of each stump and calculated the mean value for estimations of BAC. A representative sample (similar mean and spread of BAC – Fig. 2) of 12 plants, half with a single stump and the other half with two to three composite stumps, were selected for excavation of the root system at different locations (Fig. 3).
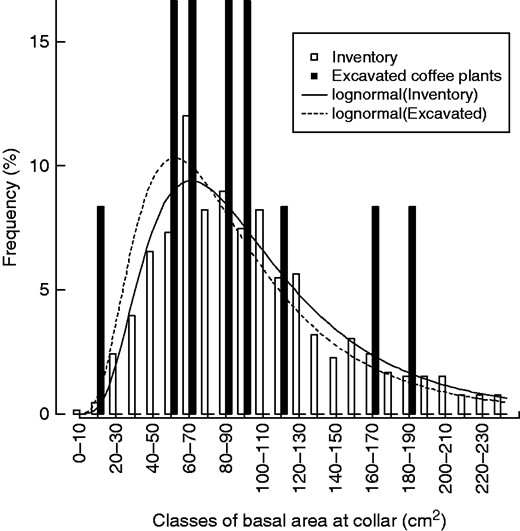
Frequency histogram of basal area at root collar (BAC, cm2) from an inventory at 697 locations (white bars) and for the 12 coffee plants chosen for root excavation and growth ring analyses (black bars). The selected plants for excavation covered 97 % of the inventory range. Lines indicate lognormal distributions fitted to the inventory frequencies (solid line) and the excavated plants (dotted line) using maximum likelihood. The BAC of excavated coffee plants possessed the same distribution as that from plants in the inventory (P = 0·84 and P = 0·55, respectively).
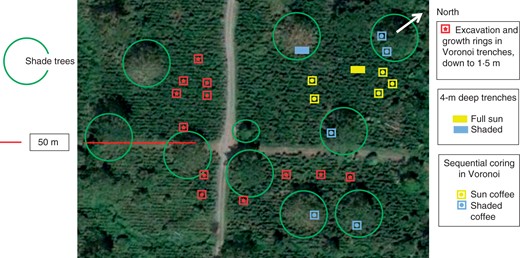
Image (Google Earth, February 2012) of the coffee agroforestry plot, with shade-inducing trees (Erythrina poeppigiana) and coffee plants (Coffea arabica). The exact position of shallow trenches, individuals used in growth ring analysis, sequential cores, and 4-m deep trenches is mapped. The ten individuals used for sequential coring were relocated every 4 months.
Root excavation in shallow trenches [0–150 cm].
We excavated roots from a quarter of the Voronoi polygon, i.e. a polygon defined by the half-distances between an individual and its neighbours (Snowdon et al., 2002, Levillain et al., 2011). In our study, this polygon corresponded to a rectangle of 1·59 m2 and included the row and the inter-row (Fig. 4). One assumption of our method is that all the roots of the sampled individual growing outside the polygon are compensated for by those from the neighbouring plants entering the rectangle.
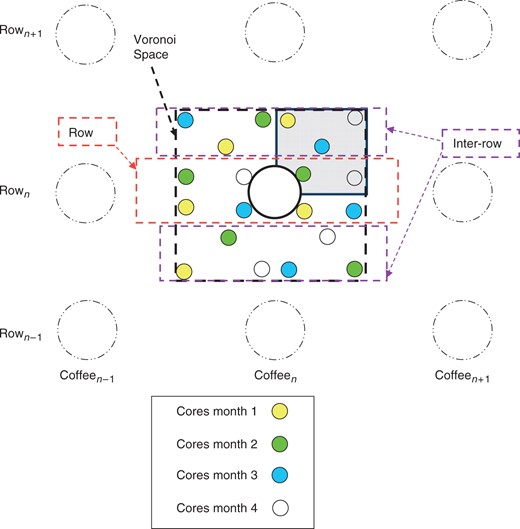
Elementary Voronoi spaces used to define the spatial sampling procedure during shallow (0–150 cm) root excavation. The Voronoi polygon (rectangle, dotted line) is defined as the half distance between the individual being studied and its neighbouring plants (dotted circles). The distance between coffee plants within a row was 1·11 m and the distance between rows was 1·43 m. The area of the Voronoi was 1·59 m2. During root excavation, 25 % of the Voronoi space (chosen randomly) was dug to a depth of 1·5 m deep (grey area), and root biomass was assessed. In the sequential coring experiment, five cores were sampled every month (one colour per month) inside the Voronoi space, of which two were in the row, and the remaining three in the inter-row. Each core was split into three layers (0–10, 10–20, 20–30 cm). To avoid over-coring, a new set of ten coffee plants was selected every 4 months for the sequential coring experiment.
We excavated one randomly chosen quarter of the Voronoi polygon around each of the 12 coffee plants to a depth of 150 cm and divided it into eight soil layers (0–10 cm and then every 20 cm to a depth of 150 cm, Fig. 4, grey shading). Soil was sieved with a 2-mm mesh and roots were removed from the soil and washed. Roots were sorted into root diameter classes and soil layers and stored at 4 °C in the laboratory. Roots were then oven-dried to a constant weight at 60 °C and weighed. This shallow biomass (0–150 cm deep) was thus representative of both the elementary space and the BAC size classes. Root diameter classes were thus also distinguished in both the row and the inter-row.
Rooting profiles in deep trenches [0– 400 cm].
To extrapolate results on root distribution obtained from the 12 shallow (0–150 cm) trenches (Fig. 3) to the entire rooting profile, we dug two trenches until no more roots were found, or the bedrock was reached (4 m deep in both cases). One trench was dug under coffee plants growing in full sun, and one beneath a shade-inducing tree (Fig. 3). Each deep trench was ‘T’-shaped vertically, the centre bar of the ‘T’ was 0·8 m2 and 4 m deep and the sides of the ‘T’ were 1·2 m2 wide and extended to a depth of 1·5 m each. The trenches were dug in the inter-row only to avoid damaging the coffee plants from the rows. Root biomass was obtained in 10-cm intervals to a depth of 4 m. The number and the diameter of each root impacting on the lateral walls (parallel to the row) were measured using an electronic caliper with a resolution of 10−2 mm. The results are expressed in biomass (g) and root area density (RAD, cm2 cm−2) per layer. As the correlations between root biomass per layer and RAD were not satisfactory (0·4 < R2 < 0·5, data not shown), RAD was only used to estimate the root distribution in the soil profile, and not as a predictor of root biomass. We assumed that there could be large differences in absolute root biomass between the row and inter-row, but that the relative distribution between soil layers would be fairly conservative. After checking the agreement of the relative distribution between layers in rows and inter-rows in the shallow trenches (0–150 cm), we extrapolated the root biomass obtained in the shallow excavations to the whole rooting depth (4 m). In the trenches, there were very few roots from Erythrina and, when detected, they were removed. The volume of stones in each layer was measured by the water displacement method.
Stump growth ring analysis.
We cut wood discs at the level of the root collar to determine if ring number was a proxy of plant age. From a previous study performed in a 12-year-old coffee agroforestry trial in Costa Rica (data not shown), we found that it was possible to determine coffee plant age by cross-dating growth rings, even though no marked seasons are present in a year. Discs were sanded and examined through a binocular magnifier (accuracy 0·2 mm) along the two shortest and the two longest radii. We found that the mean number of rings matched the actual age of the plantation (9–11 rings, although the earliest rings were hardly discernible). Hence, we confirmed that ring number was a convenient proxy of plant age, at least in conditions where coffee did not suffer from seasonal stress, such as drought. From coffee plants that were investigated in the shallow excavations, we used the same method to cross-date and measure ring number on ten discs (Fig. 3). We also measured the width of each ring (n = 920 rings analysed in total) and established relationships between ring width and plant age at the time of ring expansion or with regard to ring distance from the centre of the disc. Combined with allometric equations, these data allowed us to compute the biomass and the NPP of perennial components.
Assessment of fine root biomass, necromass and NPP with sequential coring
Sequential coring.
We focused on fine root biomass and necromass at a given month and changes in these two variables between two successive dates of sampling. The studied factors were ‘date of sampling’ (each month from April 2012 to July 2013), ‘depth’ (0–10, 10–20 and 20–30 cm), ‘effect of shade-inducing tree’ (shade-inducing versus full sun) and ‘distance to row’ (row versus inter-row).
We assumed (and later verified) that there was no relationship between BAC and fine root biomass in the top 30 cm of soil, fine roots being more related to leaf area, and independent of the perennial parts. We selected ten new coffee plants, five in full sun and five under shade-inducing trees (Fig. 3), with a BAC close to the mean BAC of the inventory (68·36 ± 8·92 cm2, mean ± s.d Fig. 2). An elementary space rectangle was drawn around each coffee plant, using the Voronoi methodology described previously (Fig. 4). The elementary space was subdivided into two: the row and the inter-row, occupying 40 and 60 % of the total soil surface area, respectively. Every month, five randomly distributed cores per coffee plant were taken, two in the row and three in the inter-row (Fig. 2). Every 4 months, ten new coffee plants were selected to avoid over-coring at the same site. We used a home-made root auger (8 cm diameter, 10 cm height and volume of 502·7 cm3), and separated roots from soil samples at depths of 0–10, 10–20 and 20–30 cm.
Soil core processing.
The soil cores were taken to the laboratory and stored at 4 °C until processed. Stones were removed and cores were washed with tap water before filtering in a sieve column with meshes of 2, 1 and 0·5 mm. Coffee roots were then carefully separated from those of Erythrina which were easily distinguishable, because Erythrina roots are soft, spongy and have a characteristic legume smell that coffee roots do not have. For NPP calculations it is necessary to differentiate between live and dead roots. Live coffee roots are white or suberized, hard and difficult to break (Persson and Stadenberg, 2010). When necessary, we examined root cross-sections under a light microscope because live roots have a white stele. The colour of dead roots ranges from brown to grey; roots are softer and easy to break. The stele is either absent or very dark (Persson and Statenberg, 2007). Dead roots are easily recognizable when they are located at the ends of root branches and represent a very small percentage of the total harvested roots (< 5 %). Fine roots were dried for at least 48 h in an oven at 60 °C and medium and large roots (taproots and rootstocks) remained in an oven as long as necessary to achieve constant weight (approx. 4 d). The roots were then weighed to obtain their dry mass (precision: 10−4 g).
Model development
NPP theory and approaches.
Modelling biomass and NPP of perennial parts using allometric equations.
The perennial biomass calculated between 0 and 150 cm was extrapolated to the whole rooting profile using the fraction of deep roots, i.e. those found below a depth of 150 cm (fDr). We also estimated the increase in perennial biomass after one year (NPPpc = ΔBpc), using the same frequency distribution and an increase in basal area corresponding to the addition of one growth ring.
Fine root decomposition.
Sequential coring.
NPP of fine roots was estimated using two methods of conventional computing: the ‘Max-Min’ (MM) method (McClaugherty et al., 1982) and ‘Decision Matrix’ (DM) (Fairley and Alexander, 1985).
An important advantage of MM is its lesser sensitivity to errors on the separation between fine root biomass and necromass. Changes in fine root biomass reflect the accumulated effect of root growth and mortality; MM does not account for mortality during growth, and therefore tends to underestimate root production.
Pfr,DM is obtained either by summing the differences in fine root biomass (ΔBfr) and necromass (ΔNfr) with the decomposition rate (Dfr), or by adding only the differences in biomass, depending on whether biomass and necromass increased or decreased (Jourdan et al., 2008):
- (7)
- (8)
- (9)
Results of fine root biomass obtained from shallow excavations (0–150 cm) and sequential coring methods were compared. All results were extrapolated over the entire rooting profile (4 m).
Statistical analysis
Allometric relationships between biomass in different coffee parts and BAC were established from simple linear regression. A regression through the origin (intercept=0) was used when calculating root biomass and NPP per BAC class and per ha, assuming biomass was zero at the start of plant growth. As expected, there was no significant relationship between the biomass of fine roots and BAC, so we simply used the mean value for estimating biomass, regardless of the age of the plant. Data are means ± standard error (s.e.).
Biomass and necromass of fine roots in the sequential coring experiment were analysed with a generalized linear mixed effects model. This analysis was performed on the complete data set, as well as on the depth-integrated data. Variables were sampling date (random effect variable, 16 sampling dates between April 2012 and July 2013), depth (continuous fixed effect variable, three depths), row/inter-row and sun/shade (factorial fixed effect variables). The biomass data were found to be gamma-distributed, while necromass data were zero-inflated with non-zero data also being gamma-distributed. This type of data can be treated with a two-step model that first fits a logistic model to the presence/absence of dead roots in the cores, and then fits a generalized linear model to the non-zero data (Stefánsson, 1996). The final model was selected based on model significance (P-values) and comparison of Akaike’s information criterion (AIC). Sun versus shade was not significant in all cases and therefore not retained in the final model. All calculations and statistical analyses were performed using the R software (R Development Core Team, 2014). Mixed effect generalized linear models were fitted using the lme4 package (Bates et al., 2014).
Results
Distribution of stem basal area at collar
The individuals chosen for root excavation and growth ring analyses were well within the range of stem basal areas measured in the inventory (Fig. 2). The parameter values corresponding to maximum likelihood in the log normal distributions were μ = 4·49 ± 0·02 and σ = 0·55 ± 0·02 for the inventory, and μ = 4·37 ± 0·17 and σ = 0·57 ± 0·12 for the excavated coffee plants. Kolmogorov–Smirnov and Mann–Whitney tests confirmed that the excavated coffee plants came from the same distribution as the inventory (P = 0·84 and P = 0·55, respectively). The R2 of the fit, based on cumulative distribution functions, was 0·99 for the inventory and 0·95 for the excavated plants.
Biomass and NPP along the whole rooting profile
Allometric relationships between root biomass in shallow trenches (0–150 cm) and basal area at collar.
The linear regressions obtained between BAC of coffee plants and the biomass of aerial stumps and perennial root components (tap, coarse and medium roots) all had a positive and significant trend (R2 ≥ 0·70, P < 0·001, Fig. 5). The best fit was obtained for the total biomass of all perennial parts (R2 = 0·90, P < 0·001, Fig. 5A). The height of the aerial stump as an explanatory variable did not improve the fit of the model and was therefore omitted. The relationship between BAC and fine root biomass was not significant (Fig. 5F;R2 = 0·02, P = 0·69), confirming our working assumption that fine root biomass is not dependent on either the basal area or the age of the stump. Nevertheless, the prediction of total root biomass, including fine root biomass, remained acceptable (Fig. 5E, R2 = 0·70, P = 0·001). The intercepts were usually different from zero, except for stump biomass (Fig. 5B) and perennial parts (Fig. 5A) but were forced through zero during the computation of biomass per ha.
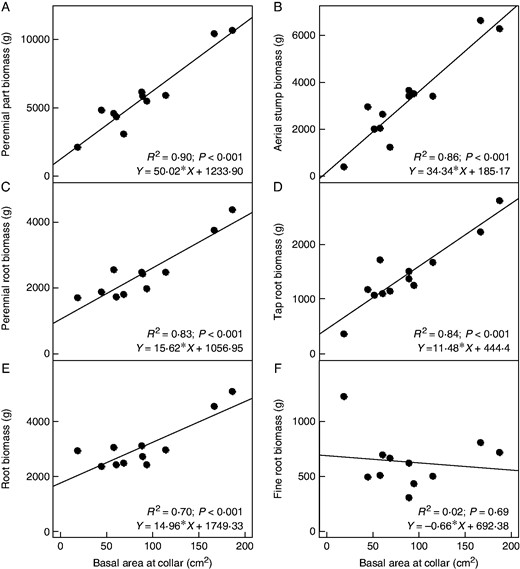
Relationships between basal area at collar (BAC: cm2) and biomass (g per full Voronoï space of 1·59 m2 × 1·5 m depth) of specific coffee components: (A) total biomass of four perennial components (aerial stump, tap, coarse, medium roots); (B) biomass of aerial stump; (C) total biomass of three components of perennial roots (tap, coarse, medium roots); (D) biomass of taproot; (E) biomass of total roots (tap, coarse, medium, fine roots); (F) biomass of fine roots. Intercepts were significantly different from zero, except for perennial parts and for aerial stumps. However, we forced the intercept to zero when calculating biomass and NPP per BAC class and per ha, assuming that biomass is zero at the start of growth of plants. Next, n = 12, except for A, C, E and F where n = 11 due to lost samples.
Extrapolation of biomass from shallow trenches to the whole rooting profile.
We extrapolated total root biomass (except for the taproot) obtained from the shallow trenches (0–150 cm) to the whole rooting profile (4 m) effectively colonized by roots (in both full sun and under shade-inducing trees, but with simplifications: inter-row only, and all categories of roots pooled for biomass estimations).
RAD decreased exponentially to a depth of 4 m, where the minimum RAD was observed (Fig. 6A). RAD increased between 1·5 and 2·5 m, corresponding to the layer where the stone volumetric fraction decreased significantly. This result was in agreement with an exponential decrease of RAD with increasing stone volumetric fraction (data not shown). Beyond a depth of 2·5 m, there were few fine roots and a maximum rooting depth was reached at 4·05 m in the trench under an Erythrina tree, i.e. where 100 % bedrock was reached. Rooting profiles were comparable in both the sunny and the shaded sites, although RAD was 1·4 times denser in the shaded location, and also deeper (2·75 m in the sun, 4·05 m in the shade) but no statistical tests could be performed as no replicates of deep trenches were carried out (the lack of replication was compensated for by the large volume of soil excavated and sieved). Therefore, in the following analyses, we took the mean distribution between the two profiles.
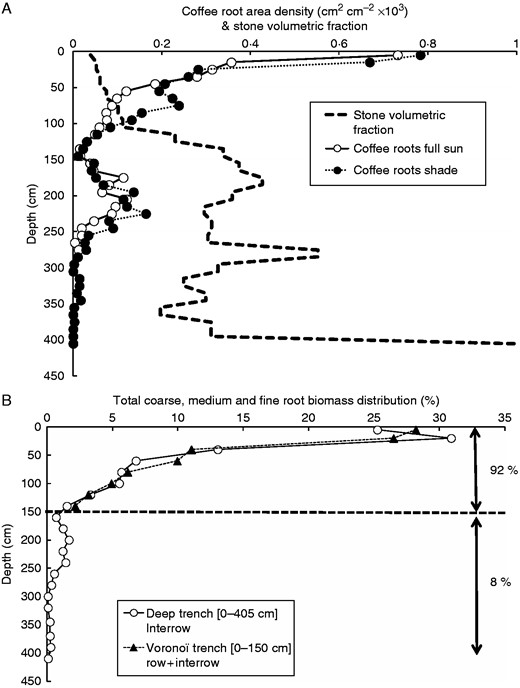
Coffee root profiles (0 – 405 cm). Root area density (A) measured to a depth of 4 m on the walls of two deep trenches (in full sun and in shade), and profile of stone volumetric fraction. Matching of the total root biomass distribution (B) per layer in shallow trenches (0–150 cm, row+inter-row; triangles) and deep trenches (0 – 400 cm, inter-row; circles). The cumulated root biomass (0 – 400 cm) was mostly found (92 %) in the upper 0–150 cm and only 8 % was present below 150 cm.
We found a very good agreement (Fig. 6B) between the distribution of total root biomass in the shallow trenches and the deep trenches to a depth of 1·5 m (i.e. the deepest point in the shallow trenches), indicating that an extrapolation of data to the whole rooting profile was reasonable. Total root biomass in coffee plants was preferentially distributed just below the surface with nearly 30 % of roots contained in the top 10 cm of soil and 55 % in the top 30 cm of soil. This amount was 87 % in the top 1 m and up to 92 % at 1·5 m. Therefore, only 8 % of the total root biomass was found at depth > 1·5 m.
Growth ring analysis.
The coffee plants possessed a maximum of 44 growth rings at the stem base (Fig. 7). Considering the inventory in Fig. 2, it is very likely that even more rings could be encountered in older plants in the plot. A major phase of coffee replanting at Aquiares farm occurred in the 1960s, and a growth ring study using plants of a known age showed that one growth ring was formed every year (data not shown). Therefore, we assume in the following that the rings were annual in our site and use ring number as a proxy for plant age. Ring width was also related to plant age (Fig. 7). Ring width increased significantly and positively from 1 to 12 years of age (R2 = 0·94; P < 0·001), before reaching a plateau with dispersed values at a width of 2·5 mm, the overall average in this age range. The distance of the ring to the centre of the disc (D, mm) was also significantly and positively linearly related (data not shown) to plant age (A) (D=2·078 × A – 4·925; R2 = 0·99; P < 0·0001). Therefore, we could relate annual ring width to plant age, stem radius or basal area at collar and use the age frequency from the plant inventory (Fig. 2) to compute the plot biomass (eqn 3). Thus, for plants of any age, we could estimate its biomass in the shallow trenches for every component using the linear relationships shown in Fig. 5. For fine roots only, we took the mean value of biomass and assumed it remained constant regardless of plant age. The biomass per ha in the top 4 m of soil (0–4·05 m) was computed according to eqn (3), using fDr = 8 % (as from Fig. 6B). This biomass computed per ha corresponded to the year of the inventory (2011).
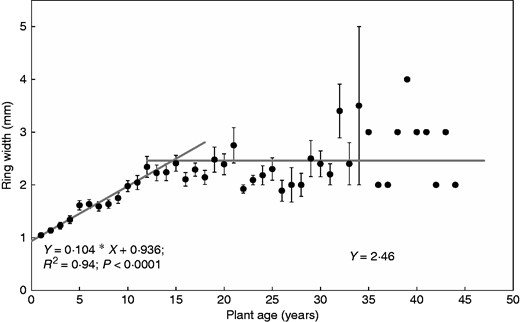
Relationship between mean growth ring width at stem base and plant age. Ring data from ten plants excavated from the Voronoi trenches: four ring widths were analysed par disc taken at the collar (n = 920 rings). Data are means of all rings of the same age (age max. = 44 years) and bars are standard errors. Ring number was assumed here to be a proxy for plant age, in conditions where coffee plants were growing in a humid climate.
NPP of the perennial components was then assessed as the difference of biomass between 2012 and 2011 (eqn 1), after the production of one new ring.
The study of growth rings, combined with the inventory of the distribution of basal area, also allows the evaluation of the average age of a plot, which was estimated as 28 years for our study plot, although the maximum age of coffee was probably higher than 44 years.
Fine root biomass, necromass and NPP estimated from sequential coring (0–30 cm)
Spatial variability.
The mean fine root biomass obtained by sequential coring (Table 1) within the 0–30 cm soil layer (1·58 ± 0·08 t ha−1) was consistent with, although lower than, that obtained from measurements in deep trenches (2·3 ± 1·2 t ha−1), in the same soil layers. Erythrina trees had no effect on the coffee fine root biomass or necromass (P > 0·5). However, there were significant differences in fine root biomass between row and inter-row, with twice as much fine root biomass within the row (2·37 ± 0·17 t ha−1) compared to the inter-row (1·05 ± 0·07 t ha−1). Fine root biomass decreased with soil depth over the first 30 cm, roughly following an exponential distribution (20 % mass reduction per 10 cm). Conversely, fine root necromass increased with soil depth at a rate of 9 % per 10 cm, although the effect was marginally significant (P = 0·09). Fine root necromass in the coffee row (0·027 ± 0·004 t ha−1) was higher than in the inter-row (0·016 ± 0·003 t ha−1). This result is consistent with the higher values of fine root biomass, although the difference is less pronounced.
Fine root standing biomass and necromass (expected values ± s.e.) of coffee plants classed by soil depth in soil (0–10, 10–20, 20–30 cm, grouped 0–30 cm), spatial position of coffee plants (in sun or shade) and location of cores (row or inter-row)
| Parameter | ||||||
|---|---|---|---|---|---|---|
| Soil depth (cm) | Position of plants | Location of core | Sampling date | |||
| Sun | Shade | Row | Inter-row | Plot mean | ||
| Fine root biomass (t ha−1) | 0–10 | 0·67±0·05 | 0·63±0·06 | 0·98±0·09 | 0·43±0·03 | 0·65±0·04 |
| 10–20 | 0·53±0·04 | 0·50±0·05 | 0·78±0·08 | 0·34±0·03 | 0·52±0·04 | |
| 20–30 | 0·42±07·04 | 0·40±0·04 | 0·62±0·07 | 0·27±0·03 | 0·41±0·03 | |
| 0–30 | 1·63±0·11 | 1·53±0·10 | 2·37±0·17 | 1·05±0·07 | 1·58±0·08 | |
| *** | n.s. | *** | *** | |||
| Fine root necromass (kg ha−1) | 0–10 | 0·007±0·002 | 0·006±0·001 | 0·008±0·002 | 0·005±0·001 | 0·006±0·001 |
| 10–20 | 0·007±0·002 | 0·007±0·002 | 0·009±0·002 | 0·005±0·001 | 0·007±0·001 | |
| 20–30 | 0·008±0·002 | 0·007±0·002 | 0·010±0·002 | 0·006±0·002 | 0·008±0·001 | |
| 0–30 | 0·021±0·004 | 0·020±0·003 | 0·027±0·004 | 0·016±0·003 | 0·021±0·002 | |
| n.s. | n.s. | *** | *** | |||
Results were from a mixed-effects generalized linear model, with date as a random effect and sun/shade and row/inter-row as fixed effects. Data are from monthly sequential coring samplings from April 2012 to July 2013. n = 2400 samples (800 per soil depth; 1600 per distance to tree: 640 in row and 960 in inter-row). n.s.: non-significant (P > 0·05); ***highly significant (P < 0·001). Plot mean was calculated from the row and inter-row expected values, assuming 2/5 (40 %) row and 3/5 (60 %) inter-row at the plot scale.
Temporal variability.
The biomass of fine roots within the 0–30 cm top soil layer ranged from 1·1 to 2·3 t ha−1 over the study period (Fig. 8) with highly significant differences between dates (P < 0·001; n = 2400). The maximum occurred in July–August 2012, which is the warmest and wettest period of the year. The minimum fine root biomass was observed in February 2013, corresponding to the drier period of the year. However, a lower root biomass was observed in 2013 compared to the same months in 2012. In absolute terms, the soil layer where root biomass fluctuated most over time was also that with a higher biomass, i.e. the 0–10 cm layer, ranging from 0·5 to 1·0 t ha−1 whereas the other two layers (10–20 and 20–30 cm) varied less, around 0·5 t ha−1. Nevertheless, relative values (dividing by the mean value for each layer) showed that the fluctuations were quite similar.
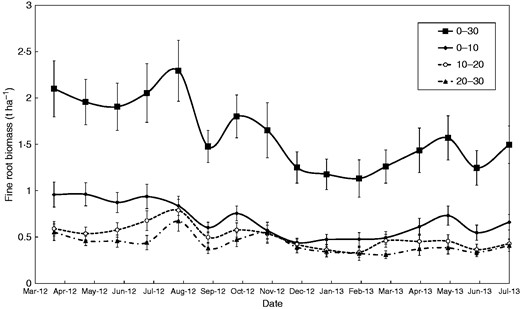
Fine root biomass dynamics of coffee plants estimated by sequential coring over a 15-month period classified by soil depth (0–10, 10–20, 20–30 cm and all classes pooled together in 0–30 cm). Values are means ± s.e. The ‘date’ effect was highly significant (P < 0·001, see Table 1), n = 2400.
Fine root necromass fluctuated significantly over the study period (data not shown) with values ranging from 0·01 to 0·09 t ha−1, with an average of 0·021 ± 0·003 kg ha−1 (Table 1), i.e. nearly two orders of magnitude lower than live biomass.
Fine root decomposition rate.
Fine roots decomposed at a rate of k = 0·017 d−1 (P < 0·001, Rf = 54 %, R² = 0·98; n = 24), k being the decomposition rate of the decomposable fraction and Rf the refractory fraction (no visual decomposition in 6 months). At this rate, 50 % of the decomposable fraction (1 − Rf) was still remaining after 40 d of decomposition in the field and close to 10 % remained after 4 months.
Fine root net primary productivity, turnover and lifespan.
NPPfr differed little between both computation methods: ‘Decision Matrix’ or ‘Max-Min’ (Table 2). The DM approach, which integrated mortality and decomposition rate, yielded somewhat higher production estimates (2·04 t ha−1) than MM (1·58 t ha−1). With regard to ‘distance to row’, NPPfr was more than twice as much in the row than in the inter-row: 3·15 t ha−1 in the row versus 1·30 t ha−1 in the inter-row with DM and 2·26 t ha−1 versus 1·13 t ha−1, respectively, with MM method.
Fine root net primary productivity (NPPfr), turnover and lifespan of coffee plants calculated according to different models (‘Decision Matrix’ or ‘Max-Min’)
| Method | Soil layer (cm) | NPPfr (t ha−1 yr−1) | Fine root turnover (yr−1) | Fine root lifespan (yr) | ||
|---|---|---|---|---|---|---|
| Row | Inter-row | Stand mean | ||||
| Decision matrix | 0–10 | 1·23 | 0·45 | 0·76 | 1·17 | 0·85 |
| 10–20 | 0·80 | 0·47 | 0·60 | 1·16 | 0·86 | |
| 20–30 | 1·11 | 0·39 | 0·68 | 1·65 | 0·61 | |
| 0–30 | 3·15 | 1·30 | 2·04 | 1·29 | 0·77 | |
| Max-Min | 0–10 | 1·00 | 0·40 | 0·64 | 0·98 | 1·02 |
| 10–20 | 0·67 | 0·39 | 0·50 | 0·97 | 1·03 | |
| 20–30 | 0·59 | 0·34 | 0·44 | 1·08 | 0·93 | |
| 0–30 | 2·26 | 1·13 | 1·58 | 1·00 | 1·00 | |
Data were from the sequential coring method in the 0–10, 10–20 and 20–30 cm soil layers and pooled data for 0–30 cm. NPPfr data were compared according to the position in a row or inter-row. Plot mean refers to the overall plot average, assuming 2/5 (40 %) row and 3/5 (60 %) inter-row at the plot scale. Statistics are not possible using these methods, so only averages are shown.
Fine root turnover rates ranged from 0·97 to 1·65 yr−1 depending on the computing method and soil depth. Fine root lifespan (the inverse of the turnover rate) varied from 0·61 to 1·03 years (Table 2). Fine root turnover rates and lifespan computed by both MM and DM methods were similar.
Partitioning biomass and NPP
Biomass and NPP partitioning of the coffee plants (shoot resprouts excluded) expressed per ha and extrapolated to the whole 0–400 cm profile are presented in Table 3. The biomass was equally distributed between aerial stumps (22·52 t ha−1) and below-ground parts (18·34 t ha−1). Below ground, half of the biomass was in the taproot (9·66 t ha−1). Fine root biomass estimated by sequential coring over an entire year (Bfr, eqn 2) was 2·29 t ha−1, representing 12 % of the total below-ground biomass. For fine roots, a comparison is proposed between biomass estimated by shallow excavations (one date of sampling only, 0–150 cm extrapolated to the whole profile) or by sequential coring (0–30 cm extrapolated to the whole profile, one measurement per month). The shallow excavations indicated a consistent fine root biomass of 3·81 t ha−1, but considering the large fluctuations of Bfr (Fig. 8), we assumed that sequential coring was a more reliable estimate, being a time-integrated value.
Biomass and net primary productivity (NPP) of coffee (shoot resprouts not included) calculated for year 2011
| Component | Biomass[0–4m] (t ha−1) | NPP[0–4m] (t ha−1 yr−1) |
|---|---|---|
| Tap root | 9·66 (53 %)* | 0·78 (18 %)* |
| Coarse roots | 2·09 (11 %)* | 0·17 (4 %)* |
| Medium roots | 4·30 (23 %)* | 0·35 (8 %)* |
| Total for perennial roots | 16·04 (88 %)* | 1·30 (31 %)* |
| Fine roots (shallow trenches) | 3·81* | n.m. |
| Fine roots (from coring) | 2·29 (12 %)† | 2·96 (69 %)† |
| Total for below ground | 18·34 (100 %)*† | 4·26 (100 %)*† |
| Aerial stumps | 22·52* | 1·83* |
| Total without resprouts* | 40·86*†‡ | 6·09*†‡ |
Data were extrapolated to the total root profile (0–4 m). Biomass data for fine roots was compared between the two methods used (shallow trench excavations and sequential coring): in both cases, data were extrapolated to a depth of 4 m. Percentages are given respective to total belowground biomass, using fine root results from the sequential coring method only (assumed to be more representative on a per hectare basis). n.m. = not measured.
*Estimated from allometric relationships using root data from shallow trenches (0–150 cm) and deep trenches (150–400 cm), ring width, deep trenches for extrapolation to whole profile (92 % of biomass in the 0–150 cm layers) and frequencies of BAC from the plant inventory.
†Estimated from sequential coring (decision matrix method) and deep trenches for extrapolation to whole profile (55 % of biomass in the 0–30 cm layers).
‡Excluding ephemeral above-ground organs (resprouts, leaves, flowers, fruits).
NPP of perennial components (NPPpc) was distributed by about one-third in the aerial stump (1·83 t ha−1 yr−1) and two-thirds in the below-ground parts (3·43 t ha−1 yr−1). NPP of fine roots (NPPfr) was 2·96 t ha−1 yr−1, i.e. 69 % of below-ground NPP. The taproot represented 0·78 t ha−1 yr−1, i.e. 18 % of the below-ground NPP.
Discussion
A new allometric tool for coffee perennial components
Assessing root biomass is usually complex, so allometric models of below-ground components are a promising alternative to time consuming fieldwork and can also be used to screen root biomass over large areas. Allometric models can be used to, for example, support the baseline for NAMA certifications or Intergovernmental Panel on Climate Change (IPCC) evaluations, where root biomass is usually not taken into account. The below-ground component is crucial in small trees like coffee plants that are coppiced and where perennial roots are major C storage organs. Thus, we developed allometric equations to complement the few existing relationships for the aerial parts of coffee plants (Segura et al., 2006; Charbonnier, 2013). Allometric equations have been shown as efficient for predicting below-ground biomass of mature forests because the method is quick, simple and non-destructive (Saint-André et al., 2005; Segura et al., 2006; Kenzo et al., 2009). We demonstrated here that it can also be applied to stands of coffee plants, despite inherent technical complications brought about by diverse management practices (e.g. several plants at one location, fused stumps and coppicing). Linear regressions satisfactorily predicted the biomass of perennial components, although intercepts were significantly greater than zero, except for the aerial stump and for perennial components. This anomaly may have arisen due to estimates in locations containing young plants that had been used to replace dead plants: it is possible that the neighbouring older plants developed roots in the non-occupied soil volume, thus biasing the linear relationship at lower values. Therefore, this factor may have induced an error in the allometric relationship, explaining why we chose to force the intercept through zero when calculating biomass and NPP.
Deep root biomass in heterogeneous agroforestry conditions
Fine root biomass.
In our study, fine root biomass amounted to 2·29 t ha−1 estimated from the sequential coring method (taking into account temporal variability). In tropical evergreen forests, Jackson et al. (1997) found fine root biomass up to 3·30 t ha−1, and in temperate broadleaved and deciduous forests, Nadelhoffer et al. (1985) and Cox et al. (1978) estimated it in a range of 2·70–8·00 t ha−1. We estimated that 75 % of fine root biomass of coffee plants was in the top 70 cm of soil, similar to Siles et al. (2010), who found that 75 % of biomass was located in the upper 60 cm in a coffee plantation also in Costa Rica. However, other studies found that the percentage of coffee fine root biomass was higher in the upper soil layers, possibly because deeper roots were not measured in these studies (see Table 4 for a literature review).
Literature review of coffee (Coffea arabica L.) root distribution and biomass according to soil depth sampled and sampling method
| Study site | Sampling method | Soil sampling depth (max.) (cm) | Root distribution (%) | Root biomass (t ha−1) | Reference(s) |
|---|---|---|---|---|---|
| Amani, Tanzania | Full excavation | 60 (150) 406 | 56 | – | Nutman (1933a, b, 1934) |
| Kenya | Partial excavation | 270 | 100 | – | Trench (1934) |
| Catalina, Puerto Rico | Full excavation | 30 (50) 91 | 95 | – | Guiscafré-Arrillaga and Gomez (1938, 1940, 1942) |
| Campinas, Brazil | Full excavation | 30 (300) 250 | 70 | – | Franco and Inforzato (1946) |
| Chinchina, Columbia | Core sampling (0.3 × 0.3 m) | 10 (160)160 | 47 | – | Suarez de Castro (1953) |
| 20 (160) | 69 | – | |||
| 30 (160) | 90 | – | |||
| 70 (160) | 98 | 0·53 | |||
| Veracruz, Mexico | Partial excavation | 20 (110) 110 | 44–58 | – | Garriz (1978) |
| (8.3 %) | 110 (110) | 100 | 14·90 | ||
| Miranda State, Venezuela | Core sampling (0.5 × 0.5m) | 10 (50) | 33* | Cuenca et al. (1983) | |
| 30 (50) | 73 | – | |||
| 50 (50) | 100 | 4·30 | |||
| Chipinge, Zimbabwe | Full excavation | 50 (300) 350 | 57 | – | Cassidy and Kumar (1984) |
| Juan Viñas, Costa Rica | Auger sampling* | 10 (40) | 40 | – | Schaller et al. (2003), Van Kanten et al. (2005) |
| San Pedro de Barva, Costa Rica | Auger sampling* | 60 (100) 100 | 75 | – | Siles et al. (2010) |
| 100 (100) | 100 | 9·30 | |||
| Masatepe, Nicaragua | Root impacts | 30 (200) 200 | 51 | – | Padovan et al. (2015) |
| Trench wall | 170 (200) | 100 | – | ||
| Aquiares, Costa Rica | Auger and | 50 (405) 405 | 72 | 13·20 | This study |
| Voronoi trench | 100 (405) | 87 | 15·95 | ||
| 110 (405) | 89 | 16·30 | |||
| 405 (405) | 100 | 18·34 |
The age of plants varied between studies, and ranged from 7 to 40 years. The maximum depth of soil sampling is indicated in parentheses. The maximum rooting depth is underlined when available.
*Fine roots only (ϕ < 1mm).
†Auger ϕ =8cm.
We observed a significant increase in fine root biomass between 1·5 and 2·5 m depth, which is unusual in a rooting profile, given that the global tendency of this parameter is a strong decrease from 30 cm downwards (Schenk and Jackson, 2002). This phenomenon could be explained by the change in physical soil properties such as a rapid decrease in the volumetric stone fraction within the same soil layer (Fig. 6). Another explanation could be the change in the chemical properties and nutrient accumulation in deeper soil layers. A previous study performed in Costa Rica showed that nitrate content increased significantly from topsoil downwards, reaching a maximum at 2 m (Harmand et al., 2007). Lysimeters installed at that depth in the same site did not indicate high concentrations of in the soil solution or groundwater, indicating that adsorption was particularly high in the subsoil at that depth. Soil mineral analyses revealed a high content of positively charged mineral surfaces at 2 m (Harmand et al., 2007), which may explain the greater root proliferation at these depths.
With regard to the temporal variability of fine root biomass we found major fluctuations, ranging seasonally by a factor of two. Fine root biomass estimated through sequential coring (0–30 cm), and scaled up to the whole rooting profile at stand level (2·29 t ha−1), was lower than that estimated via shallow excavations using Voronoi polygons (3·81 t ha−1). Integrating the temporal variability is a clear advantage of the sequential coring method over trench excavations and could explain the difference we obtained between the two methods. We encountered higher values of fine root biomass during the wet months, i.e. periods where LAI was also higher (Taugourdeau et al., 2014). We observed that the lowest value of fine root biomass was observed in February, which is the driest month of the year and also corresponds to the minimum LAI. In addition, a decrease in fine root biomass in September corresponded to the driest month within the rainy season. Hence, there appears to be a certain synchronicity between leaf and fine root dynamics, which is possibly affected by the fruiting period (the harvest period ranges from August to January) and its biennial pattern. Fine root dynamics are therefore important to consider when adjusting schedules of fertilizer application, due to possible high leaching rates when roots are less numerous or less active.
In the top 30 cm of soil, we found a clear effect of distance to the row with more than twice as much coffee fine root biomass within the row compared to within the adjacent inter-row. Similar results were also found in the top 20 cm and above the depth of 1·0 m in comparable soil conditions in Costa Rica (Table 4). This distribution could be a consequence of fertilizer being distributed close to the stump, creating heterogeneity in the soil, and increasing fertility along the row. An increase in soil fertility in the row would have several consequences for the components of SOM build-up (fine root litter, decomposition and stabilization), soil water content and biology, soil compaction and respiration. Our results also show that the inter-row remains under-exploited in terms of root colonization. Charbonnier et al. (2013) reported that 30 % of the incoming light to the plot reaches the soil, mostly in the inter-row. The inter-row could therefore be managed more intensively, in order to exploit these important but neglected resources.
Surprisingly, we found no effects of Erythrina trees on fine root biomass in the top 0–30 cm of soil, indicating that root competition was low. Charbonnier (2013) reported that NPP of coffee resprouts was similar in full sun or under shade, but that biomass allocation was biased toward the above-ground vegetative component when grown in shady conditions. Surprisingly, Schaller et al. (2003) and van Kanten et al. (2005) even showed that the presence of coffee fine roots induced shallower (0–10 cm depth) distributions of fine roots in shade-inducing trees (Terminalia or Eucalyptus) in the same region of Costa Rica, although competition with these trees may be stronger than with Erythrina. However, a study performed in a coffee agroforestry system in Nicaragua showed that tree roots occupied deeper soil layers, beneath the roots of coffee plants (Padovan et al., 2015). Conversely, Siles et al. (2010) did not observe any effects of shade-inducing trees (Inga densiflora) on the fine root biomass of coffee plants in Costa Rica. Therefore, the fine root system of coffee plants dominates in surface layers, even when grown in conjunction with shade-inducing trees, regardless of whether the trees are pruned (most studies) or not (this study).
Deep root biomass.
Difficulties in harvesting roots, particularly deeper in the soil, may lead to severe global underestimations of root mass and productivity in plantation or forest ecosystems (Canadell et al., 1996). Consequently, depths are not standardized, but the depth selected in a given study is expected to capture practically all roots. In our study, no roots were observed below 4·05 m because bedrock was continuous below this depth (Fig. 6). This result confirmed those from the first complete description of Coffea arabica root distribution performed in Tanganyika (former Tanzania) by Nutman (1933a, b, 1934) where the maximum rooting depth was observed at 4·06 m (Table 4). Since then, most studies on the distribution of fine roots of coffee plants have been limited to the top soil (Table 4) where most fine roots were distributed (Cuenca et al., 1983; Cassidy and Kumar, 1984; Schaller et al., 2003; van Kanten et al., 2005; Siles et al., 2010). Finally, it has been reported that the maximum rooting depth of coffee plants can be averaged at around 300 cm (Barros et al., 1999). Obviously, the maximum rooting depth depends on the coffee variety, its origin (seed, grafting or somatic embryogenesis) and soil chemical and physical characteristics, such as volumetric stone fraction (our study).
We showed that the total root biomass of a coffee root system (18·34 t ha−1) represents almost the same amount as the above-ground perennial organs (aerial stumps: 22·52 t ha−1). This below-ground biomass is greater than what was found in other studies that used destructive methods without taking into account the whole below-ground component and especially the taproot. Using an auger core in Venezuela, Cuenca et al. (1983) measured 4·3 t ha−1 at a depth of 0–0·5 m, but in Costa Rica, Siles et al. (2010) measured 9·3 t ha−1 and in Mexico, Garriz (1978) estimated 14·9 t ha−1 at a depth of 0–1·1 m (Table 4). With regard to the distribution of coffee root biomass along the soil profile, our results showed that 30–55 % of total root biomass was found in the upper 10–30 cm of soil, in agreement with Schaller et al. (2003), who found that 40 % of total root biomass was concentrated within the upper 10 cm. Although total fine root biomass of coffee plants in our study (18·34 t ha−1) was similar to other tropical plantations also assessed with the Voronoi method, for example 16-year-old oil palm (Elaeis guineensis) in Ivory Coast with 25·4 t ha−1 (Jourdan and Rey, 1997), 20-year-old coconut (Cocos nucifera) in Vanuatu with 10·8 t ha−1 (Navarro et al., 2008), 6-year-old Eucalyptus in Congo with 19·9 t ha−1 (Saint-André et al., 2005), 5-year-old Eucalyptus in Brazil with 27·5 t ha−1 (Laclau et al., 2013) and 13-year-old rubber tree (Hevea brasiliensis) in Thailand with 11·5 t ha−1 (Chairungsee, 2011), it is low compared to tropical rainforests (70–100 t ha−1; Grace et al. 2001). Coffea arabica is a shade-tolerant plant, originating from eastern Africa where it grows within the forest and its functional traits are characteristic of shade-adapted plants, notably low photosynthetic and growth rates. The cultivar used in this study (‘Caturra’) is a dwarf variety and the pruning frequency was quite high (approx. every 5 years), so a high fine root biomass was not expected.
To calculate an accurate root/shoot ratio, estimates of the whole-plant biomass (above and below ground) are required. Shoot biomass is not detailed in our results, because specific methods are required to account for the dynamics of the shoot resprouts after coppicing and their intra-plot heterogeneity (Charbonnier, 2013). When including the ephemeral above-ground components (resprouts, leaves, flowers, fruit), the total coffee plant biomass amounted to around 55 t ha−1, with 49 % of below-ground parts and 29 % of perennial roots, higher than the reported 20 % of perennial roots by (Siles et al., 2010). Moreover, in that same study, the root/shoot ratio was assessed at 40 % (49 % in our study). In tropical forests, Jackson et al. (1997) and Deans et al. (1996) reported root/shoot ratios between 20 and 33 %, consistent with 30 % previously reported (Van Noordwijk et al., 1996; Canellas Rey de Vinas and San Miguel Ayanz, 2000). Coffee plants are pruned approximately every 5 years, possibly creating an imbalance to the benefit of the aerial stump and below-ground perennial components, and a very high root/shoot ratio for older ages. Thus old coffee is clearly much out of this range and this is probably due to its management (coppicing). We conclude that the root system is very large in older coffee plantations, as compared to the development of productive resprouts. A proportionally large root system might bring some advantages in terms of resistance to root diseases, such as nematodes, or tolerance to drought, being able to explore a very large volume of soil. It might also be considered as an advantage for grafting new varieties on old stumps to resist drought for instance. A strong root system is probably an advantage also for mobilizing the reserves required at the time of resprouting. However, pruning might bring some imbalances to the plant’s carbon budget, due to a high proportion of photosynthesis going to autotrophic respiration, and the carbon use efficiency of old coffee plants could be low compared to younger plants. The growing imbalance between vegetative and reproductive parts during plant ageing could also affect yield.
Growth ring analysis
Recently, Pereira et al. (2014) described precisely the anatomical structure of wood and dark growth rings of coffee plants, but to our knowledge, there are no growth ring studies available to date.
In our study, we observed that ring width stops increasing linearly at about 12 years old, typical of juvenile rings in many woody tree and shrub species. This transition could also possibly correspond to the age of stabilization of biomass in the compartments subjected to pruning. Moreover, ring width varied around 2·5 mm yr−1 from 12 to 44 years old, indicating a steady and large perennial biomass accumulation until 40 years or even more. Indeed, a fairly constant ring width means an increasing allocation to the perennial compartments (increasing NPP of aerial stumps, tap and coarse roots). This is perhaps related to the fact that fruit production decreases with age: competition between vegetative and reproductive parts would progressively become favourable to the growth of perennial compartments, to the detriment of fruit production. Indeed, replanting is generally programmed between 20 and 40 years after planting. A coffee growth allocation model would allow testing such questions.
Growth rings, combined with the inventory of the distribution of basal area, also allowed us to calculate the average age of a whole plot. We estimated an average plant age of 28 years for our plot. The partitioning of a given plot into age classes and the overall demography of the plot should depend on parameters such as year after planting (normally after a clear-cut and extraction of remnants), mortality per age classes and rate of replacement of dead plants. Characterizing plot average age and cohorts could be very useful to estimate plot vigour and productivity, or to standardize comparisons that are usually made between plantations, or even to evaluate the actual market value of a plantation. It could also be used to determine the optimum time to apply the rotation.
The study of growth rings should allow us to compare historical growth, according to soil and climatic conditions and management, and to look for correlations with fruit production. Alternatively, it would be interesting to study δ13C in growth rings of coffee, and link results to the efficiency of water use, especially in dry areas (Gessler et al., 2014),
Below-ground NPP, root turnover and decomposition
Below-ground NPP amounted to 4·26 t ha−1 y−1, i.e. around 24 % of total coffee plant (NPPr/NPP – calculated using unpublished results of NPP, F. Charbonnier, pers. comm.), similar to that of Cocos nucifera plantations (5·0 t ha−1 yr−1, Navarro et al., 2008). In tropical broadleaved evergreen forests, Gower et al. (1992) estimated a much higher range, between 10 and 40 %. The major resource allocation to the below-ground component in coffee plants could be a consequence of the high fertilization rates used, which promote above- rather than below-ground productivity.
We used measurements of necromass in our calculations of NPPfr, which results in a more accurate estimation (Brunner et al., 2013). Even if it is difficult to distinguish dead root fragments from live fragments (Vogt et al., 1998; Persson and Statenberg, 2007; Persson and Stadenberg, 2010), in coffee plantations, the sorting of live and dead biomass can be performed quite easily. Other uncertainties in the estimation of NPPfr arise from the choice of calculation method that can significantly influence the outcome (Hendricks et al., 2006). In our study, we compared two of the most commonly used methods (Brunner et al., 2013), the Decision Matrix (DM) and Max-Min (MM) methods. Our results showed no major differences in NPP between these two methods, with higher values for DM, as expected, as the MM method can largely underestimate fine root production, as often reported (Lehmann and Zech, 1998; Nadelhoffer, 2000; Hendricks et al., 2006; Jourdan et al., 2008). Brunner et al. (2013) recently summarized the results of studies on NPP in European forests by comparing DM and MM methods: estimates of NPP of fine roots were doubled when using DM. However, DM requires a higher number of variables, including root necromass and decomposition rate; MM could be more useful if necromass measurements or estimations are not available or if large errors on the calculation of total necromass are suspected. DM and MM are both flawed and are particularly sensitive to the options chosen. In addition, both methods provide only a single annual NPP estimation of fine roots and therefore do not allow for statistical comparisons (i.e. among plots, or between sites).
Using DM, we calculated NPPfr of 2·96 t ha−1 yr−1 for the whole rooting profile (4 m). NPPfr in the top 0–30 cm was 2·04 t ha−1 yr−1, i.e. around twice as much as for other perennial tropical trees [Eucalyptus in Brazil: 1·12 t ha−1 yr−1; Jourdan et al. (2008), Gliricidia in Ivory Coast: 1·1 t ha−1 y−1; Schroth and Zech (1995) or Acacia in northern Kenya: 0·95 t ha−1 y−1; Lehmann and Zech (1998)]. However, our results were lower than those found in tropical dry ecosystems of India (2·8 t ha−1 yr−1; Singh and Singh, 1981) or were comparable to tropical agroforestry systems of Acacia intercropped with Sorghum in Kenya (2·1 t ha−1 y−1; Lehmann and Zech, 1998). Compared to temperate ecosystems, our calculations were much lower: 6·5–8·1 t ha−1 yr−1 for sugar maple trees (Acer saccharum) in North America (Aber et al., 1985; Hendrick and Pregitzer, 1993) and 3·2–10·9 t ha−1 yr−1 found for red pine trees (Pinus resinosa) (McClaugherty et al., 1982).
Finally, fine roots can tally a substantial proportion to the total NPP in tropical plants: 16 % in coconut (Navarro et al., 2008), approx. 30 % in rubber tree, 33 % in oil palm (Dufrêne, 1989) and approx. 30 % on average for all terrestrial ecosystems (Vogt et al., 1996; Jackson et al., 1997; Ostonen et al., 2005). In our study, fine roots contributed 17 % to total NPP (using unpublished results), which seems relatively low compared to the results cited above. Optimal nutrient conditions here could explain such differences, given the plasticity of root systems in general.
Estimation of fine root turnover rates were not much influenced by the methodology chosen, contrary to several previous studies (Hertel and Leuschner, 2002; Hendricks et al., 2006; Jourdan et al., 2008). In our study, fine root turnover ranged from 1·25 to 1·00 yr−1 estimated from both DM and MM, respectively, and both rates are low for tropical humid perennial plantations. In plantations in a similar climate, turnover rates have been reported in the order of 2·0–2·5 yr−1 [e.g. Larix in Korea (Son and Hwang, 2003), Acacia in Kenya (Lehmann and Zech, 1998), Gliricidia in Ivory Coast (Schroth and Zech, 1995), Eucalyptus in Brazil (Jourdan et al., 2008)]. Our results were more similar to turnover rates in deciduous (0·1–1·5 yr−1) or coniferous (0·5–0·7 yr−1) forests in temperate ecosystems (Nadelhoffer et al., 1985; Burke and Raynal, 1994; Ruess et al., 1996; Brunner et al., 2013). In their review, Gill and Jackson (2000) concluded that fine root turnover decreased from tropical to high-latitude ecosystems for all plant functional groups. Therefore, coffee seems to be an exception, probably because it grows in very well-watered, drained and fertilized conditions.
We found a discrepancy between fine root lifespan and necromass concentrations determined by sequential coring, and fine root decomposition rates in litter bags. Fine root lifespan from sequential coring ranged from 0·61 to 1·03 years (7–12 months), but we did not encounter corresponding large necromass amounts in the cores: either fine root necromass decomposed very rapidly, or the separation of live and dead fine roots severely underestimated necromass. In the root decomposition experiment, 54 % of fine root necromass did not decompose at all over a 6-month incubation period. If these results were representative for the field, then we should have recovered around half of the lost biomass in the cores during seasonal biomass drops. However, necromass always remained far less than biomass, by two orders of magnitude. We already mentioned the possibility of underestimation of necromass during fine root sorting. It is, however, also possible that the fine root decomposition rates in the litter bags were artificially low due to a very fine mesh size; this mesh size ensured that root material could not leave the bag unless at least properly fragmented to a microscopic level, but also prevented the contact of the roots with macro- and mesofauna and reduced contact with soil to micro-organisms. Mesh size may therefore have slowed down decomposition considerably. Also, the timing of the decomposition experiment (February–August 2012) and the sequential coring (April 2012 to July 2013) only match partially. Climatic conditions (rainfall, soil humidity and temperature) did not vary much over the period of measurement, with the exception of some drier months in February and April 2013 (2012 had an unusually wet dry season – data not shown). This would provide an argument for the decomposition rates being representative, but repeated fine root incubations at different times over the period of root sampling would have been more accurate. In future studies, we recommend putting a greater emphasis on necromass distinction and fine root decomposition, using litter bags with a larger mesh size and assessments repeated along seasons.
Towards a below-ground carbon storage factor for mitigation projects
In most agricultural soils, SOM is depleted as compared to the local optimum (Hillel and Rosenzweig, 2010). Agroforestry is one of the agroecological practices recommended to recover higher values of SOM (Arévalo-Gardini et al., 2015), a crucial goal to increase fertility while compensating for GHG emissions, e.g. NAMA and 4 per 1000 projects (http://4p1000.org). The fate of litter in long-term storage pools such as SOM remains extremely difficult to assess and most estimations rely on decomposition experiments or models (Pansu et al., 2009; Cotrufo et al., 2013). We observed no significant variation in fine root biomass with regard to plant age. Therefore, our initial assumption that NPPfr is equivalent to the fine root litter (Lfr) is confirmed and it can be considered that Lfr is around 2·96 t ha−1 yr−1. A conservative rule-of-thumb for estimating the conversion efficiency of litter carbon to soil carbon would be about 10 % in sandy soils (Barthes et al., 2006), even if efficiency increases with the fraction of clay due to the formation of stable aggregates, and hence organic matter protection (Feller and Beare, 1997). Hence, after conversion from dry mass to carbon, coffee fine roots litter could result in approx. 0·15 t C ha−1 yr−1 incorporated into SOM. This conservative estimate of 0·15 t C ha−1 yr−1 could be applied during C-balance and C-neutrality estimations, proposed here as a ‘below-ground C storage factor’ for coffee, the counterpart of the currently accepted emission factors.
Conclusions and Perspectives
We developed two innovative approaches to estimate (1) the biomass of the coffee perennial components (allometry based on the independent variable of basal area at collar, BAC), and (2) annual growth and NPP based on growth ring analysis. The ephemeral component of fine roots was assessed with the classical sequential coring method.
Allometry is the best solution to incorporate the below-ground component in mitigation projects as it is non-destructive and can be assessed at regular intervals to monitor carbon incorporation into the root system. Growth ring analyses take into account stand history and can be used to estimate the below-ground biomass of coffee plants over time in regions where only one growth ring per year is formed, such as in humid zones. Overall, the root systems of coffee plants were vigorous (approx. 50 % of total plant biomass) compared to the above-ground component. This phenomenon was probably a consequence of periodic (5 year) coppicing above ground, and was probably an advantage in the competition for space when grown in conjunction with Erythrina. Fine root biomass fluctuated by a factor of two seasonally and fine root NPP accounted for 69 % of the total below-ground NPP, representing a major source of carbon for SOM build-up. A conservative value of 0·15 t C ha−1 yr−1 is proposed as a coffee stand carbon sequestration factor and coffee is therefore a good candidate for mitigating GHG emission in agricultural practices.
Acknowledgements
The authors thank CATIE and Patricia Leandro for laboratory facilities, the Aquiares farm for hosting the Coffee-Flux observatory since 2009 and ICAFE for giving access to their hybrid trials. Elsa Defrenet’s MSc scholarship and fieldwork were funded by the ANR Ecosfix Project (ANR-10-STRA-003-001). The Coffee-Flux site belongs to the SOERE F-ORE-T, which is supported annually by Ecofor, Allenvi and the french national research infrastructure ANAEE-F (http://www.anaee-france.fr/fr/). Complementary analyses were performed during the CIRAD ATP-SAFSE, Fontagro CAF’Adapt (FTG-10067) and ANR MACACC (ANR-13-AGRO-0005) projects. We are much indebted to the Barquero family and collaborators for their excellent field assistance and to all students and contributors to the Coffee-Flux project: http://www6.montpellier.inra.fr/ecosols/Implantations-et-ateliers/Costa-Rica.
Appendix
Abbreviations
Symbols and units.
B, biomass (g per plant or t ha−1); BAC, basal area at collar (cm2); C, carbon; Δ, difference (g per plant yr−1 or t ha−1 per time interval); DM, Decision Matrix method; fDr, fraction of deep roots, below 1·5 m; k, decomposition rate for fine root necromass (yr−1); L, litter production, or mortality (g per plant yr−1 or t ha−1 yr−1); MM, Min-Max method; N, necromass (g per plant or t ha−1); NPP, net primary productivity (t ha−1 yr−1); Pfr, production of fine roots (t ha−1 per time interval); SOM, soil organic matter; RAD, root area density of impacts on trench walls (cm2 cm−2 ×10³); RD, residual density of coffee (=5580 plants ha−1); RM, litter mass (g per litterbag); τ, renewal or turnover rate (yr−1).
Subscripts.
as, aerial stump; fr, fine roots; pc, perennial components; pr, perennial root.
Literature Cited
