


Abstract
Background and Aims Plants regulate cellular oxygen partial pressures (pO2), together with reduction/oxidation (redox) state in order to manage rapid developmental transitions such as bud burst after a period of quiescence. However, our understanding of pO2 regulation in complex meristematic organs such as buds is incomplete and, in particular, lacks spatial resolution.
Methods The gradients in pO2 from the outer scales to the primary meristem complex were measured in grapevine (Vitis vinifera) buds, together with respiratory CO2 production rates and the accumulation of superoxide and hydrogen peroxide, from ecodormancy through the first 72 h preceding bud burst, triggered by the transition from low to ambient temperatures.
Key Results Steep internal pO2 gradients were measured in dormant buds with values as low as 2·5 kPa found in the core of the bud prior to bud burst. Respiratory CO2 production rates increased soon after the transition from low to ambient temperatures and the bud tissues gradually became oxygenated in a patterned process. Within 3 h of the transition to ambient temperatures, superoxide accumulation was observed in the cambial meristem, co-localizing with lignified cellulose associated with pro-vascular tissues. Thereafter, superoxide accumulated in other areas subtending the apical meristem complex, in the absence of significant hydrogen peroxide accumulation, except in the cambial meristem. By 72 h, the internal pO2 gradient showed a biphasic profile, where the minimum pO2 was external to the core of the bud complex.
Conclusions Spatial and temporal control of the tissue oxygen environment occurs within quiescent buds, and the transition from quiescence to bud burst is accompanied by a regulated relaxation of the hypoxic state and accumulation of reactive oxygen species within the developing cambium and vascular tissues of the heterotrophic grapevine buds.
INTRODUCTION
The buds of perennial trees and vines comprise one or more embryonic shoots with multiple meristems of diverse organogenic states, enclosed in a protective shell of dense scales. Similar to germinating seeds, the transition from quiescence to metabolically active occurring during bud burst is rapid, and requires the re-structuring of intercellular communication, respiratory and biosynthetic metabolism, and cell division and expansion. The identity, pluripotency and fate of cells in the meristem is determined by spatial organization (Esau, 1977; van den Berg et al., 1995), which is compounded in the embryonic shoot. Hence, this transition requires intricate spatial and temporal coordination of intercellular signalling networks within and between the functional domains of each meristem.
Oxygen is an essential substrate and signal in all aerobic organisms. Plants regulate the availability of oxygen and its metabolism during key transitions, including the regulation of quiescence (Considine and Foyer, 2014). Within this context the cellular reduction/oxidation (redox) hub plays a key role (Gapper and Dolan, 2006; Considine and Foyer, 2014), and we suggest the partial pressure of oxygen (pO2) also plays an important role, as known in animals and other aerobic organisms (Brahimi-Horn et al., 2007). The complex roles of redox processes in seed germination (Diaz-Vivancos et al., 2013, and references therein) and the control of pO2 are far from understood (Bradford et al., 2008; Borisjuk and Rolletschek, 2009). Similarly, our current knowledge of redox and pO2 sensing and signalling during bud burst is limited, particularly in terms of the spatial resolution of oxygen dynamics. Animal stem cell models consider that the redox environment, together with hypoxia (low pO2), are central regulators of the stem cell niche, which are key to cell identity and the maintenance of quiescence and pluripotency (Mohyeldin et al., 2010; Wang et al., 2013). The quiescent centre of the root meristem resides in an oxidized niche (Jiang et al., 2003; Jiang and Feldman, 2005). It is probable that the organizing centre and stem cells of the shoot apical meristems have similar requirements (Reichheld et al., 2007; Considine and Foyer, 2014).
In plants, as in animals, intracellular redox signals govern the cell cycle (Colucci et al., 2002; Jiang et al., 2003; Rothstein and Lucchesi, 2005; Diaz-Vivancos et al., 2010). The local perception of pO2 in animals enables acclimation during developmental transitions, as well as mediating responses to various stress conditions and pathologies (Brahimi-Horn et al., 2007). Recent studies have increased understanding of the sensing and signalling of pO2 in plant oxygen-stress responses (Gibbs et al., 2011; Licausi et al., 2011). However, this type of regulation has scarcely been studied in developing systems other than seeds.
Regulation of respiration is central to the transition from quiescence to the metabolically active state. During seed germination or bud burst, respiration increases because of the requirement for oxidative phosphorylation and reducing power (Morohashi and Shimokoriyama, 1975; Hourmant and Pradet, 1981; Bewley, 1997). Studies on seeds have demonstrated a regulatory role of redox signalling during germination and clear spatial gradients that illustrate the function of reactive oxygen species (ROS) and low-molecular-weight antioxidants in cell division and expansion (Gidrol et al., 1994; Schopfer et al., 2001; Oracz et al., 2009; Kranner et al., 2010; Rewers and Sliwinska, 2014).
The transition to bud burst can be accelerated by numerous sub-lethal stresses, including transient inhibition of respiration, heat shock or hypoxia (Esashi and Nagao, 1973; Erez et al., 1980; Erez, 1987), as is also the case with seed germination (Roberts, 1962; Siegel et al., 1962, 1964; Chen, 1970; Al-Ani et al., 1985). ROS are proposed to be key signalling agents induced by respiratory inhibition, as they function both directly on the cell cycle and by modulating activities of plant growth regulators such as ethylene, abscisic acid and auxin (Ophir et al., 2009). This fits with earlier suggestions that repressed catalase activity (Shulman et al., 1983; Nir et al., 1986) and increased production of hydrogen peroxide stimulate bud burst in grapevine (Perez and Lira, 2005; Vergara et al., 2012a). Indirect evidence that dormant buds reside in an hypoxic state comes from analyses of gene expression. Transcripts encoding proteins involved in oxidative phosphorylation and the tricarboxylic acid (TCA) cycle are repressed in dormant buds while those encoding components involved in glycolysis, pyruvate metabolism, fermentation and redox networks are increased (Halaly et al., 2008; Ophir et al., 2009; Vergara et al., 2012b). Much of these data come from buds under stress conditions.
The scales of buds have low oxygen permeability and so the enclosed tissues are likely to be hypoxic, similar to the situation in dry seeds (Borisjuk and Rolletschek, 2009). In the seeds of some species, the suberized cell layers beneath the seed coat act as a barrier to oxygen diffusion, and their removal accelerates germination (Collis-George and Melville, 1974; Rolletschek et al., 2007). To date, no studies in the literature report data on pO2 values in buds. The following studies were therefore performed to resolve this issue, and to examine the cellular redox poise and pO2 status during bud burst. Furthermore, we aimed to resolve the spatio-temporal changes in these parameters that accompany the transition to bud burst, in a simplified developmental system that may provide a platform for further studies in a range of conditions and quiescent states (Considine and Foyer, 2014). The following experiments were performed on grapevine (Vitis vinifera), which is one of the most economically important woody perennial crop species, and has become a model species for research on perennial woody plants. Due to the anatomical complexity of the grapevine bud relative to other meristematic organs, it is useful to describe grapevine bud structure (Pratt, 1974; May, 2004). The mature bud complex, or N+2 according to May (2004), comprises a hierarchy of three buds – primary, secondary and tertiary – each resembling primordial shoots (Fig. 1). The primary bud is the most developed and by maturity bears 12–15 nodes, including inflorescence, tendril and leaf primordia, enclosed by layers of bracts and hairs. During maturation prior to winter, outer bracts lignify and harden to physically protect the bud over winter. Concurrent with this is a gradual cessation of meristematic activity and the acquisition of tolerance to desiccation and chilling (Schrader et al., 2004; Rohde et al., 2007; Ruttink et al., 2007). The cessation of growth involves the acquisition of dormancy, defined as the failure of an intact, viable bud to burst in otherwise conducive conditions, until repressive factors are overcome through entrainment to seasonal signals such as chilling and photoperiod (Bewley, 1997), otherwise known as endodormancy (Lang et al., 1987). Once endodormancy is overcome, the bud is said to be ecodormant, i.e. quiescent but awaiting conducive conditions for growth. In this study, we refer to the mature bud complex as a whole, although pO2 measurements were directed at the primary bud, and the secondary and tertiary buds were often lost during histological processing. The data presented here show that ecodormant buds undergo a regulated transition from hypoxia to the oxygenated state during bud burst. These findings provide a platform to further explore and dissect the roles of these signalling agents in mediating transitions in bud dormancy governed by environmental and developmental inputs.
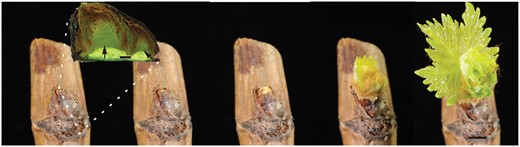
Time-series of grapevine bud burst. Single node explants of ecodormant buds were transferred from cool storage (4 °C) and planted out at 23 °C (dark). Figure shows the progression of bud burst at 0, 1, 3, 7 and 9 d (left to right) at 23 °C. Buds were sampled for the studies presented here at select time points during this development. The inset shows a sagittal section of the bud, with the primary (centre arrow), secondary (right arrow) and tertiary (left arrow) bud meristem complexes. When ecodormant (0 d), the bud complex is enclosed by a layer of lignified scales and several layers of bracts. Progressively over 3–5 d we observed expansion of the bud complex and rupture of the outer scales. Within 5–7 d, buds reached the stage of bud burst, according to the modified Eichorn–Lorenz scale (EL4; Coombe, 2004). By 9 d, the first leaves had separated from the shoot apical meristem (EL7). Scale bar in main figure = 5 mm, inset = 1 mm.
MATERIALS AND METHODS
Plant material
Grapevine Vitis vinifera L.v ‘Crimson Seedless’ canes with mature dormant buds were harvested mid-winter from a vineyard in Yallingup Siding, Western Australia (33·694°S, 115·102°E). Canes with buds intact were stored at 4 °C in the dark until they had received at least 5500 chilling hours (approx. 7 months). The low degree of quiescence of the buds after cold-storage was confirmed by growing single-node cuttings of nodes 5–7 (explants, numbered acropetally) at 23 °C in vermiculite in darkness, with water maintained at field capacity (see Fig. 1 for developmental progression). Nodes 5–7 were chosen due to positional effects noted previously (Antcliff and May, 1961). The cumulative rate of bud burst was scored similarly to that described by Antcliff and May (1961) and according to the modified Eichorn–Lorenz scale (EL; Coombe, 2004), showing that 50 % of buds had reached EL-4 after 96 h at 23 °C and 80 % bud burst by 240 h (data not shown). On this basis we chose to study a time series over 72 h from transfer to 23 °C, in continuous darkness to minimize complexity. One or more single nodes were considered a biological replicate, as described for each assay.
Internal O2 partial pressure
The internal pO2 of buds were measured after 3, 24 and 72 h at 23 °C, using a Clark-type oxygen microelectrode with tip diameter of 25 µm (OX-25; Unisense A/S, Aarhus, Denmark). Internal pO2 was also measured in buds with the outer scales removed by scalpel 10 min earlier, after 3 h at 23 °C. Microelectrodes were calibrated at atmospheric pO2 (20·87 kPa) and at zero O2, then mechanically guided into the buds, from the outer scale surface to the core of the primary bud, in 25 -µm steps to a depth of 2000 µm using a motorized micro-manipulator (MC-232; Unisense). The microelectrode recording was allowed to stabilize for 20 s after each step with measurements taken over the subsequent 10 s. Means and 95 % confidence intervals of individual buds (n = 3) were calculated using R (R Development Core Team, 2014) and graphics were compiled using the latticeExtra package and functions within (Sarkar and Andrews, 2013).
Bud respiratory CO2 production
Four buds per biological replicate were excised from the cane by transverse sectioning at the base of the bud, weighed and placed onto thin agar plates, cut-side down, so that O2 entry and CO2 exit would occur across the bud scales rather than via the cut base. The rate of CO2 production of each biological replicate was measured in the dark, in an insect respiration chamber (6400-89; Li-COR, Lincoln, NB, USA) attached to an Li-6400XT portable gas exchange system. Measurements were performed at 23 °C, in CO2-controlled air (380 µmol CO2 mol−1 air) with 100 µmol m−2 s−1 air flow, at 55–75 % relative humidity. The system was allowed to stabilize for 10 min before recording and until the ‘stableF’ value was equal to 1, i.e. the condition of humidity, CO2 and air flow were in equilibrium and stable. Means and 95 % confidence intervals were determined by fitting the time-series of CO2 evolution to a quadratic equation of the form, y = α + β1x + β2x2, using the linear model function within R (R Development Core Team, 2014) and plotted using ggplot2 (Wickham, 2009).
Histology
Chemicals for histology were supplied by Sigma (St Louis, MO, USA) unless otherwise stated. To confirm the path of the pO2 microelectrode, buds were fixed for sectioning immediately after measurement. Before excision and fixation, a vector was cut in a sagittal plane from each side of the bud complex, adjacent to the primary bud and parallel to the path of the microelectrode to aid penetration of the fixative. Buds were then excised from the cane by transverse sectioning at the base of the bud, then fixed in 10 % (v/v) formaldehyde (Chem-Supply, Adelaide, Australia) with 5 % (v/v) propionic acid (Ajax Chemicals, Sydney, Australia) overnight at 4 °C, and subsequently dehydrated in serial ethanol solutions (15, 20, 25, 30, 50, 75, 90 and 100 %, v/v), 30 min each, with gentle agitation at 4 °C. Buds were then embedded in paraffin wax. Sagittal sections (5 µm) of the bud were made on a microtome (RM2255; Leica Biosystems, Nussloch, Germany), transferred to slides, de-waxed and stained with 0·05 % (w/v) toluidine blue O in 0·1 m phosphate buffer, pH 4·8. The sections were then scanned at 20× magnification using an Aperio Scanscope LX (Leica Biosystems).
Histological detection of hydrogen peroxide (H2O2) and superoxide (O2.−) were performed on bud sections from explants grown for 0, 3, 23 or 72 h at 23 °C. The methods of Groten et al. (2005) were followed with minor change: nitrobluetetrazolium (NBT) and 3,3′diaminobenzedine (DAB) were each dissolved in 10 mm phosphate buffer, pH 7·8, without dimethylsulfoxide. Buds were excised from the cane as described to visualize the path of the microelectrode, and stained under light vacuum for 8 h at room temperature in darkness. Stained buds were fixed in 4 % (v/v) formaldehyde (Chem-Supply) in a buffer of 5 mm MgSO4, 5 mm EGTA and 50 mm PIPES, pH 6·9, vacuum infiltrated for 1 h, incubated overnight at 4°C, dehydrated in serial ethanol solutions (15, 20, 25, 30, 50, 75, 90 and 100 %, v/v), 30 min each, with gentle agitation at 4 °C. The buds were then transferred to 1:1 (v/v) ethanol/Steedman’s wax solution (Norenburg and Barrett, 1987) and incubated overnight at room temperature prior to embedding. Serial sagittal sections of the bud were made at 20 -µm intervals using a microtome (RM2255; Leica Biosystems), transferred to slides and de-waxed in 100 % followed by 50 % (v/v), 5 min each solution. The sections were then scanned at 20× magnification using a Aperio Scanscope LX (Leica Biosystems).
To visualize lignin, NBT-stained buds were counter-stained with 0·05 % (w/v) Auramine-O (Ajax Chemicals) in deionized water. A drop of stain solution was placed on each section and left to absorb for 1 min before washing the slides with sprayed water. The stained sections were then visualized using a Carl Zeiss microscope (D-708 Z; Oberkochen, Germany) with blue light at 450–490 nm.
RESULTS
CO2 production and internal pO2
Respiratory CO2 production rates increased from approx. 4·0 to 5·2 nmolCO2 g f. wt−1 s−1 in ecodormant buds maintained at 23 °C over the first 72 h following the transition from low to ambient temperatures. Subsequently, respiration rates fell to 4·0 nmol CO2 g f. wt−1 s−1 by 144 h (Fig. 2), showing that metabolic activity was increased upon transition to conducive growth conditions for bud burst.
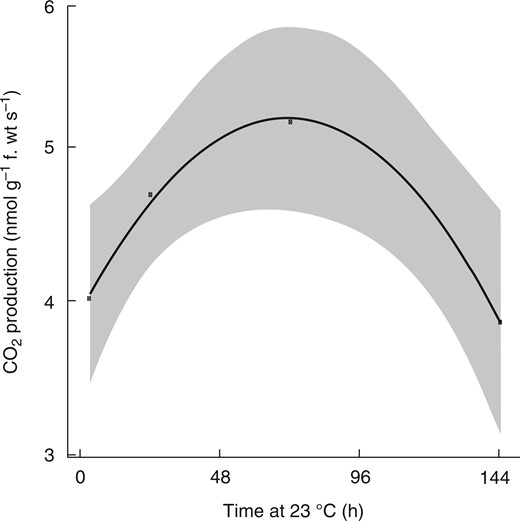
Respiratory CO2 production during grapevine bud burst. Ecodormant buds were transferred from cool storage (4 °C) and planted out at 23 °C (dark) at 0 h. The rate of CO2 production was measured on groups of four excised buds with the cut base on agar using an infra-red gas analyser in darkness. Data represent a regression (n = 4 replicates of four buds per replicate) ± 95 % confidence intervals by fitting the time series of CO2 evolution to a quadratic equation of the form, y = α + β1 x + β2x2 (refer Materials and Methods).
We determined the internal pO2 profile from the outer scale towards the core of the primary bud complex; at 3 h after transfer to 23 °C, which was the earliest stage of measurement, the internal pO2 was hypoxic immediately within the scale (approx. 10 kPa cf. air = 20·6 kPa), declined towards 5 kPa within the outer 500 µm and declined steadily to approx. 2·5 kPa through to the core of the bud complex (Fig. 3A). Some replicate data showed undetectable O2 (severe hypoxia/potential anoxia) at the core. Removal of the outer layer of scales at this time point resulted in oxygenation of the outer 15–1800 µm of the tissue profile, relative to the intact bud, although the core remained near 2·5 kPa (Fig. 3B). Despite this effect, de-scaling buds had no significant effect on the rate or completion of bud burst to stage EL-4, relative to intact buds (data not shown; see Materials and Methods). We then determined the pO2 profiles of intact buds at 24 and 72 h after transfer to 23 °C to determine whether removal of the scale at 3 h simply expedited the normal progression of oxygenation within the bud. By 24 h, only the pO2 of the outer 500 µm of the bud had increased, up to approx. 15 kPa pO2 immediately within the scale, while the remaining path towards the core remained near levels seen in intact buds at 3 h (Fig. 3C). By 72 h, the pO2 profile of the outer 1400 µm of tissue resembled that of the de-scaled buds at 3 h, although the pO2 of the inner 500 µm had increased, resulting in a biphasic profile such that the minimum pO2 along the electrode’s transect was approx. 7 kPa at 1400 µm depth from the scale, while at 2000 µm depth, the pO2 was >10 kPa (Fig. 3D). Figure 3E shows the path of the microelectrode in a representative section.
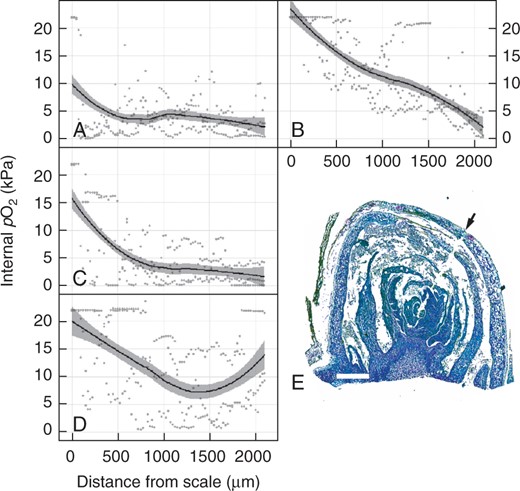
Internal profile of the partial pressure of oxygen (pO2) during grapevine bud burst. The pO2 of ecodormant buds, intact (A = 3 h, C = 24 h, D = 72 h) or with the outer scale removed (B = 3 h) was assayed after time at 23 °C in darkness. Data represent scatterplots of raw data (n = 3), with a regression curve applied and 95 % confidence intervals shown as grey shading. (E) Sagittal section of the primary bud meristem complex, fixed and stained with toluidine blue, showing the path of the O2 microelectrode from the outer scale (arrow) towards the inner core of the primary bud complex. Scale bar = 500 µm.
Histological detection of superoxide and hydrogen peroxide
Using replicate buds of the same developmental series and treatment conditions as used for pO2 microelectrode measurements, we stained for the local accumulation of superoxide (O2·−) and hydrogen peroxide (H2O2), detected as the products of reactions with NBT or DAB, respectively. Immediately upon removal from 4 °C (0 h) and after 3 h at 23 °C, O2.− accumulated in a very confined zone of the meristematic tissue, around the axillary meristems (Fig. 4A). After 3 h, however, O2.− accumulation was observed in the cambial meristem tissues. For the first 3 h no H2O2 accumulation was detected in tissues around the apical meristem but low levels were observed in the cambial meristem tissue (Fig. 4E, F). After 24 h, O2.− levels were increased in a wider zone of tissues of the apical meristem complex and retained in the cambial meristem tissues, while H2O2 was not accumulated in the tissues with the exception of the cambial meristem (Fig. 4C, G). At this time point the pO2 at the core of the bud complex remained low. A more distinct pattern of O2·− localization emerged at 72 h, which suggested association with the developing pro-vascular tissues (Fig. 4D). At 72 h, no H2O2 accumulation was observed in the bud tissues (Fig. 4H). By this stage, the pO2 at the core of the bud complex had increased, suggesting a possible association between the patterns.

Spatial and temporal localization of reactive oxygen species (ROS) in sagittal sections of the primary bud meristem complex during bud burst. Superoxide (A–D) and hydrogen peroxide (E–H) localization were indicated using nitrobluetetrazolium (NBT) and 3,3′diaminobenzedine (DAB), respectively, against fixed sections (20 µm), sampled at 0 h (A, E), 3 h (B, F), 24 h (C, G) or 72 h (D, H) after transfer to 23 °C. Scale bar = 500 µm. Figures are representative of three independent replicates.
To investigate the cell types associated with the distinct O2.− pattern seen at 72 h, we counter-stained sections to visualize lignin. Figure 5 shows a clear co-localization of O2·− with lignified cellulose as early as 3 h from transfer to 23 °C, but not earlier, providing further evidence that these are developing pro-vascular tissues. At 0 h, O2·− accumulation was localized in the meristematic tissues but very little lignin associated with this pattern (Fig. 5C and D show magnified images of the boxed areas of Fig. 5A and B). By contrast, at 3 h the co-localization of O2·− and lignin was observed (Fig. 5D–F shows the individual and superimposed images). Close inspection of Fig. 5E reveals the typical ladder-like perforation plates of xylem vessel elements.

Spatial and temporal localization of superoxide (A, C, E) as contrasted to lignin (B, D, F) in grapevine buds during the first 3 h after transfer to 23 °C. Superoxide (NBT) is localized to latent meristem cells at 0 h, with negligible association with lignified cells (A–D, indicated by Auramine-O), where C and D are magnifications of the boxed inserts in A and B. By 3 h at 23 °C, superoxide production is evidently associated with lignin, indicative of pro-vascular development (E–G), where G is F superimposed over E. Scale bar = 100 µm (A, B), 20 µm (C, D), 50 µm (E–G). Figures are representative of three independent replicates.
DISCUSSION
The experimental system presented here mitigated the potentially confounding effects of endodormancy and the influence of light. Endodormancy in grapevine, as in many perennial trees and vines, is primarily overcome by an accumulated exposure to chilling. Adequately chilled buds are termed ecodormant, a qualitative condition that is repressed only by the unfavourable growth environment (i.e. cold) and therefore more comparable to quiescence in other organs and forms of life. Bud burst per se does not require the presence of light (Pouget, 1963), although several studies have demonstrated influences of light intensity and photoperiod on organogenesis at other stages of development (Buttrose, 1970; Srinivasan and Mullins, 1981). There is no knowledge of whether photosynthesis may initiate in the bud prior to bud burst. Drawing analogy to seeds, where in several species photosynthesis influences the internal pO2 even during development or when mature and imbibed prior to germination (Borisjuk and Rolletschek, 2009), we may expect this to be the case in buds. Hence, overcoming endodormancy and excluding light allowed us to accurately and precisely study heterotrophic metabolism during the acute phase of bud burst.
Cells in a quiescent state are defined by very low metabolic rates, with minimal respiration until environmental or metabolic triggers prime the metabolic systems to resume growth. While several authors have described conserved responses to hypoxia or other oxidative stress across species and life forms (Hochachka, 1986; Jones et al., 2000; Mustroph et al., 2010), it is not possible to construct a generalized description of the metabolic state of quiescent cells or the changes that occur upon the transition to the metabolically active state or subsequent proliferation (Valcourt et al., 2012; Teslaa and Teitell, 2015). The findings of the present study provide new insights into the management of hypoxia when dormancy is broken in quiescent grapevine buds by exposure to chilling and the subsequent transition to ambient temperatures. While respiration rates are rapidly increased and superoxide accumulation is observed in and around the developing lignified zone of the cambium following the transition to ambient temperatures, the release from the hypoxic state is gradual and occurs in specific regions of the bud as the developmental transition progresses.
Rapid acceleration of respiratory CO2 production was observed in the buds following the transition from low to ambient temperatures, demonstrating alleviation of the constraints maintaining the quiescent state. This process, which was observed over the 72 h of bud burst measured at 23 °C, resembles the pattern observed during seed imbibition (Bewley, 1997) and in other studies on perennial buds (Hollis and Tepper, 1971; Shulman et al., 1983; Gardea et al., 1994; McPherson et al., 1997; Perez et al., 2008). Measurements of respiratory CO2 production do not allow discrimination between TCA cycle activity, fermentation, the pentose phosphate pathway or other pathways. Evidence suggests that fermentation occurs during bud burst under stress conditions and that the imposition of stress accelerates bud burst. For example, acetaldehyde and ethanol accumulate in ecodormant grape buds treated with sodium azide, hydrogen cyanamide or heat shock (Ophir et al., 2009). Hydrogen cyanamide, heat shock and hypoxia increase the levels of transcripts that are orthologues of ALCOHOL DEHYDROGENASE, PYRUVATE DECARBOXYLASE and SUCROSE SYNTHASE in ecodormant grapevine buds (Or et al., 2000; Ophir et al., 2009; Vergara et al., 2012b). However, in each case, untreated controls showed a slower or weaker transcriptional response with negligible fermentation activities observed during bud burst. These observations suggest that stress-induced changes in transcript profiles do not reflect the transcriptome signatures of developmental regulation of bud burst. Some evidence of pentose phosphate pathway activity was seen throughout seasonal development in pear buds (Zimmerman and Faust, 1969), and during chilling of potato tubers (Dwelle and Stallkneckt, 1978) or peony buds (Gai et al., 2013). However, these studies represent quite different physiological states compared with bud burst.
Many plant tissues and organs, including dry seeds, have permeability barriers that reduce oxygen diffusion. In the case of seeds, the hypoxic state may contribute to maintaining quiescence (see Introduction). The data presented here show that the scales of the dormant bud are a significant barrier to oxygen. Crucially, however, the meristematic core of the bud tissues remained in a hypoxic state even when the outer scales were removed. While Iwasaki and Weaver (1977) suggested some acceleration of bud burst in de-scaled ecodormant grapevine buds, removal of the outer scales did not affect the rate of bud burst in our study (data not shown). Schneider (1968) also showed that removal of scales attenuated quiescence of Rhododendron floral buds. However, in these earlier studies there was very limited replication of experiments. Nevertheless, it is conceivable that the buds used in our study were near to 100 % labile and hence very little effect of scale removal would be seen.
The data reported here demonstrate that the pO2 at the meristematic core of the bud complex was in an hypoxic state for up to 24 h after the environmental trigger to resume growth had caused an increased in respiration. Respiratory CO2 production rates had increased by 15 % in 24 h and superoxide accumulation was observed in the cambial tissues underlying the meristematic core of the bud complex. By 72 h, however, the oxygen profile was biphasic, the oxygen levels within the bud core had increased and superoxide accumulation was pronounced within the pro-vascular tissues. The present data are insufficient to explain the biphasic profile of oxygenation. In the heterotrophic conditions presented, even once the resistance to diffusion of the outer scales and compacted tissues was relaxed, the increased respiratory rates would contribute to substantial declines in pO2 with distance into the tissue. Further investigation of the vascular flow and metabolic activities at the core of the bud complex are required. Our group is currently exploring these features, and also the developmental processes and controls that preside in the presence of light, where photosynthesis may contribute to oxygenation even prior to bud burst, as is the case during germination of some seeds (Borisjuk and Rolletschek, 2009).
Vascular development and re-activation of intercellular communication are proposed to be essential early features of the transitions to and from quiescence in plant organs, including grapevine buds (Esau, 1948; Rinne et al., 2001; Paul et al., 2014). Cell expansion, cell-wall thickening and the conductivity of plasmodesmata in vascular tissues are all dependent on, or influenced by, ROS accumulation (Gapper and Dolan, 2006; Benitez-Alfonso et al., 2011). Ogawa et al. (1997) showed a strong co-localization of lignin and superoxide (NBT) in vascular tissue of spinach hypocotyls. Moreover, these authors demonstrated that inhibition of CuZn SUPEROXIDE DISMUTASE (CuZnSOD) or NAD(P)H OXIDASE reduced vascular lignin biosynthesis. More recently, ectopic expression of CuZnSOD and/or ASCORBATE PEROXIDASE (APX) in Arabidopsis resulted in enhanced vascular lignin synthesis (Shafi et al., 2015). SOD, APX and catalase were found in cell membranes that had been partially purified from lignin-producing tissues of Norway spruce (Karkonen et al., 2014). Together, these data suggest that vascular lignin synthesis is dependent on superoxide and/or hydrogen peroxide production. Note that hydrogen peroxide did not accumulate in vascular tissues of the buds studied here.
Taken together, the data presented here add to the growing body of evidence showing that regulation of redox and oxygen metabolism is critical to organ development (Considine and Foyer, 2014). The present study demonstrates that during bud burst, the complex network of enclosed shoot meristems undergoes a controlled transition from hypoxia to increasing pO2. This transition is accompanied by a highly localized accumulation of ROS in and around the developing cambium and vascular tissues. These data clearly demonstrate the spatial and temporal nature of the control of the oxygen and redox environments within the bud that occurs during the transition from quiescence to burst in heterotrophic grapevine buds.
ACKNOWLEDGEMENTS
This work was supported by a postgraduate Australia Award Scholarship to K.M. (Australia Government) and Australian Research Council grants to M.J.C. (LP0990355) and to M.J.C., C.H.F., J.A.C. and T.D.C. (DP150100347). K.M. and M.J.C. would like to thank the Australian Grape and Wine Authority for a travel scholarship, which supported some of this research and collaboration. M.J.C. and C.F. thank the Royal Society (UK) for a Society International Exchanges 2011/R2 (IE111477) joint project grant to support this work. All authors would like to thank A/Prof. Ole Pedersen for technical advice on the pO2 measurements. The authors acknowledge the facilities, and the scientific and technical assistance of the Australian Microscopy & Microanalysis Research Facility at the Centre for Microscopy, Characterisation & Analysis, The University of Western Australia, a facility funded by the University, State and Commonwealth Governments. The authors also would like to thank Mary Lee and acknowledge the facilities and scientific and technical expertise of CELLCentral, School of Anatomy, Physiology and Human Biology, The University of Western Australia.
LITERATURE CITED
