


Abstract
Background and AimsAegilops markgrafii (CC) and its natural hybrids Ae. triuncialis (UtUtCtCt) and Ae. cylindrica (DcDcCcCc) represent a rich reservoir of useful genes for improvement of bread wheat (Triticum aestivum), but the limited information available on their genome structure and the shortage of molecular (cyto-) genetic tools hamper the utilization of the extant genetic diversity. This study provides the complete karyotypes in the three species obtained after fluorescent in situ hybridization (FISH) with repetitive DNA probes, and evaluates the potential of flow cytometric chromosome sorting.
Methods The flow karyotypes obtained after the analysis of 4',6-diamidino-2-phenylindole (DAPI)-stained chromosomes were characterized and the chromosome content of the peaks on the flow karyotypes was determined by FISH. Twenty-nine conserved orthologous set (COS) markers covering all seven wheat homoeologous chromosome groups were used for PCR with DNA amplified from flow-sorted chromosomes and genomic DNA.
Key Results FISH with repetitive DNA probes revealed that chromosomes 4C, 5C, 7Ct, T6UtS.6UtL-5CtL, 1Cc and 5Dc could be sorted with purities ranging from 66 to 91 %, while the remaining chromosomes could be sorted in groups of 2–5. This identified a partial wheat–C-genome homology for group 4 and 5 chromosomes. In addition, 1C chromosomes were homologous with group 1 of wheat; a small segment from group 2 indicated 1C–2C rearrangement. An extensively rearranged structure of chromosome 7C relative to wheat was also detected.
Conclusions The possibility of purifying Aegilops chromosomes provides an attractive opportunity to investigate the structure and evolution of the Aegilops C genome and to develop molecular tools to facilitate the identification of alien chromatin and support alien introgression breeding in bread wheat.
INTRODUCTION
Wild relatives of wheat (Triticum aestivum) are potential sources of important genes and alleles for wheat improvement (Sears, 1956; Friebe et al., 1996). Recently they have received increasing attention due to the urgent need to breed improved cultivars of wheat tolerant to various diseases and to the negative effects of the changing climate. Many wild relatives of primary interest belong to the genus Aegilops (goatgrass), which comprises a number of species, including the D-genome progenitor of bread wheat. However, unlike Ae. tauschii, for which a physical map and a draft genome sequence have become available recently (Jia et al., 2013; Luo et al., 2013), the genomes of the other species have not been characterized in detail, hampering their use in wheat improvement.
Aegilops markgrafii (Greuter) Hammer (syn: Ae. caudata L.) (2n = 2x = 14; CC) is an annual diploid species growing in the Mediterranean region, with an area of distribution ranging from southern France to northern Iraq (Van Slageren, 1994). This species is the C-genome progenitor of the annual allotetraploids Ae. cylindrica Host. (2n = 4x = 28; DcDcCcCc) and Ae. triuncialis L. (2n = 4x=28; UtUtCtCt), which are potential sources of resistance to Barley yellow dwarf virus, rusts, powdery mildew and various pests (Hessian fly and Cyst nematode), and tolerance to abiotic stresses (cold, drought and salinity) (Friebe et al., 1996; Colmer et al., 2006; Schneider et al., 2008; Kilian et al., 2011). Moreover, these species carry genes for high grain micronutrient content (Rawat et al., 2009).
The genes and alleles of interests can be introduced into wheat by interspecific hybridization (Friebe et al., 1996; Cox, 1998). To date, the development of six wheat–Ae. markgrafii chromosome addition lines (Friebe et al., 1992), two substitution lines, 5C(5A) and 5C(5D) (Muramatsu, 1973; Friebe et al., 1992), and two wheat–Ae. cylindrica addition lines (Bai et al., 1995) has been reported. The main tools for the selection and characterization of wheat–Aegilops introgression lines are cytogenetic methods such as C-banding (Fiebe et al., 1996) and methods based on in situ hybridization: fluorescence in situ hybridization (FISH) (Mukai et al., 1993) and genomic in situ hybridization (GISH) (Schwarzacher et al., 1989). GISH makes it possible to visualize the constituent genomes in allopolyploid Aegilops species (Molnár-Láng et al., 2014) as demonstrated by Linc et al. (1999), who used fluorescein-labelled Ae. markgrafii genomic DNA as a probe, with unlabelled genomic DNA of Ae. tauschii as a competitor to detect Cc-genome chromatin in Ae. cylindrica.
Probably the most frequently used repetitive DNA probes for the characterization of cereal genomes have been pAs1, pSc119.2 and the 18S–5.8S–26S rDNA clone, pTa71 (Rayburn and Gill, 1986; Bedbrook et al., 1980; Gerlach and Bedbrook, 1979). The genomic distribution of the repeats was described for diploid Aegilops species, including the C-genome donor Ae. markgrafii, by Badaeva et al. (1996a, b) and was used to study the evolution of the D- and U-genome chromosomes of Aegilops, including Ae. cylindrica and Ae. triuncialis (Badaeva et al., 2002, 2004). However, the complete karyotype has not yet been described using the probes pAs1, pSc119.2 and pTa71 in Ae. cylindrica or Ae. triuncialis, and, most importantly, the chromosomes belonging to the Cc and Ct genomes have not been identified (Badaeva et al., 2002, 2004). The lack of information available for the cytomolecular identification of the C-genome chromosomes hampers the use of the genetic potential of goatgrasses in wheat pre-breeding programmes.
Another difficulty preventing the wider use of wild alleles has been the limited knowledge available on the genome structure of goatgrasses and the lack of genomic tools. The advent of next-generation sequencing (NGS) platforms paved the way for cost-effective large-scale DNA sequencing in plants, including bread wheat and related species (Brenchley et al., 2012; Ling et al., 2013; Choulet et al., 2014; International Wheat Genome Sequencing Consortium, 2014). The most efficient approach for designing markers for Ae. markgrafii, Ae.cylindrica and Ae. triuncialis would be to use their reference genome sequences, which is not realistic due to their large genome size (4 Gbp/1C in the diploid Ae. markgrafii and 9·379 and 9·711 Gbp/1C in the polyploid Ae. cylindrica and Ae. triuncialis, respectively) (Doležel et al., 2003; Eilam et al., 2008). The high proportion of repetitive DNA, which typically exceeds 90 % of the nuclear genomes in Triticeae/Aegilops species, represents a further obstacle to the assembly of short sequence reads obtained by NGS sequencing (Dvořák, 2009).
The difficulties encountered due to genome complexity can be partially overcome by isolating single chromosomes, which represent smaller and defined parts of the nuclear genome. The procedures for the purification of specific wheat chromosomes by flow cytometric sorting (Vrána et al., 2000) and preparation of DNA from flow-sorted chromosomes suitable for cloning (Šafář et al., 2004) and sequencing using NGS technology (Šimková et al., 2008) allowed the development of molecular markers, generating draft chromosome sequence assemblies, construction of sequence-ready physical maps and production of a reference sequence for the first wheat chromosome (Paux et al., 2008; Choulet et al., 2014; International Wheat Genome Sequencing, 2014).
The ability to isolate chromosomes via flow cytometric sorting has been reported in wild relatives of wheat, including their diploid progenitors, and in other related species in the genera Aegilops and Dasypyrum (Molnár et al., 2011b; Doležel et al., 2012; Grosso et al., 2012; Molnár et al., 2014). To date, flow cytometric chromosome analysis and sorting has not been reported in diploid Ae. markgrafii or its natural hybrids Ae. cylindrica and Ae. triuncialis. As the technology could greatly aid the transfer of genes from wild relatives to bread wheat, as well as the study of evolution within the Triticeae/Aegilops complex, we set out to explore the possibility of isolating individual chromosomes from Ae. markgrafii, Ae. cylindrica and Ae. triuncialis by flow sorting. The complete karyotypes of these species were described by sequential FISH and two-colour GISH, and were used to identify the chromosome content of individual peaks of the flow karyotypes obtained after the analysis of 4',6-diamidino-2-phenylindole (DAPI)-stained chromosomes. DNA amplified from isolated chromosomes was used to identify the genomic location of conserved orthologous set (COS) markers in the Aegilops species. The results of the present work represent an important step forward in analysing the molecular organization of chromosomes in C-genome Aegilops species and providing molecular (cyto-) genetic tools to support alien gene transfer in wheat improvement programmes.
MATERIALS AND METHODS
Plant material
Aegilops markgrafii accession MvGB428, Ae. cylindrica accession MvGB1719 and Ae. triuncialis accession MvGB585, maintained at the Martonvásár Cereal Genebank, were used for flow cytometric chromosome analysis and sorting, for in situ hybridization experiments and for COS marker analysis. Total genomic DNA from Ae. tauschii MvGB605, Ae. umbellulata MvGB420, Secale cereale ‘Lovászpatonai’, Oryza sativa ‘Bioriza’ and Triticum turgidum subsp. durum ‘Mv Makaróni’ was also used for in situ hybridization experiments, while the hexaploid wheat (T. aestivum) genotype Mv9kr1 was used for COS marker analysis.
Preparation of liquid suspensions of chromosomes
Cell cycle synchronization in root tip meristem cells was carried out with hydroxyurea and their accumulation in metaphase using amiprohos-methyl, as described by Kubaláková et al. (2005). Suspensions of intact chromosomes were prepared from metaphase-enriched root tips according to Vrána et al. (2000). Briefly, 50 roots were cut 1 cm from the root tip and fixed in 2 % (v/v) formaldehyde in Tris buffer at 5 °C for 20 min. After washing in Tris buffer, the meristem tips were excised and transferred to a tube containing 1 mL of LB01 buffer (Doležel et al., 1989) at pH 9. Metaphase chromosomes were released after homogenization with a Polytron PT1300 homogenizer (Kinematica AG, Littau, Switzerland) at 20 000 rpm for 13 s. The homogenate was passed through a 50 µm pore size nylon mesh to remove large cellular debris, and stored on ice until analysis on the same day.
Flow cytometric chromosome analysis and sorting
The samples were analysed using a FACSVantage SE flow cytometer (Becton Dickinson, San José, CA, USA) equipped with an argon ion laser set to multiline UV and 300 mW output power. The chromosome suspensions were stained with DAPI at a final concentration of 2 µg mL–1 and analysed at rates of 200–400 particles s–1. DAPI fluorescence was acquired through a 424/44 band-pass filter. Approximately 30 000 chromosomes were analysed in each sample, and the results were displayed as histograms of relative DAPI fluorescence intensity (flow karyotypes). In order to verify the chromosome content of individual peaks on flow karyotypes, 1000 chromosomes were sorted from each peak at rates of approx. 5–10 s–1 into a 15 µL drop of PRINS buffer supplemented with 5 % sucrose on a microscope slide (Kubaláková et al. 1997), air-dried and used for FISH, with probes for DNA repeats that give chromosome-specific fluorescent labelling patterns.
Fluorescence in situ hybridization
Total genomic DNA was extracted from fresh leaves of Ae. tauschii (D genome), Ae. markgrafii (C genome), Ae. umbellulata (U genome), S. cereale and O. sativa using Quick Gene-Mini80 (FujiFilm, Tokyo, Japan) according to the manufacturer’s instructions. The repetitive DNA sequences Afa family, pSc119.2 and the 18 S unit of the 45S rRNA gene were amplified using PCR from genomic DNA of Ae. tauschii, S. cereale and rice as described by Nagaki et al. (1995), Contento et al. (2005) and Chang et al. (2010), respectively. Afa, pSc119.2 and the 18S rRNA unit were labelled with digoxigenin-11-dUTP (Roche), biotin-16-dUTP (Roche, Mannheim, Germany) and a mix of biotin-11-dUTP (50 %) and digoxigenin-11-dUTP (50 %), respectively, by nick translation using standard kits from Roche following the manufacturer’s instructions. The genomic DNA from Ae. umbellulata and Ae. tauschii was labelled with digoxigenin-11-dUTP (U- and D-genomic probes), while genomic DNA from Ae. markgrafii was labelled with biotin-16-dUTP (C-genomic probe) by random priming, and sheared by autoclaving. Unlabelled genomic DNA from durum wheat (T. turgidum subsp. durum) was sheared by autoclaving and used as blocking DNA. Digoxigenin and biotin were detected using anti-digoxigenin–rhodamine Fab fragments (Roche) and streptavidin–fluorescein isothiocyanate (FITC; Roche), respectively.
Pre-treatments and stringency washes (Schneider-Linc et al., 2005) were applied only to slides containing root tip metaphase cells. These steps were omitted in experiments with flow-sorted chromosomes. The hybridization mix (30 µL per slide), containing 50 % formamide, 2× SSC, 10% dextran sulphate, 20 ng of 18S rDNA and 70 ng each of the pSc119.2 and Afa family probes in the presence of salmon sperm DNA, was denatured at 80 °C for 10 min and stored on ice for 5 min. Chromosomal DNA was denatured in the presence of the hybridization mix at 75 °C for 6 min and allowed to hybridize overnight at 37 °C. To detect the hybridization signals, 10 µg mL−1 each of streptavidin–FITC and anti-digoxigenin–rhodamine were used. Finally, the slides were counterstained with 2 µg mL−1 DAPI and examined with a Zeiss Axioskop-2 fluorescence microscope using a Plan Neofluar oil objective ×63, NA 1·25 (Zeiss, Oberkochen, Germany) and optical filter sets for DAPI (Zeiss filter set 02) and FITC and rhodamine (Zeiss filter set 24). Images were acquired with a Spot CCD camera (Diagnostic Instruments, Sterling Heights, MI, USA) and compiled with Image Pro Plus software (Media Cybernetics, Silver Spring, MD, USA).
The hybridization mix for GISH (30 µL per slide), containing 50 % formamide, 2× SSC, 10 % dextran sulphate, 50 ng of C-genomic probe, 35 ng of D- (or U-) genomic probe and 2·1 µg of blocking DNA, was denatured at 80 °C for 10 min and stored on ice for 5 min. Chromosomal DNA was denatured in the presence of the hybridization mix at 75 °C for 6 min and allowed to hybridize overnight at 42 °C.
Relative chromosome lengths were determined as the ratio of chromosome length to the length of the whole chromosome complement by measuring the lengths of at least 20 chromosomes per homoeologous group on DAPI-stained images of Ae. markgrafii MvGB428, Ae. triuncialis MvGB585 and Ae. cylindrica MvGB1719.
Amplification of chromosomal DNA
Chromosomes were sorted from each peak on a flow karyotype in batches of 25 000–50 000 (equivalent to 20–40 ng) into PCR tubes with 40 µL of sterile deionized water. The chromosomes were treated with proteinase and their DNA was amplified by multiple displacement amplification (MDA) using an Illustra GenomiPhi V2 DNA Amplification Kit (GE Healthcare, Chalfont St. Giles, UK) as described by Šimková et al. (2008). The amplified DNA was used as a template for COS marker analysis.
COS marker analysis
The preparation of genomic DNA from the accessions of Ae. markgrafii MvGB428, Ae. cylindrica MvGB1719 and Ae. triuncialis MvGB585, used for the flow cytometric analysis, and from the wheat (T. aestivum L.) genotype Mv9kr1 was carried out as described by Cseh et al. (2013). A total of 29 COS markers (Supplementary Data Table S1) specific for wheat homoeologous groups I–VII were chosen from publicly available COS marker collections [Quraishi et al., 2009; the Wheat Genetic Improvement Network: http://www.wgin.org.uk/resources/Markers/TAmarkers.php; Tools and Resources (TR) collections: http://www.modelcrop.org/cgi-bin/gbrowse/brachyv1/].
The PCRs were performed as described by Molnár et al. (2014) in a 12 µL reaction volume using a reaction mix consisting of 1× PerfectTaq Plus PCR Buffer (5 Prime GmbH, Hamburg, Germany) and 0·4 µm primers, while 50 ng of genomic DNA or 1·5 ng of amplified chromosomal DNA were used as a template. PCR was carried out in an Eppendorf Mastercycler (Eppendorf, Hamburg, Germany) using the reaction profiles WGIN, 95 °C (15 min), 39 cycles of 95 °C (0·5 min), 58 °C (0·5 min), 72 °C (0·5 min), hold at 72 °C (5 min): TR, 94 °C (10 min), 16 cycles of 95 °C (0·5 min), 58 °C (1 min), decreasing by 0·5 °C per cycle to 50 °C, 72 °C (1 min), and 25 cycles of 94 °C (0·5 min), 50 °C (1 min), 72 °C (1 min). The annealing temperature and PCR profiles are summarized together with the primer sequences in Supplementary Data Table S1. PCR amplicons were separated using a Fragment Analyzer™ Automated CE System equipped with a 12-Capillary Array Cartridge (effective length 33 cm) (Advanced Analytical Technologies, Ames, IA, USA). The results were analysed using PROsize v2.0 software.
RESULTS
Chromosome analysis using flow cytometry (flow karyotyping)
The analysis of DAPI-stained chromosome suspensions revealed differences between the three Aegilops species in the number of peaks and in the degree of resolution of individual peaks on the flow karyotypes (Fig. 1). The flow karyotype of Ae. markgrafii had four well-resolved peaks (Fig. 1A). In Ae. triuncialis, two peaks (peaks I and II) were well resolved, while three were only partially resolved (peaks III, IV and V) (Fig. 1B). Out of the six peaks identified on the flow karyotype of Ae. cylindrica, four were well resolved (peaks I, II, V and VI), while peaks III and IV were incompletely discriminated (Fig. 1C). The chromosome peaks on the flow karyotype of diploid Ae. markgrafii were observed at lower fluorescence intensity channels (380–500) as compared with those of the tetraploid species Ae. triuncialis (channels 390–610) and Ae. cylindrica (channels 390–590) (Fig. 1).
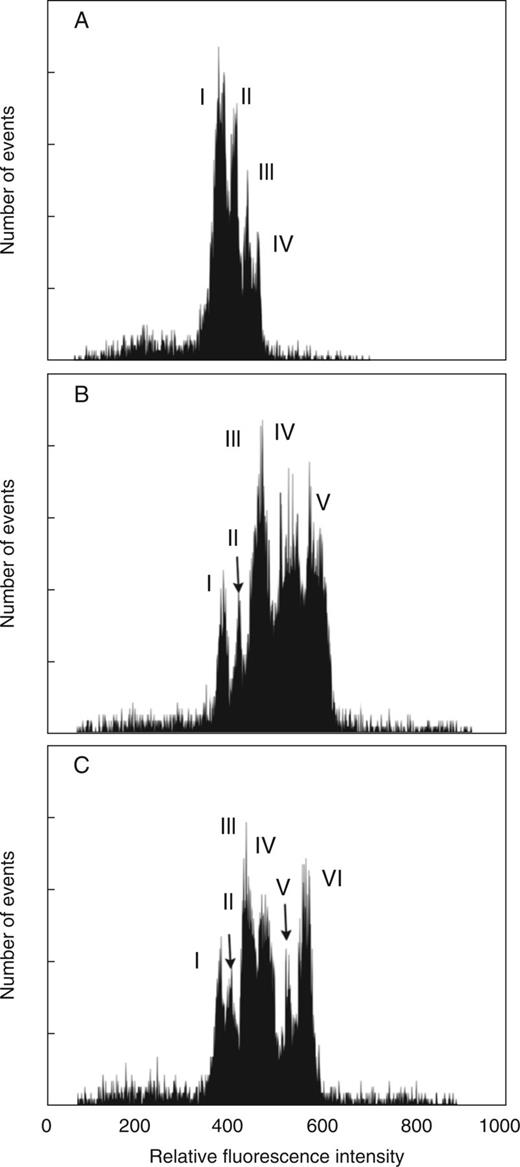
Flow karyotypes obtained after the analysis of DAPI-stained chromosome suspensions prepared from Ae. markgrafii MvGB428 (2n = 2x = 14, CC) (A), Ae. triuncialis MvGB585 (2n = 4x = 28, UtUtCtCt) (B) and Ae. cylindrica MvGB1719 (2n = 4x = 28, DcDcCcCc) (C). The flow karyotype of Ae. markgrafii consists of two composite peaks, I and II, representing groups of three and two chromosomes, respectively, while peaks III and IV are specific for chromosomes 5C and 4C, respectively. The flow karyotype of Ae. triuncialis comprises three composite peaks, III, IV and V, representing chromosome groups of 3–5 chromosomes, while peaks I and III are specific for chromosomes T1 and 7Ct, respectively. The flow karyotype of Ae. cylindrica consists of four composite peaks, I, III, IV and VI, representing chromosome groups of 2–4 chromosomes, while peaks II and V are specific for chromosomes 1Cc and 5Dc, respectively.
In situ hybridization on mitotic metaphase spreads
In order to develop a reference karyotype for the identification of flow-sorted chromosomes, the accessions Ae. markgrafii MvGB428, Ae. triuncialis MvGB585 and Ae. cylindrica MvGB1719 were investigated with FISH and GISH. FISH using repetitive DNA probes (Afa family, pSc119.2 and 18S rDNA) on root tip mitotic metaphase spreads allowed the identification of the whole set of chromosomes in Ae. markgrafii, Ae. triuncialis and Ae. cylindrica (Fig. 2). The accessions of Ae. cylindrica and Ae. triuncialis were also investigated using two-colour GISH in order to discriminate the constituent genomes. The Cc- and Dc-genome chromosomes were clearly discriminated in Ae. cylindrica using differentially labelled total genomic DNA from Ae. markgrafii and Ae. tauschii (Fig. 2C). Similarly, the use of labelled genomic DNA from Ae. markgrafii and Ae. umbellulata allowed the parallel visualization of the Ct- and Ut-genome chromosomes in Ae. triuncialis (Fig. 2E).
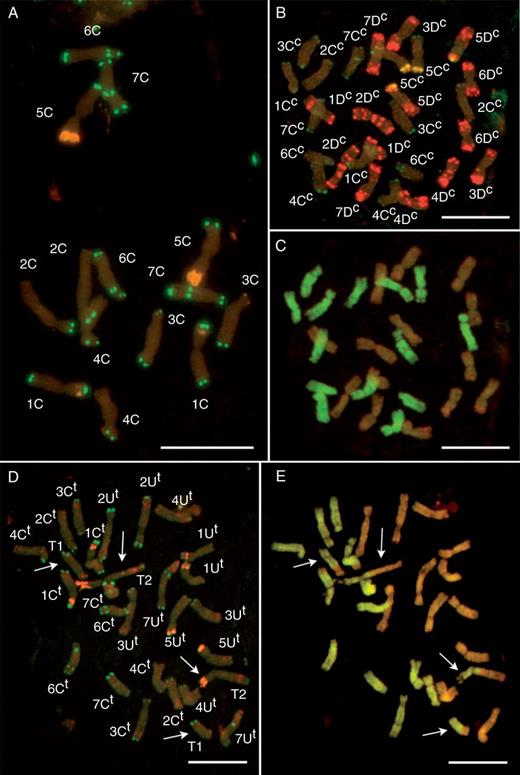
Molecular cytogenetic identification of mitotic chromosomes in Ae. markgrafii MvGB428 (A), Ae. cylindrica MvGB1719 (B, C) and Ae. triuncialis MvGB585 (D, E) by fluorescence in situ hybridization (FISH) (A, B, D) using the Afa family, pSc119.2 and pTa71 repetitive DNA probes, and by two-colour genomic in situ hybridization (GISH) using D- and C- (C), or U- and C-genome probes (D). On the FISH images (A, B, D) pSc119.2 sites are green, Afa family signals are red and 18S rDNA signals are yellow. On the GISH images the C genome is visualized in green (C, E), while the D (C) and U genomes (E) are in brown. Disomic U/C reciprocal translocations (T1: 6UtS.6UtL-5CtL and T2: 5CtS.5CtL-6UtL) in Ae. triuncialis are indicated by arrows. Scale bar = 10 µm.
The application of two-colour GISH revealed the presence of a disomic reciprocal Ut/Ct translocation in Ae. triuncialis with pericentromeric breakpoints. The rearranged Ct chromosome was clearly identified as 5Ct on the basis of diagnostic Afa and 18S rDNA signals on the short arm and of the telomeric pSc119.2 signal on the long arm. The acrocentric Ut chromosome involved in the reciprocal translocation had Afa signals in the terminal region of the short arm and in an intercalary position on the long arm. This chromosome structure and hybridization pattern corresponded to chromosome 6U, as observed earlier in Ae. umbellulata (Molnár et al., 2011a) and the reciprocal translocations were thus identified as T1, 6UtS.6UtL-5CtL; and T2, 5CtS.5CtL-6UtL.
Differences in the FISH patterns were observed between the Ae. markgrafii genotype used in this study and those used previously (Badaeva et al., 1996a, b). A strong pSc119.2 signal was observed on the long arm of 3C, which was lacking from the same position on 4C. When the allotetraploid species Ae. cylindrica and Ae. triuncialis were compared with their diploid C-genome ancestor Ae. markgrafii, differences were detected in the FISH hybridization patterns in some of the C chromosomes. Similarly, the strong telomeric pSc119.2 signal on 4CL of Ae. cylindrica was missing in Ae. markgrafii and Ae. triuncialis, while the telomeric pSc112.2 signal on 6CL was not observed in Ae. cylindrica, and an additional sub-telomeric pSc119.2 band was observed in Ae. triuncialis.
The Dc genome of Ae. cylindrica showed FISH hybridization patterns similar to those of diploid Ae. tauschii (Molnár et al., 2014), with minor differences on chromosome 2Dc (strong Afa signals at intercalary and telomeric positions on the short and long arms, respectively), 3Dc (lack of a telomeric pSc119.2 signal on the short arm) and 4Dc (the presence of a strong telomeric Afa signal on the long arm). Only minor differences were observed between the U genome of Ae. triuncialis and those of the diploid progenitor Ae. umbellulata (Molnár et al., 2011a), involving the hybridization pattern of chromosomes 4Ut (lack of a telomeric pSc119.2 signal on the long arm) and 6Ut (lack of a centromeric Afa signal).
These differences were not great enough to hinder chromosome identification, and all the chromosomes in the diploid and polyploid Aegilops species could be distinguished according to their fluorescence labelling patterns. Moreover, the differences in the FISH patterns will facilitate the identification of each of the Aegilops chromosomes in the wheat background. The idiogram representing the genomic distribution of the Afa family, pSc119.2 and 18S rDNA sequences in Ae. markgrafii MvGB428, Ae. cylindrica MvGB1719 and Ae. triuncialis MvGB585 is shown in Fig. 3.
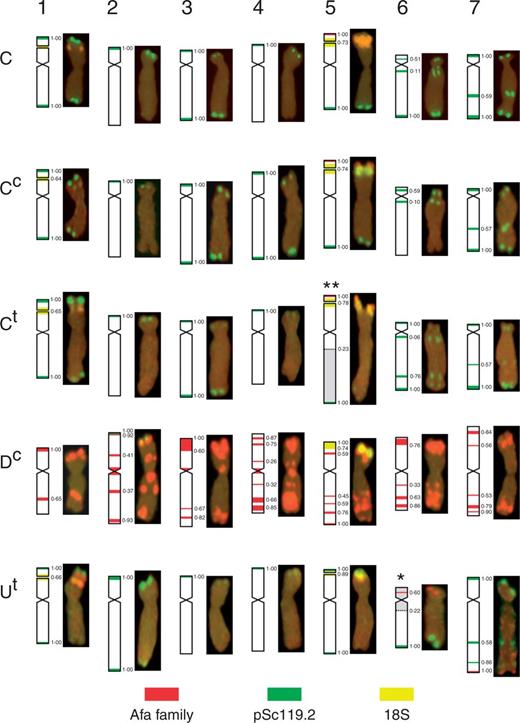
Idiogram and karyotype of the chromosomes of Ae. markgrafii MvGB428 (C), Ae. cylindrica MvG1719 (Cc, Dc) and Ae. triuncialis MvGB585 (Ct, Ut) showing the genomic distribution of repetitive DNA sequences pSc119.2 (green), Afa family (red) and 18S rDNA (yellow). Disomic U/C reciprocal translocations T16UtS.6UtL-5CtL and T25CtS.5CtL-6UtL in Ae. triuncialis are indicated by * and **, respectively. The positions for hybridization signals and translocation breakpoints on the chromosome arms are given in fraction lengths determined as means of 15–20 measurements.
Description of flow karyotypes
The chromosome content of individual peaks on the flow karyotypes was determined on flow-sorted chromosomes after FISH with probes for the Afa family, pSc119.2 and 18S rDNA repeats (Fi. 4; Table 1). Strong hybridization signals obtained using the FISH probes were similar to those observed on mitotic metaphase spreads and allowed unambiguous identification of the sorted chromosomes. In Ae. markgrafii, peaks I and II contained chromosomes 1C, 6C and 7C, and 2C and 3C, respectively. Peaks III and IV corresponded to chromosomes 5C and 4C, representing 15·15 and 14·72 % of the Ae. markgrafii genome, which could be sorted at a purity of 66·2 and 91·3 %, respectively (Fig. 4; Table 1). In Ae. cylindrica, peaks II and V contained chromosomes 1Cc and 5Dc representing 6·32 and 7·61 % of the genome, which could be sorted at a purity of 67·5 and 84·9 %, respectively (Fig. 4; Table 1). The composite peaks I and III comprised groups of chromosomes (6Cc and 7Cc, and 3Cc, 1Dc and 6Dc, respectively), while peaks IV and VI contained chromosomes 2Cc, 4Cc, 5Cc and 4Dc, and 2Dc, 3Dc and 7Dc, respectively. In Ae. triuncialis, peaks I and II corresponded to the rearranged chromosome T1 (6UtS.6UtL-5CtL) and 7Ct (representing 5·70 % of the genome), which could be sorted at a purity of 90·1 and 70·0 %, respectively. The composite peaks III and IV contained groups of chromosomes: 3Ct, 6Ct, 1Ut and 3Ut, and 1Ct, 4Ct and 4Ut, respectively, while peak V contained the chromosomes 2Ct, 2Ut, 5Ut and 7Ut, and the translocation chromosome T2 (5CtS.5CtL-6UtL) (Fig. 4; Table 1).
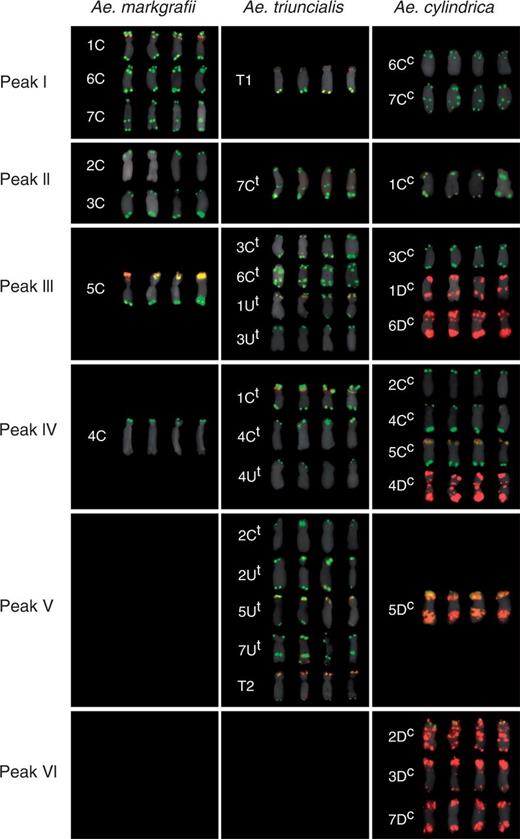
Mitotic metaphase chromosomes sorted from individual peaks of flow karyotypes of Ae. markgrafii MvGB428, Ae. triuncialis MvGB585 and Ae. cylindrica MvGB1719. The sorted chromosomes were identified after FISH with probes for repetitive DNA sequences pSc119.2 (green), Afa family (red) and 18S rDNA (yellow) and counterstained with DAPI (pseudocoloured as grey). The chromosomes were assigned to the peaks in which their frequencies were the highest. Four representative examples are given for each chromosome.
Assignment of chromosomes to peaks on flow karyotypes of Aegilops markgrafii, Ae. cylindrica and Ae. triuncialis
| Species | Genome | Chromosome peaks | ||||||
|---|---|---|---|---|---|---|---|---|
| I | II | III | IV | V | VI | |||
| Ae. markgrafii | C | 1 | 38·03 | 3·54 | – | 0·50 | ||
| 2 | 3·52 | 45·02 | 11·10 | – | ||||
| 3 | 6·86 | 28·20 | 6·48 | – | ||||
| 4 | – | – | 16·20 | 91·37 | ||||
| 5 | 0·74 | 7·44 | 66·20 | 8·12 | ||||
| 6 | 32·09 | 4·78 | – | – | ||||
| 7 | 18·73 | 0·79 | – | – | ||||
| No. of chromosomes analysed | 539 | 376 | 216 | 197 | ||||
| Ae. cylindrica | Cc | 1 | 13·46 | 67·50 | – | – | – | – |
| 2 | 1·90 | – | 0·90 | 24·50 | 1·2 | 0·5 | ||
| 3 | – | – | 21·60 | – | – | – | ||
| 4 | – | – | 3·10 | 27·0 | 0·8 | – | ||
| 5 | – | – | 13·40 | 17·3 | – | – | ||
| 6 | 44·80 | 4·20 | – | – | – | – | ||
| 7 | 36·50 | 9·10 | – | – | – | – | ||
| Dc | 1 | 3·20 | 16·20 | 26·80 | 1·6 | – | – | |
| 2 | – | – | – | – | 2·0 | 34·5 | ||
| 3 | – | – | – | 4·4 | 8·94 | 45·6 | ||
| 4 | – | – | – | 20·9 | – | – | ||
| 5 | – | – | – | 0·8 | 84·95 | 0·5 | ||
| 6 | – | 2·80 | 33·90 | 3·2 | – | – | ||
| 7 | – | – | – | – | 0·8 | 18·7 | ||
| No. of chromosomes analysed | 156 | 142 | 439 | 248 | 246 | 197 | ||
| Ae. triuncialis | Ct | 1 | – | 14·43 | 14·14 | 31·22 | – | |
| 2 | – | – | – | 6·69 | 8·78 | |||
| 3 | – | – | 21·21 | 0·74 | – | |||
| 4 | – | 0·53 | 0·67 | 29·36 | – | |||
| 6 | – | 7·48 | 17·84 | 0·74 | – | |||
| 7 | 9·85 | 70·05 | 2·02 | 0·37 | – | |||
| Ut | 1 | – | 4·27 | 16·49 | – | – | ||
| 2 | – | – | – | 1·85 | 16·21 | |||
| 3 | – | – | 28·28 | – | – | |||
| 4 | – | – | – | 28·62 | – | |||
| 5 | – | – | – | – | 22·29 | |||
| 7 | – | – | – | 0·37 | 19·59 | |||
| T1 | 90·15 | 3·20 | – | – | – | |||
| T2 | – | – | – | – | 33·1 | |||
| No. of chromosomes analysed | 193 | 187 | 297 | 269 | 148 | |||
The numbers give the relative proportion (as a percentage) of specific chromosome types in individual peaks.
The highest chromosome concentrations are highlighted in bold.
Assignment of COS markers to peaks on flow karyotypes
A set of COS markers specific for the seven wheat homoeologous chromosome groups were mapped to the sub-genomic DNA samples obtained after sorting chromosomes from individual peaks on flow karyotypes. Out of the 29 COS markers investigated, 28 gave PCR products in Ae. markgrafii MvGB428, and all 29 in the Ae. cylindrica MvGB1719 and Ae. triuncialis MvGB585 accessions (Supplementary Data Table S2). The 29 markers resulted in a total of 55 PCR products (range, 1–6 PCR products/marker/genotype; mean, 1·89 PCR products) in the diploid Ae. markgrafii MvGB428, while 125 products were amplified in the tetraploid Aegilops species (71 and 54 products in Ae. cylindrica MvGB1719 and Ae. triuncialis MvGB585, respectively). Out of the 55 PCR products detected in the diploid Ae. markgrafii, 38 (69·09 %) and 17 (30·9 %) were polymorphic and non-polymorphic, respectively, relative to the tetraploid Ae. cylindrica, while 31 (56·36 %) and 24 (43·63 %) were polymorphic and non-polymorphic, respectively, relative to the tetraploid Ae. triuncialis. Out of the 180 PCR products amplified by the 29 COS markers in the three Aegilops species, 144 (80·0 %) were polymorphic relative to the wheat genotype Mv9kr1, and can thus be used for the marker-assisted selection of wheat–Aegilops introgression lines in pre-breeding programmes.
Because each chromosome of the investigated Aegilops species has a major location in one of the peaks on a flow karyotype (Table 1), the yield of PCR products differed between the peaks, and the highest amount of PCR products was observed in the peak where the locus-carrying chromosome had its major location (Fig. 4). For example, the markers XGPI:C:731424 and XGPI:C:725135, which are specific for group 4 chromosomes of wheat, produced a 260 bp and a 319 bp PCR amplicon, respectively, with continuously increasing yield in the Ae. markgrafii flow karyotype peaks I, II, III and IV, with no amplicon in peak I for XGPI:C:731424, and no amplicon in peaks I–II for XGPI:C:725135 (Supplementary Data Fig. S1, Table S2). The 4C chromosome content was 0, 0, 16·20 and 91·37 %, respectively (Table 1). With these markers, a similar relationship could be observed for the yield of PCR amplicons specific to group 4 chromosome as for the relative content of group 4 chromosomes determined by cytomolecular methods for the flow karyotype peaks in Ae. triuncialis and Ae. cylindrica.
Based on differences in the yield of PCR amplicons between the flow karyotype peaks, all the PCR amplicons could be assigned to peaks on the flow karyotypes of Ae. markgrafii, Ae. triuncialis and Ae. cylindrica (Supplementary Data Tables S2 and S3). The putative chromosomal location of the markers is shown in Supplementary Data Table S3. The group I-specific markers were assigned to the flow karyotype peaks containing group 1 chromosomes (peak I of Ae. markgrafii, peak IV of Ae. triuncialis, specific for 1Ct and peaks II and III of Ae. cylindrica, containing chromosomes 1Cc and 1Dc, respectively). The markers specific for the wheat homoeologous group IV were assigned mainly to flow karyotype peaks representing chromosomes 4C, 4Ct/4Ut and 4Cc/4Dc (i.e. peaks IV of Ae. markgrafii, Ae. triuncialis and Ae. cylindrica). Most of the group 5-specific markers produced PCR amplicons at the highest intensity in flow karyotype peaks containing group 5 chromosomes (i.e. peak III in Ae. markgrafii, peaks I and V in Ae. triuncialis and peaks IV and V in Ae. cylindrica). Markers specific for the wheat homoeologous group 7 were observed mainly in flow karyotype peak II in Ae. markgrafii (containing chromosomes 2C and 3C), in peaks III (containing 3Ct, 6Ct, 1Ut and 3Ut) and V (containing 7Ut) in Ae. triuncialis and in peaks III (where chromosome 3Cc was identified) and VI (where chromosome 7Dc was located) in Ae. cylindrica. Interestingly, only two of the five group 7-specific markers gave intense PCR amplicons in flow karyotype peak I of Ae. markgrafii, which contains chromosome 7C, and none of the group 7-specific markers produced intense PCR amplicons in peaks containing chromosome 7C in Ae. triuncialis (i.e. in peak II) and Ae. cylindrica (i.e. in peak I).
The markers specific for the wheat homoeologous group 3 gave the highest yield of PCR amplicons in flow karyotype peak I of Ae. markgrafii, to which chromosomes 1 C, 6 C and 7 C were assigned. In the case of Ae. triuncialis, the highest amount of PCR products was observed in peak III, consistent with the cytological results assigning chromosomes 3Ct and 3Ut to this peak. In Ae. cylindrica, a specific pattern for the peak location of the PCR amplicons was not observed with the group 3-specific markers. Moreover, no typical peak location was observed for PCR products with markers specific for wheat homoeologous groups 2 and 6. For example, no PCR products were located with group 2-specific markers in peak II of Ae. markgrafii, where chromosome 2 C was located.
DISCUSSION
During the last decade, the application of genomic tools to flow-sorted chromosomes (Doležel et al., 2007) has facilitated the structural and functional analysis of chromosomes, including the high-throughput development of markers, the construction of ready-to-sequence physical maps, and positional gene cloning, mainly in species with high socio-economic importance such as bread wheat, durum wheat, barley and rye (Lysák et al., 1999; Vrána et al., 2000; Kubaláková et al., 2003, 2005; International Wheat Genome Sequencing Consortium, 2014). As the allele diversity in wild related species has great potential for wheat breeding, the utilization of chromosome-based approaches could facilitate the transfer of alien genes to wheat (Tiwari et al., 2014). To date, chromosomes have only been purified by flow cytometry from a limited number of wild species, including Aegilops species with U, M, S and D genomes, T. urartu and Dasypyrum villosum (Molnár et al., 2011b; Grosso et al., 2012; Giorgi et al., 2013; Molnár et al., 2014). The present work extends the potential of chromosome genomics to C-genome Aegilops species: diploid Ae. markgrafii (CC) and its tetraploid relatives Ae. triuncialis (UtUtCtCt) and Ae. cylindica (CcCcDcDc).
The determination of the chromosome content of peaks on flow karyotypes revealed that the C-genome chromosomes of tetraploid Ae. triuncialis and Ae. cylindrica were represented by peaks at lower fluorescence channels relative to the Ut- and Dc-genome chromosomes, suggesting that the C-genome chromosomes are smaller than the Ut- and Dc-genome chromosomes. This is in agreement with the nuclear DNA amounts published for Ae. markgrafii (4·63–4·84 pg/1C DNA), Ae. umbellulata (5·05–5·38 pg/1C DNA) and Ae. tauschii (5·08–5·17 pg/1C DNA) (Furuta, 1970; Eilam et al., 2007, 2008), and indicates that their genomes have undergone different evolutionary changes. As the number of genes per monoploid genome is similar in plants, differences in genome size are mainly due to repetitive DNA sequences, of which retroelements are considered to play a dominant role in genome expansion (Feuillet and Keller, 2002; Bennetzen, 2007).
In the present work, two-colour GISH and FISH were employed with a set of probes suitable for describing the karyotypes of the accessions used for flow cytometric chromosome sorting. The genomic distribution of these probes was previously described in Ae. markgrafii, and in the tetraploid species Ae. triuncialis and Ae. cylindrica (Badaeva et al., 1996a, b; 2002, 2004). The chromosomes of Ae. triuncialis and Ae. cylindrica were similar to those of the ancestral species Ae. markgrafii, Ae. umbellulata and Ae. tauschii (Molnár et al., 2011b, 2014). The number of variable FISH bands compared with the diploid ancestors was lower in Ae. triuncialis than in Ae. cylindrica, indicating that Ae. triuncialis had greater homology with the progenitor genomes than Ae. cylindrica. This was supported by the frequency of non-polymorphic COS marker loci, which was higher (43·63 %) between Ae. markgrafii and Ae. triuncialis than between Ae. markgrafii and Ae. cylindrica (30·9 %). The greater homology of Ae. triuncialis with the progenitor genomes may reflect the more recent origin of this species compared with Ae. cylindrica.
Genomic in situ hybridization revealed a disomic 5Ct/6Ut reciprocal translocation with pericentromeric breakpoints in the Ae. triuncialis accession MvGB585. Intra- and intergenomic rearrangements were also identified by Badaeva et al. (2004) in Ae. triuncialis, Ae. kotschyi and Ae. columnaris, but the translocation breakpoints could not be accurately mapped due to the limitations of the C banding technique. The use of two-colour GISH permitted the identification of U/M intergenomic translocations in four accessions of Ae. biuncialis and in two accessions of Ae. geniculata (Molnár et al., 2011a) with clearly determined pericentromeric breakpoints. These results are consistent with previous observations in other Triticeae species, indicating that pericentromeric regions are prone to rearrangements, including duplications, inversions and deletions (Eichler and Sankoff, 2003; Qi et al., 2006). The preferential location of translocation breakpoints in pericentromeric regions suggests that pericentromeric heterochromatin clusters may play a role in the formation of intergenomic exchanges in the allopolyploid Triticeae/Aegilops species (Raskina et al., 2008; Molnár et al., 2011a). The present study also indicates that intergenomic translocations may promote the dissection of the genome into chromosomes in wild species, and that flow-sorted translocation chromosomes could be used for mapping at the sub-chromosomal level.
It has been well documented that C-genome Aegilops species are attractive sources of numerous agronomic traits. Riar et al. (2012) described the wheat–Ae. markgrafii introgression line T291-2, which carries a homoeoallele of the leaf rust resistance gene orthologue Lr57. Romero et al. (1998) produced a wheat–Ae. triuncialis translocation, TR-3531, carrying the Hessian fly resistance gene H30 and a resistance gene, Cre7, against Heterodera avenae (Martin-Sanchez et al., 2003). The present study demonstrates that chromosomes 4 C and 5 C of Ae. markgrafii, chromosme 7Ct and the translocation chromosome 6UtS.6UtL-5CtL of Ae. triuncialis, and chromosomes 1Cc and 5Dc of Ae. cylindrica can be purified from wild relatives of bread wheat. Chromosomes of Triticeae/Aegilops species that are homoeologous with the chromosomes flow-sorted in this study have been reported to carry important genes and alleles ensuring biotic and abiotic stress tolerance and adaptation to various agro-ecological conditions. For example, chromosome 6U of Ae. umbellulata contains a leaf rust resistance gene, Lr9, that is one of the most effective in providing resistance to leaf rust pathogen Puccinia triticina (Friebe et al., 1996; Vida et al., 2011). The VRN1 gene, which is critical for the adaptation of polyploid wheats to autumn sowing, has been mapped to collinear regions of the long arms of chromosomes 5A, 5B and 5D (Galiba et al., 1995; Snape et al., 1997). Chromosome group 5 of hexaploid wheat also carries major loci affecting winter hardiness and freezing tolerance [FR-1 (Sutka and Snape, 1989) and FR-2 (Vágújfalvi et al., 2003)]. Other loci affecting drought and salt tolerance and the crossability of wheat have also been mapped on the group 5 chromosomes (Riley and Chapman, 1967; Quarrie et al., 1994; Koebner et al., 1996). The chromosomes flow-sorted from Ae. markgrafii and its related species may facilitate the dissection of useful alleles of the above-mentioned genes and their use in wheat improvement to cope with the pleiotropic effects of climate change (Feuillet et al., 2008).
The present results confirm and expand the results of previous studies on the high transferability of COS markers between species (Burt and Nicholson, 2011; Molnár et al., 2013). The fact that 80 % of the products obtained with chromosomes isolated from wild relatives were polymorphic relative to those obtained in hexaploid wheat suggested that a substantial part of the genetic diversity of wild progenitors is due to the variability of intron regions (Yu et al., 2005). Thus, polymorphic COS markers will be suitable for identifying the chromatin of wild Aegilops species introduced into wheat and for marker-assisted selection to facilitate the transfer of useful agronomic traits (Quraishi et al., 2009).
Twenty-five of the 29 COS markers used in the present study were used previously by Molnár et al. (2014) who assigned 20 of them to the same homoeologous group chromosomes of diploid wheats, T. urartu, Ae. speltoides and Ae. tauschii, as in hexaploid wheat. In the present study, the chromosomal location of the same set of markers was not so consistent in the C-genome Aegilops species as in the diploid progenitors of wheat, indicating the presence of genome rearrangements in the C genomes relative to wheat. These results indicate that the 1C chromosomes (1C, 1Ct and 1Cc) are mainly homologous to group 1 chromosomes of wheat (W), but some markers indicate the presence of conserved orthologous regions specific for W2 (in the case of 1C and 1Cc) and W6 (in 1Cc). Homology between the 4C chromosomes (4C, 4Ct and 4Cc) and W4, and partial homology between the 5C chromosomes (5C, 5Ct and 5Cc) and W5 was also observed. On the other hand, more markers proved homology between the W3 and 7C chromosomes (7C, 7Ct and 7Cc), suggesting the presence of a group 3/group 7 rearrangement in the C genomes relative to hexaploid wheat.
The macrosyntenic relationship between the U genome, another widely distributed genome in the genus Aegilops, and wheat was investigated previously by mapping restriction fragment length polymorphism (RFLP) markers on an Ae. umbellulata segregating mapping population and by mapping COS markers on wheat–Aegilops addition lines and flow-sorted chromosomes (Zhang et al., 1998; Molnár et al., 2013). These studies indicated the presence of a small fragment related to W2 on 1U and the presence of a region syntenic with W3 on chromosome 7U (Zhang et al., 1998; Molnár et al., 2013). It can be assumed that similar group 1/group 2 and group 3/group 7 rearrangements are present in the C genomes of Ae. markgrafii and related polyploids. However, a larger number of COS markers assigned to chromosomes of Aegilops species and the preparation of isolated chromosome fractions with higher purity will be needed if the genome rearrangements and synteny perturbations occurring in the C genome and other Aegilops genomes relative to bread wheat are to be effectively studied.
The present study showed that chromosomes 4C and 5C of Ae. markgrafii, chromosome 7Ct and translocation chromosome 6UtS.6UtL-5CtL of Ae. triuncialis, and chromosomes 1Cc and 5Dc of Ae. cylindrica can be purified from wild relatives of bread wheat. FISH analysis on flow-sorted chromosome fractions showed that these chromosomes can be isolated at high purity. Further improvements in the chromosome sorting protocol might lead to the increased purity of these chromosome fractions. However, as demonstrated by Mayer et al. (2011), the level of chromosome contamination observed in the present study does not compromise the bioinformatic analysis of sequence data obtained by sequencing DNA amplified from single chromosome fractions. Other chromosomes of the diploid and tetraploid C-genome Aegilops species formed composite peaks on the flow karyotypes and could be sorted as groups of two, three, four or five. If microsatellite probes can be applied for the fluorescent labelling of the chromosomes in these species, multiparametric flow cytometric analysis may facilitate the isolation of the remaining chromosomes, as shown by Giorgi et al. (2013). The FISH karyotypes of Ae. markgrafii, Ae. triuncialis and Ae. cylindrica developed in this study might serve as a guide when choosing probes for labelling chromosomes prior to flow sorting and may support the introgression of Aegilops chromosomes into wheat.
In conclusion, this study represents an important step forward in developing chromosome genomics for wild genetic resources of wheat. The flow karyotypes of Ae. markgrafii, Ae. triuncialis and Ae. cylindrica were characterized, and the chromosome content of all the peaks was determined for the first time. The ability to purify chromosomes 4C, 5C, 7Ct, T6UtS.6UtL-5CtL, 1Cc and 5Dc in wild genetic resources of wheat paves the way for their NGS to facilitate comprehensive gene content analysis and allele discovery as well as the development of gene-based markers for specific genomic regions. COS markers assigned to the chromosomes of C-genome Aegilops species could be used in pre-breeding programmes to select chromosome segments carrying agronomically useful genes in T. aestivum–Aegilops recombinant lines.
ACKNOWLEDGEMENTS
The authors are grateful to Dr Jarmila Číhalíková, Bc Romana Šperková and Zdenka Dubská for their assistance with chromosome sorting and DNA amplification. This work was supported by the Hungarian National Research Fund [K112226, K104382 and K108555], by a János Bolyai Research Scholarship from the Hungarian Academy of Sciences (to M.I.), by an OECD fellowship [TAD/CRP JA00079297], and by the Ministry of Education, Youth and Sports of the Czech Republic [grant LO1204 from the National Program of Sustainability I]. A.C. gratefully acknowledges support from a Marie Curie Fellowship Grant [FP7-PEOPLE-2013-IEF-625671] under the seventh framework programme of the European Union.
LITERATURE CITED
