


Abstract
Hypertension (HTN) has been demonstrated as one of the leading risk factors for development of cardiovascular disease (CVD) and CVD mortality.
This study examines the prevalence and distribution of HTN subtypes (isolated diastolic hypertension [IDH], isolated systolic hypertension [ISH], and systolic-diastolic hypertension [SDH]) across age, sex, and race/ethnicity per the nationally representative National Health and Nutrition Examination Survey (NHANES) from 1999 to 2020 based on the updated 2017 ACC/AHA HTN definition. We further examined for associations of each subtype with CVD and all-cause mortality using Cox regression analysis.
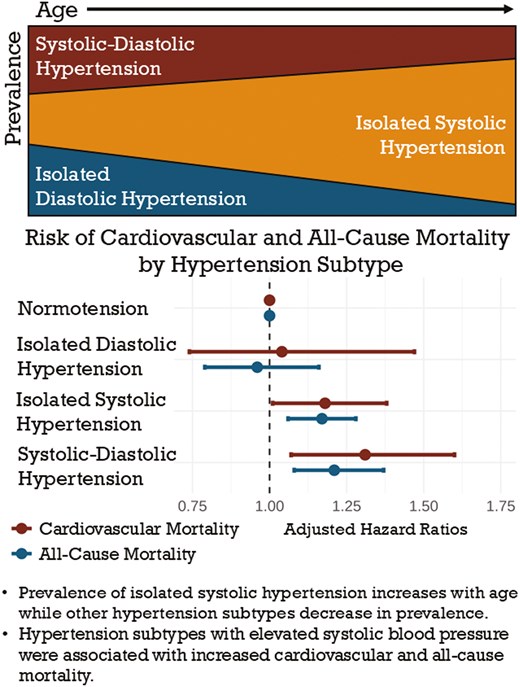
Among US adults, the overall prevalence of HTN is 47.4%. Across increasing age, the prevalence of IDH decreased, ISH increased, and SDH increased and peaked in the 6th decade of life after which SDH prevalence decreased. By age 80, over 80% of persons with HTN demonstrated ISH. A subcohort from NHANES 1999–2008 with follow-up until 2018 showed that ISH and SDH were most strongly associated with increased risk for CVD (HR = 1.18, 95% CI, 1.01–1.38; HR = 1.31, 95% CI, 1.07–1.60, respectively) and all-cause mortality (HR = 1.17, 95% CI, 1.06–1.28; HR = 1.21, 95% CI, 1.08–1.37, respectively).
Our data demonstrate the continuing importance of HTN subtype transitions across age and their differences in predicting future CVD and total mortality.
Hypertension (HTN) has long been demonstrated to be an independent predictor of cardiovascular disease (CVD) and all-cause mortality.1–3 Elevated systolic blood pressure (SBP) has been particularly associated with worse cardiovascular outcomes when compared with elevated diastolic blood pressure (DBP) alone.2,4,5 Thus, the presence of specific subtypes of HTN may have variable implications for risk of mortality. The Ohasama Study provided high-quality data demonstrating that systolic HTN conferred significantly increased risk of CVD mortality, while isolated diastolic hypertension (IDH) did not portend a higher risk when compared with normotension.6 Further analyses have suggested that cardiovascular death risk modulation by hypertension subtypes are unequally affected by age and sex, and that different subtypes may confer variable risks in different subject cohorts.7 In 2017, the Global Burden of Disease Study found high SBP to be the leading factor for attributable deaths and disability-adjusted life-years (DALYs), accounting for 10.4 million deaths and 218 million DALYs globally in the year of 2017 alone.8 A separate analysis of the Global Burden of Disease Study found that between 1990 and 2019, the number of deaths directly attributable to high SBP increased by 54.1% with a concurrent increase in number of DALYs of 52.4%.9 However, despite the strength of evidence for the cardiovascular benefits of strict HTN treatment,10 data suggest that only around 50% of adults with HTN in the United States are treated to blood pressure goal.11,12
In the early 2000s, Franklin et al. characterized the prevalence of HTN and its subtypes in the US Adult Population using the National Health and Nutrition Examination Survey (NHANES).2 The purpose of this study is to re-evaluate the prevalence of HTN subtypes according to the more recent blood pressure cut points based on the 2017 American College of Cardiology (ACC)/American Heart Association (AHA) Guidelines for High Blood Pressure13 stratifying by sex and race/ethnicity. We also examined these HTN subtypes in relation to other comorbidities, CVD, and total mortality, respectively, among US adults.
METHODS
Data source
This study utilized publicly available de-identified data and was thus exempt from institutional review board review. The NHANES is a cross-sectional survey administered by the Centers for Disease Control and Prevention with the stated goal of collecting demographic information, medical history, and medical examination data on the noninstitutionalized civilian US population. Individual-level demographic characteristics, health and nutrition information, and physical exam and laboratory data were collected through personal interviews and a standardized physical examination conducted in a mobile examination center. Since 1999, sample methodology has consisted of multiyear, stratified, clustered four-stage samples, targeting around 5,000 individuals in 15 counties during 2-year periods.14 Our analysis included US adults aged 20 or older from NHANES years 1999–March 2020. BP in NHANES was collected by trained and certified physicians in 30 second intervals following 5 minutes of rest in a seated position. Fourth readings were collected if one or more of the initial three readings were unobtainable.15 Between 1999 and 2016, BP was measured with a mercury sphygmomanometer; from 2017 to 2020, this was changed to a validated oscillometric device calibrated to the mercury sphygmomanometer.16 We utilized mean BP calculated from recorded SBP and DBP values; participants with missing BP data were excluded from analysis. For mortality analyses, we included a baseline cohort from 1999 to 2008 with CVD and all-cause mortality follow-up through 2018.
Definitions
Per the 2017 ACC/AHA Blood Pressure Guidelines, HTN was defined as SBP ≥ 130 mmHg or DBP ≥ 80 mmHg or those currently on antihypertensive therapy.13,17 A SBP 130–139 mmHg or DBP 80–89 mmHg constituted Stage I HTN and SBP ≥ 140 mmHg or DBP ≥ 90 mmHg was considered Stage II HTN. Elevated blood pressure was further defined as those with SBP 120–129 mmHg and DBP < 80 mmHg. Treatment of HTN was defined as participant-reported use of a prescription antihypertensive agent at the time of the interview.
Subject data were stratified by age (<40, 40–49, 50–59, 60–69, 70–79, and ≥80 years old, respectively), sex, ethnicity (categorized into Hispanic, non-Hispanic White, non-Hispanic Black, and Other including Multi-Ethnic), tobacco use (categorized into current, former, and never smokers), HTN subtype, and presence of certain medical comorbidities including obesity, dyslipidemia, diabetes mellitus (DM), and chronic kidney disease (CKD). Dyslipidemia was defined by total cholesterol ≥ 200 mg/dL, low-density lipoprotein ≥ 130 mg/dL, high-density lipoprotein < 35 mg/dL, or triglycerides ≥ 150 mg/dL. DM was defined as fasting glucose >= 126 mg/dL, non-fasting glucose >= 200 mg/dL, hemoglobin A1C ≥ 6.5%, currently taking insulin or diabetes medication, or those that have been told by a physician that they have DM. Three HTN subtypes were considered as part of this analysis: isolated systolic hypertension (ISH) defined as SBP ≥ 130 mmHg and DBP < 80 mmHg, IDH defined as DBP ≥ 80 mmHg and SBP < 130 mmHg, and systolic-diastolic hypertension (SDH) defined as SBP ≥ 130 mmHg and DBP ≥ 80 mmHg. Normal BP was defined as <120/80 mmHg. Obesity was defined in relation to body mass index (BMI), with BMI 18.5–24.9 kg/m2 considered normal weight, BMI 25–29.9 kg/m2 considered overweight, and BMI ≥ 30 kg/m2 considered obese. Finally, CKD was defined as estimated glomerular filtration rate <60 mL/min/1.73 m2 calculated using the 2021 CKD-EPI Creatinine Formula.18
Statistical analysis
NHANES data were weighted and extrapolated to estimate the prevalence of HTN subtypes in the adult noninstitutionalized US population. Weighting methodology was informed by guidelines from the National Center for Health Statistics.19 The incidence of CVD and all-cause mortality was examined and compared between hypertension subtypes against participants with normal blood pressure using Cox regression analysis, adjusted for age, ethnicity, sex, tobacco use, use of antihypertensive agents, and comorbidities including DM, CKD, and dyslipidemia. Cox proportional hazards assumptions were tested through generation of Kaplan Meier curves, which were then assessed for any significant overlap between subgroups. Statistical significance was defined as P-value < 0.05.
Mortality data from the National Death Index were linked to NHANES datasets and classified according to ICD-10 codes. CVD death was defined as ICD-10 codes of I00-I09, I11, I13, I20-I51, and I60-I69. Statistical analyses were performed with SAS statistical software (version 9.4; SAS Institute, Cary, NC).
RESULTS
Burden of hypertension and its subtypes
A total of 58,744 adults were surveyed in NHANES years 1999–2020, out of which 52,385 had valid blood pressure readings and were included in the analysis. Of these, 47.4% (27,367 individuals projected to 98 million US adults) met criteria for HTN per ACC/AHA guidelines. Of adults with HTN, 41.0% had ISH, 33.0% had SDH, and 26.0% had IDH (Table 1). Individuals aged 50 or older comprised 62% of all adults with HTN. Compared with adults under the age of 50 with HTN, individuals aged 50 years or older with HTN maintained a significantly higher prevalence of ISH (55% vs. 20%, P < 0.0001). Diastolic HTN, whether as IDH or together with systolic HTN in SDH, comprised the majority of HTN subtypes in adults up to age 59, constituting 76%, 83%, and 67% of HTN in the <40, 40–49, and 50–59 age groups, respectively. Meanwhile, ISH rapidly became the predominant HTN subtype above the age of 60, comprising 84% of all HTN in adults aged 80+. In adults aged 50 or older with HTN, average SBP was 139 mmHg compared with 130 mmHg in adults younger than 50 with HTN, while average DBP values were 71 and 81 mmHg, respectively. Figure 1 showed the prevalence of HTN subtypes across age groups.
Prevalence of hypertension subtypes and demographic characteristics among US adults with hypertension, NHANES 1999–2020
| Isolated systolic hypertension | Isolated diastolic hypertension | Systolic-diastolic hypertension | |
|---|---|---|---|
| Total (N = 27,367) | 41.0% | 26.0% | 33.0% |
| Age | |||
| <40 | 11.4% | 39.2% | 17.3% |
| 40–49 | 7.9% | 33.3% | 23.6% |
| 50–59 | 17.2% | 20.2% | 28.9% |
| 60–69 | 24.7% | 6.1% | 19.0% |
| 70–79 | 23.6% | 1.1% | 7.7% |
| 80+ | 15.2% | 0.2% | 3.5% |
| Sex | |||
| Male | 47.0% | 60.2% | 55.3% |
| Female | 53.0% | 39.8% | 44.7% |
| Ethnicity | |||
| Hispanic | 10.6% | 11.3% | 11.8% |
| White | 71.7% | 70.0% | 64.1% |
| Black | 12.1% | 11.0% | 16.9% |
| Other | 5.6% | 8.1% | 7.2% |
| Tobacco Use | |||
| Current | 16.8% | 19.8% | 21.9% |
| Former | 33.1% | 24.8% | 27.7% |
| Never | 50.2% | 55.4% | 50.4% |
| Body Mass Index | |||
| <30 | 60.0% | 53.6% | 53.0% |
| 30+ | 40.0% | 46.4% | 47.0% |
| On treatment | 50.7% | 21.3% | 44.5% |
| Dyslipidemia | 52.4% | 56.3% | 57.3% |
| Diabetes mellitus | 24.0% | 9.0% | 16.1% |
| Chronic kidney disease | 20.2% | 6.1% | 11.3% |
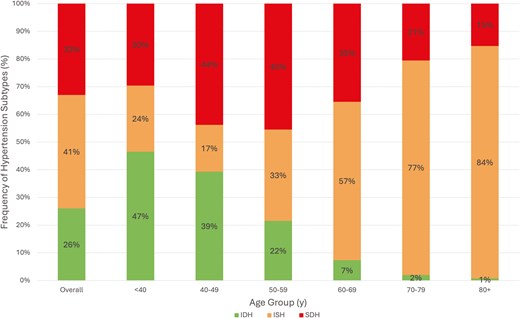
Prevalence of hypertension subtypes by age in US adults. ISH = Isolated Systolic Hypertension, IDH = Isolated Diastolic Hypertension, SDH = Systolic-Diastolic Hypertension.
Untreated hypertension accounted for 30.3% of adults with HTN (projected to 14 million US adults). Another 45.4% of all adults with HTN were treated to a blood pressure of <130/80 mmHg (projected to 21 million US adults). Across increasing age, there was a decreasing prevalence of IDH, increasing prevalence of ISH, and increasing prevalence of SDH which peaked in the 6th decade of life, but decreased afterward. While IDH comprised over 47% of all HTN in those under age 40, ISH comprised over 84% of HTN in those aged 80 and over. Mild variation in HTN subtype prevalence among sexes was demonstrated in Figure 2; while the proportion of SDH was similar in all age groups, there was a trend toward more IDH in men and more ISH in women, particularly in the 6th and 7th decades of life. Figure 3 illustrated HTN subtype prevalence among age groups and ethnicities, showing that non-Hispanic Black and Hispanic demographics exhibited higher prevalence of ISH and SDH (and consequently lower prevalence of IDH) up until the 5th decade of life, after which these differences attenuated significantly. Finally, Figure 4 depicted trends of HTN and subtype prevalence over time across 2-year NHANES survey cycles. While the relative frequencies of HTN subtypes varied between cycles, NHANES 2017–2020 saw a notable shift with an increase in the prevalence of SDH as a proportion of all adults to 20% and a decrease in the prevalence of ISH to 14%.
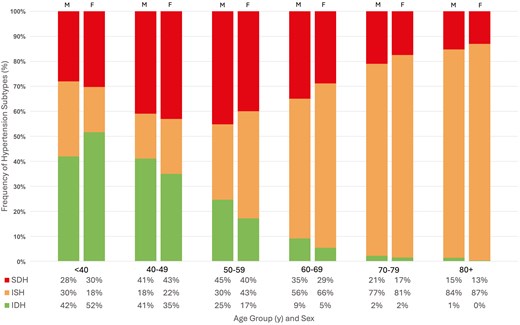
Prevalence of hypertension subtypes by age and sex in US adults. M = Male, F = Female, ISH = Isolated Systolic Hypertension, IDH = Isolated Diastolic Hypertension, SDH = Systolic-Diastolic Hypertension.
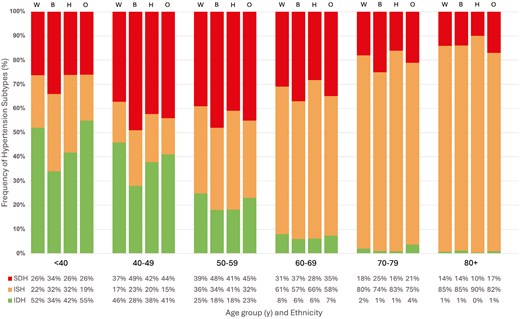
Prevalence of hypertension subtypes by age and ethnicity in US adults. W = Non-Hispanic White, B = Non-Hispanic Black, H = Hispanic, O = Other, ISH = Isolated Systolic Hypertension, IDH = Isolated Diastolic Hypertension, SDH = Systolic-Diastolic Hypertension.
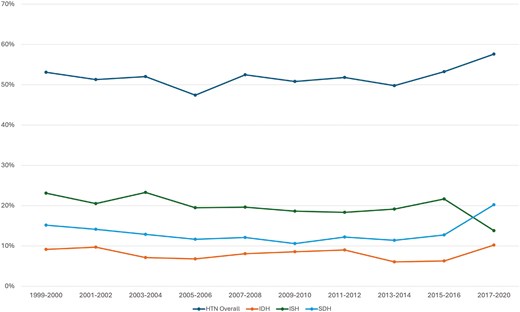
Prevalence of hypertension and hypertension subtypes over time. P < 0.0001 Across 2-year cycles. HTN = Hypertension, IDH = Isolated Diastolic Hypertension, ISH = Isolated Systolic Hypertension, SDH = Systolic-Diastolic Hypertension.
Hypertension subtypes as predictors of cardiovascular and all-cause mortality
For mortality analysis, the baseline cohort using NHANES data from years 1999–2008 contained 26,246 adults, of which 23,231 had valid BP readings and were included in the analysis. Of these, 61% had normal BP, 16% had ISH, 10% had IDH, and 12% had SDH. Median length of follow-up was 14.3 years. In adjusted mortality analyses compensating for age, sex, race/ethnicity, tobacco use, DM, dyslipidemia, CKD, BMI, and use of antihypertensive agents, ISH and SDH were both significantly associated with increased CVD (hazard ratio [HR] = 1.18, 95% confidence interval [CI] 1.01–1.38, P < 0.05; HR = 1.31, 95% CI, 1.07–1.60, P < 0.01, respectively) and all-cause mortality (HR = 1.17, 95% CI, 1.06–1.28, P < 0.01; HR = 1.21, 95% CI, 1.08–1.37, P < 0.01, respectively). IDH was associated with a protective effect for CVD (HR = 0.69, 95% CI, 0.50–0.95, P < 0.05) and all-cause mortality (HR = 0.72, 95% CI, 0.60–0.88, P < 0.05) in the unadjusted analysis, but when adjusted for the above factors, there was no significant association with mortality risk. Analysis of interactions between use of antihypertensive therapy and HTN subtype found interaction P < 0.05 for ISH and SDH in relation to CVD mortality as well as interaction P < 0.01 for ISH and SDH in relation to all-cause mortality. In untreated subjects (74%), ISH and SDH portended increased risk for both CVD (HR = 1.22, 95% CI, 0.96–1.56 and HR = 1.41, 95% CI, 1.02–1.94, respectively) and all-cause mortality (HR = 1.19, 95% CI, 1.06–1.34 and HR = 1.27, 95% CI, 1.08–1.48, respectively) when compared with individuals on antihypertensive therapy (26%) (HR = 1.14, 95% CI, 0.95–1.37 and HR = 1.16, 95% CI, 0.91–1.47, respectively, for CVD mortality; HR = 1.13, 95% CI, 1.00–1.28 and HR = 1.12, 95% CI, 0.94–1.33, respectively, for all-cause mortality). Table 2 outlined both adjusted and unadjusted HRs for CVD and all-cause mortality according to HTN subtype.
Unadjusted and adjusted hazard ratios for cardiovascular and all-cause mortality by hypertension subtype, NHANES 1999–2008
| Cardiovascular mortality | All-cause mortality | |||
|---|---|---|---|---|
| Hypertension Subtype | Unadjusted HR (95% CI) | Adjusted HR (95% CI) | Unadjusted HR (95% CI) | Adjusted HR (95% CI) |
| Normotension | 1.00 | 1.00 | 1.00 | 1.00 |
| ISH | 5.92*** (5.10–6.86) | 1.18* (1.01–1.38) | 4.85*** (4.46–5.27) | 1.17** (1.06–1.28) |
| IDH | 0.69* (0.50–0.95) | 1.04 (0.74–1.47) | 0.72* (0.60–0.88) | 0.96 (0.79–1.16) |
| SDH | 2.71*** (2.23–3.30) | 1.31** (1.07–1.60) | 2.30*** (2.05–2.58) | 1.21** (1.08–1.37) |
Adjusted model accommodating for age, sex, ethnicity, tobacco use, diabetes mellitus, dyslipidemia, chronic kidney disease, body-mass index, and antihypertensive therapy.
*P < 0.05,
**P < 0.01,
***P < 0.0001.
When considering mortality risk in individuals who were reclassified to HTN stages according to the 2017 ACC/AHA guidelines, elevated blood pressure (SBP 120–129 mmHg, DBP < 80 mmHg) was not associated with increased CVD or all-cause mortality when adjusted for the above risk factors (P = 0.455 and 0.161, respectively) (Table 3). Individuals with stage I HTN did not have a significantly increased risk for CVD mortality (HR = 1.13, 95% CI, 0.95–1.35, P = 0.161) but experienced significantly increased risk for all-cause mortality (HR = 1.14, 95% CI, 1.00–1.28, P = 0.043) when compared with adults with normal BP (Table 3).
Unadjusted and adjusted hazard ratios for cardiovascular and all-cause mortality by hypertension stage, NHANES 1999–2008
| Cardiovascular mortality | All-cause mortality | |||
|---|---|---|---|---|
| Hypertension stage | Unadjusted HR (95% CI) | Adjusted HR (95% CI) | Unadjusted HR (95% CI) | Adjusted HR (95% CI) |
| Normotension | 1.00 | 1.00 | 1.00 | 1.00 |
| Elevated blood pressure | 1.89*** (1.52–2.34) | 1.08 (0.88–1.33) | 1.79*** (1.57–2.05) | 1.10 (0.96–1.25) |
| Stage I | 3.67*** (3.08–4.37) | 1.13 (0.95–1.35) | 3.22*** (2.85–3.63) | 1.14* (1.00–1.28) |
| Stage II | 7.90*** (6.41–9.74) | 1.40** (1.37–1.72) | 6.11*** (5.49–6.80) | 1.31** (1.17–1.47) |
Adjusted model accommodating for age, sex, ethnicity, tobacco use, diabetes mellitus, dyslipidemia, chronic kidney disease, body-mass index, and antihypertensive therapy.
*P < 0.05,
**P < 0.01,
***P < 0.0001.
Adjusted Cox regression analyses by sex found no increased risk of CVD mortality in the male (n = 10,937, projected to 92 million) cohort for any HTN subtype compared with normal BP, while women (n = 11,764, projected to 99 million) exhibited increased risk in SDH (HR = 1.35, 95% CI, 1.02–1.79, P = 0.04). For all-cause mortality, men were found to have increased all-cause mortality risk with ISH (HR = 1.16, 95% CI, 1.00–1.34, P = 0.05) and SDH (HR = 1.28, 95% CI, 1.09–1.50, P < 0.01), while women demonstrated increased risk in ISH only (HR = 1.15, 95% CI, 1.03–1.28, P = 0.01). Of note, the interaction terms for sex with HTN subtypes for both CVD and all-cause mortality were P > 0.05. In the adjusted subgroup analysis by ethnicity, ISH conferred increased risk for all-cause mortality only in Hispanic and non-Hispanic White individuals (HR = 1.32, 95% CI, 1.05–1.67, P = 0.02; HR = 1.13, 95% CI, 1.02–1.25, P = 0.02, respectively). Non-Hispanic Black individuals with SDH exhibited increased risk for both all-cause (HR = 1.26, 95% CI, 1.03–1.55, P = 0.02) and CVD (HR = 1.74, 95% CI, 1.28–2.37, P < 0.001) mortality, respectively. Importantly, this analysis produced interaction terms P < 0.05 between ethnicities and risk for both CVD and all-cause mortality, specifically for ISH and SDH. Inter-group variation in CVD and all-cause mortality risk for IDH was not statistically significant.
DISCUSSION
The results of our analysis offer a detailed view of HTN subtype prevalence in the US adult population from 1999 to 2018 using contemporary definitions of HTN per the 2017 ACC/AHA HTN guidelines. We demonstrate that ISH remains the predominant HTN subtype in adults aged ≥ 50 years and is consistent with prior analyses including that of Franklin et al.2 from a much earlier cohort spanning NHANES years 1988–1994. We have further examined HTN subtype prevalences and mortality relationships according to sex and ethnicity. Redefinition of HTN treatment targets according to the 2017 ACC/AHA guidelines increases the total number of individuals with HTN (from a projected 42.7 million US adults [24%] per Franklin et al. to a projected 98 million US adults [47%] in our analysis), consistent with other contemporary analyses of the NHANES dataset.20 Compared with the earlier Franklin et al. analysis of NHANES III data,2 our analysis using the 2017 ACC/AHA guidelines for HTN cutoffs decreases the prevalence of ISH (64.9%–41%) and increases the prevalence of SDH (21.2%–33%) and IDH (14%–26%). Prior analyses of contemporary NHANES data have also shown similar trends in HTN subtype prevalence following transition to the updated 2017 ACC/AHA cutoff for HTN, however centered only on US population trends in IDH prevalence.21 Few studies report comprehensively on the breakdown of HTN subtype prevalence in the US adult population, although our data demonstrate similar trends to other analyses from East Asian populations.22 The weighted prevalence of IDH reported here is also similar to an analysis of the UK Biobank 2006–2010.23 Nearly half of all adults with HTN in our analysis were successfully treated to a BP of <130/80 mmHg, demonstrating improving domestic awareness of HTN that is consistent with prior studies of HTN treatment and awareness trends both in the United States24 and worldwide.25,26 Analysis of temporal trends among HTN subtypes revealed significant changes across NHANES cycles (Figure 4), but the relative prevalence of subtypes remained similar in most years with ISH being the most common, followed by SDH then IDH. However, this balance shifted in NHANES 2017–2020, with SDH suddenly becoming more common than ISH. This unexpected increase in diastolic HTN has been reflected in a prior analysis of contemporary NHANES by Muntner et al. which demonstrated the mean DBP among adults with HTN to increase from 73 mmHg from NHANES 2009–2016 to 78 mmHg in 2017–2020.11 The etiology of this significant temporal shift may be multifactorial and related to demographic changes, increasing prevalence of comorbid conditions such as obesity that predispose to diastolic HTN, and impacts of the COVID-19 pandemic on BP control and antihypertensive therapy adherence. More research is needed to determine whether this trend continues beyond the prepandemic cycles.
To our knowledge, our subgroup analyses by sex and ethnicity also constitute the first assessment of inter-group variance in mortality risk by HTN subtype. Cox regression analyses in sex-specific cohorts showed only nominal differences in mortality risk between HTN subtypes, and the interaction P > 0.05 suggests the lack of significant sex differences in the relation of HTN subtypes to mortality. This is consistent with prior work indicating the prognostic value of elevated BP in both genders, or even the presence of elevated CVD mortality risk at lower SBP in women.27 Previous work has already demonstrated significant differences in HTN prevalence, awareness, and BP control amongst ethnic groups.28,29 Our analysis further reveals a higher propensity for all-cause and CVD mortality in non-Hispanic Black US adults in particular with systolic HTN when compared with other ethnic groups. Persistent awareness and treatment disparities should be addressed in future research with special consideration of the role social determinants of health play in HTN prevalence and CVD outcomes.
SDH and ISH demonstrate significant associations with cardiovascular and all-cause mortality, while IDH is not significantly associated with either cardiovascular or all-cause mortality when adjusted for covariates. The lack of association between IDH and mortality or excess CVD has been well documented in other analyses.21,23,30 SBP as the primary determinant of mortality risk in individuals with HTN is well-documented for adults above the age of 50, although some data suggest that the mortality correlation for DBP is more pronounced in younger individuals.31 Other studies have demonstrated that widened pulse pressure characterized by DBP < 70 mmHg in the setting of ISH represents an independent risk factor for increased CVD events.32–34 In the clinical setting, special attention must therefore be paid to controlling both SBP and DBP with both lifestyle and pharmacologic interventions. In elderly individuals with ISH, SBP reduction must be pursued with concomitant consideration for excessively low DBP or elevated pulse pressure, both of which may represent increased arterial stiffness and risk for CVD events. First-line antihypertensive agents should be initiated early and in combination with alternate agents for dual therapy if tolerated, with consideration for the presence of comorbid conditions and certain drug combinations that have been demonstrated to be more effective in reducing CVD events compared with others.35 More research is needed to quantify the mortality risk for HTN subtypes in populations with specific comorbidities (e.g., DM, CKD) that are independently associated with arterial stiffness and development of CVD.
Our observational study has several limitations. First, due to the nature of cross-sectional studies, associations demonstrated between covariates do not necessarily reflect causal relationships. Second, despite efforts to control for confounding variables through statistical methods, residual confounding remains a concern, as unmeasured or unknown factors (including antihypertensive therapy or other potentially relevant comorbidities that were not controlled for in our analysis) may influence the observed associations. However, it should be noted that most of the trends reported in this study are consistent with other analyses of both United States and non-United States populations. Finally, the subgroup analyses conducted for sex and ethnicity may be limited by subgroup sample size and thus not powered to detect smaller associations with all-cause and CVD mortality risk. Given the methods of the NHANES survey, we were also not able to control for other social factors including socioeconomic status and health literacy in our analysis.
Our analysis demonstrates using the revised 2017 ACC/AHA cut points for HTN that IDH remains the predominant HTN subtype in young persons and ISH the predominant subtype in older persons, with SDH peaking in the 6th decade of life. ISH and SDH also remain most strongly predictive of CVD and total mortality. Further work is needed to demonstrate whether treatment approaches could be better informed by consideration of HTN subtype to improve CVD outcomes in those with HTN.
Author contributions
K.S.T. and J.E.J. contributed to writing, editing, and data analysis. N.D.W. conceived of the project. N.D.W. and W.F. contributed to editing and oversight. Each author contributed important intellectual content during manuscript drafting or revision and accepts accountability for the overall work by ensuring that questions pertaining to the accuracy or integrity of any portion of the work are appropriately investigated and resolved. No artificial intelligence tools or assistive writing technologies were used in the writing of this manuscript.
Funding
This work was supported by the Stanley S. Franklin MD Memorial Endowment Fund for Hypertension and Heart Disease Prevention Research from the University of California, Irvine.
Conflict of Interest
Dr Wong receives research funding not related to the current study from Novartis, Regeneron, and Novo Nordisk and is a consultant for Amgen, Novartis, Ionis, and Heart Lung. The remaining authors disclose no conflicts of interest.
