


Abstract
The risk of developing hypertension in young adults and its relationship to modifiable lifestyle factors are unclear. We aimed to examine the association of cardiovascular health (CVH) metrics with the risk of hypertension.
We analyzed 66,876 participants aged 20–39 years, with available blood pressure (BP) data for 5 consecutive years, who had normal or elevated BP at the initial health check-up, enrolled in the JMDC Claims Database. Ideal CVH metrics included nonsmoking, body mass index <25 kg/m2, physical activity at goal, optimal dietary habits, untreated fasting glucose <100 mg/dL, and untreated total cholesterol <200 mg/dL. The primary endpoint was defined as stage 1 or stage 2 hypertension. We defined normal BP, elevated BP, stage 1 hypertension, and stage 2 hypertension according to the 2017 American College of Cardiology/American Heart Association (ACC/AHA) BP guideline.
The median age was 35 years, and 62% were men. Number of non-ideal CVH metrics was associated with an increasing risk for the development of stage 1 and stage 2 hypertension. Non-ideal body mass index was most strongly associated with a risk for hypertension. This association was more pronounced in women. An annual increase in the number of non-ideal CVH metrics was associated with an elevated risk for the hypertension development.
CVH metrics can stratify the risk for hypertension in non-hypertensive adults aged 20–39 years. These findings have important public health implications for the screening and prevention of hypertension. Improving CVH metrics may prevent the risk of developing hypertension in young adults.

Hypertension is a major risk factor for cardiovascular disease (CVD).1–3 Most hypertensive patients are asymptomatic, and are only diagnosed through blood pressure (BP) measurements at screening, like during health check-ups. The updated US Preventive Services Task Force recommendations include an annual screening for hypertension in adults aged ≥40 years or those at high risk for hypertension, as well as screening every 3–5 years for normotensive adults aged 18–39 years who are not at increased risk for hypertension.4 However, available data on optimal screening for hypertension are limited.5 In particular, data on the rates and determinants of transition to hypertension in non-hypertensive young adults are scarce. We hypothesized that the various cardiovascular health (CVH) metric components could help to identify young people at high risk for developing hypertension. Here, we studied 66,876 people aged 20–39 years with BP data at annual health check-ups for 5 consecutive years, and examined the association between their baseline CVH metrics and the risk of transition to hypertension.
METHODS
We performed this observational cohort study using data from the JMDC Claims Database (JMDC; Tokyo, Japan) between January 2005 and April 2020.6–8 The JMDC Claims Database includes annual health check-up records, including BP measurement, a questionnaire regarding medical history, lifestyle, current medications, and fasting laboratory data. We extracted BP data from 397,193 individuals for 5 consecutive years. After excluding 2,287 individuals aged <20 years, 305,391 individuals aged ≥40 years, 561 individuals with prior CVDs, and hemodialysis, 2,554 individuals with incomplete history of CVD, and hemodialysis, 14,445 and 4,858 individuals having baseline stage 1 and stage 2 hypertension, respectively, and 221 individuals with baseline antihypertensive medications, 66,876 participants were included in this analysis (Supplementary Figure 1 online).
The primary endpoint was defined as stage 1 or stage 2 hypertension based on the BP categories defined in the 2017 American College of Cardiology/American Heart Association (ACC/AHA) BP guideline.9 Stage 1 and stage 2 hypertension were defined as systolic (SBP) or diastolic BP (DBP) of 130–139 or 80–89 mm Hg, and ≥140 or ≥ 90 mm Hg, respectively. Participants taking antihypertensive medications were classified as having stage 2 hypertension, regardless of BP values. Participants developing stage 2 hypertension were automatically included into those developing stage 1 hypertension as well. Given the high specificity of office BP measurements,10 the diagnosis with stage 1 or stage 2 hypertension was fixed. For example, if an individual was diagnosed with stage 2 hypertension at 1 year after the initial health check-up, we used this diagnosis at 2, 3, 4, and 5 years after the initial health check-up (irrespective of their follow-up BP levels).
We conducted this study based on the ethical guidelines of the University of Tokyo (approval number: 2018-10862) in accordance with the principles of the Declaration of Helsinki. The requirement for informed consent was waived because all data were anonymized and de-identified.
In the Japanese health check-up system, healthcare professionals measure the BP using a standard sphygmomanometer or an automated device at least twice after the participant has been in a resting condition, and the average is recorded.6,11 Detailed methods for BP measurement were described in Supplementary Material (online). Participants were categorized as having normal BP or elevated BP based on the 2017 ACC/AHA BP guidelines.9 The normal BP group included participants with untreated SBP <120 mm Hg and untreated DBP <80 mm Hg. The elevated BP group included participants with untreated SBP 120–129 mm Hg and untreated DBP <80 mm Hg. Other data, including a questionnaire on prior medical history and lifestyle, BMI, and fasting laboratory values, were collected using standardized protocols across study centers. We modified the AHA definitions of CVH metrics to fit the database, based on our previous studies.7,12Supplementary Table 1 (online) lists the original AHA definitions and the modified definitions used in this study. Ideal CVH metrics were: BMI <25 kg/m2; smoking status: not smoking (never smoked or prior smoker); physical activity: 30 minutes of exercise two or more times a week or ≥1 hour walk per day; eating habits: skipping breakfast <3 times per week; fasting plasma glucose level <100 mg/dL; and total cholesterol level <200 mg/dL. For unavailable total cholesterol data, we calculated it using low-density lipoprotein cholesterol, high-density lipoprotein cholesterol, and triglyceride measurements.
Continuous and categorical variables were expressed as medians (interquartile ranges) and numbers (percentages), respectively, and were compared using 1-way analysis of variance and chi-square between 7 groups according to the number of non-ideal CVH metrics. Odds ratios (ORs) of the number of non-ideal CVH metrics for transition to stage 1 or stage 2 hypertension at 1, 2, 3, 4, and 5 years after the initial health check-up were adjusted for age, sex, and baseline BP classification. We also adjust the association of the number of non-ideal CVH metrics for transition to stage 1 or stage 2 hypertension for alcohol consumption (drinking alcohol every day or not every day). We included 6 CVH metric components, age, sex, and baseline BP classification in the multivariable logistic regression analysis to identify the association of each metric component with the risk of transition to stage 1 or stage 2 hypertension annually for 5 years after the initial health check-up. We performed subgroup analyses stratified by sex. We calculated the P values for interactions between men and women regarding the relationship between the number of non-ideal CVH metrics and the risk of hypertension development using a multivariable model. We analyzed 54,007 participants who maintained normal BP or had elevated BP and had data for the repeat assessment of CVH metrics at 1 year after the initial health check-up to examine the association between the change in CVH metrics and the risk for the development of hypertension.
We conducted 5 sensitivity analysis. First, we included SBP instead of baseline BP classification in multivariable model. Second, we extracted 41,278 individuals with available data on estimated glomerular filtration rate and adjusted the relationship between CVH metrics and the risk of hypertension for estimated glomerular filtration rate in the multivariable model. Third, because non-ideal BMI was most strongly associated with the risk of developing hypertension, we recalculated CVH metrics, giving 2 points for non-ideal BMI and 1 point for other components. Fourth, we included 112,495 individuals who underwent a repeated health check-up at least once within 5 years after the initial health check-up for result validation, and we performed logistic regression analysis to examine the association of the number of non-ideal CVH metrics or each component of CVH metrics with the risk of transition to stage 1 or stage 2 hypertension, and calculated a propensity score for the presence of participant censoring and the inverse weighting probability.13,14 We calculated the standard errors in the weighted analysis using robust variance estimation. Fifth, using the dataset including 112,495 individuals in the fourth sensitivity analysis, we also performed Cox regression analysis and calculated hazard ratios (95% confidence interval (CI)) of the number of non-ideal CVH metrics or each component of CVH metrics for the risk of transition to stage 1 or stage 2 hypertension.
Statistical significance was set at P <0.05. Statistical analyses were performed using SPSS software (version 25; SPSS Inc., Chicago, IL) and STATA (version 17; StataCorp LLC, College Station, TX).
RESULTS
Characteristics of the study population are shown in Table 1. The median age was 35 years (interquartile range: 30–38 years), and 41,600 participants (62.2%) were men. The median (interquartile range) number of non-ideal CVH metrics was 2 (1–2). Ideal BMI and fasting plasma glucose level were observed in 57,719 (86.3%) and 61,970 (92.7%) participants, respectively. Meanwhile, <40% of the participants had an ideal physical activity status. Participants with better CVH status were younger and predominantly women compared to those with worse CVH status. Clinical characteristics of study participants at baseline and the end of the study period are given in Supplementary Table 2 (online).
Clinical characteristics
| Number of non-ideal cardiovascular health metrics | ||||||||
|---|---|---|---|---|---|---|---|---|
| 0 (n = 8,565) | 1 (n = 23,642) | 2 (n = 19,723) | 3 (n = 10,246) | 4 (n = 3,721) | 5 (n = 879) | 6 (n = 100) | P-value | |
| Body mass index, non-ideal, n (%) | 0 (0) | 760 (3.2) | 2,505 (12.7) | 3,054 (29.8) | 1,983 (53.3) | 755 (85.9) | 100 (100) | — |
| Total cholesterol, non-ideal, n (%) | 0 (0) | 3,679 (15.6) | 9,170 (46.5) | 6,191 (60.4) | 3,088 (83.0) | 828 (94.2) | 100 (100) | — |
| Fasting glucose, non-ideal, n (%) | 0 (0) | 442 (1.9) | 1,294 (6.6) | 1,473 (14.4) | 1,110 (29.8) | 487 (55.4) | 100 (100) | — |
| Smoking, non-ideal, n (%) | 0 (0) | 2,240 (9.5) | 6,537 (33.1) | 6,272 (61.2) | 2,896 (77.8) | 778 (88.5) | 100 (100) | — |
| Eating habit, non-ideal, n (%) | 0 (0) | 1,674 (7.1) | 5,344 (27.1) | 5,477 (53.5) | 2,550 (68.5) | 722 (82.1) | 100 (100) | — |
| Physical activity, non-ideal, n (%) | 0 (0) | 14,847 (62.8) | 14,596 (74.0) | 8,271 (80.7) | 3,257 (87.5) | 825 (93.9) | 100 (100) | — |
| Normal BP, n (%) | 7,020 (82.0) | 19,466 (82.3) | 15,295 (77.5) | 7,321 (71.5) | 2,437 (65.5) | 524 (59.6) | 54 (54.0) | <0.001 |
| Elevated BP, n (%) | 1,545 (18.0) | 4,176 (17.7) | 4,428 (22.5) | 2,925 (28.5) | 1,284 (34.5) | 355 (40.4) | 46 (46.0) | <0.001 |
| Systolic blood pressure, mm Hg | 109 (101–117) | 109 (102–117) | 111 (104–118) | 114 (106–120) | 115 (108–122) | 117 (110–123) | 119 (110–124) | — |
| Diastolic blood pressure, mm Hg | 66 (60–70) | 66(60–71) | 67 (62–72) | 69 (64–74) | 70 (65–75) | 72 (67–76) | 72 (67.5–75) | — |
| Age, years | 35 (28–38) | 35 (29–38) | 35 (30–38) | 36 (32–38) | 36 (34–39) | 37 (35–39) | 38 (36–39) | — |
| Men, n (%) | 4,400 (51.4) | 11,773 (49.8) | 12,913 (65.5) | 8,291 (80.9) | 3,312 (89.0) | 815(92.7) | 96 (96.0) | <0.001 |
| Body mass index, kg/m2 | 20.5 (19.1–22.0) | 20.6 (19.0–22.3) | 21.4 (19.7–23.4) | 22.7 (20.5–25.4) | 25.1 (22.1–26.9) | 26.6 (25.4–28.6) | 26.8 (25.8–28.7) | <0.001 |
| Total cholesterol, mg/dL | 172 (158–185) | 178 (161–193) | 196 (172–216) | 205(182–225) | 217 (204–236) | 225 (210–244) | 241 (222–261) | <0.001 |
| Fasting glucose, mg/dL | 86 (82–91) | 86 (82–91) | 87 (83–92) | 89 (84–95) | 92 (86–101) | 100 (89–106) | 108 (102–119) | <0.001 |
Abbreviation: BP = blood pressure. Data are presented as median (interquartile range) for continuous variables or numbers (percentages) for categorical variables. Continuous and categorical variables were compared using 1-way analysis of variance and chi-square between 7 groups based on the number of non-ideal cardiovascular health metrics.
Figure 1 compares the annual rates of transition to stage 1 hypertension (Figure 1a) or stage 2 hypertension (Figure 1b) for 5 years after the initial health check-up between the number of non-ideal CVH metrics. These increased every year. Overall, the transition rates to stage 1 and stage 2 hypertension increased from 11.7% and 1.2% at 1 year after the initial check-up to 34.9% and 6.4% at 5 years after the initial health check-up. The progression rate to stage 1 or stage 2 hypertension increased with the increasing number of non-ideal CVH metrics. The concrete number of individuals developing hypertension is presented in Supplementary Table 3 (online). Even after adjustment for age, sex, and baseline BP category (normal BP or elevated BP), the number of non-ideal CVH metrics was associated with the risk for stage 1 or stage 2 hypertension development (Figure 2). The ORs per 1-point increase in the number of non-ideal CVH metrics for stage 1 and stage 2 hypertension at 1 year after the initial health check-up were 1.21 (95% CI: 1.19–1.24) and 1.31 (95% CI: 1.24–1.39), respectively. Even after adjustment for alcohol consumption, our main results did not change (Supplementary Figure 2 online).
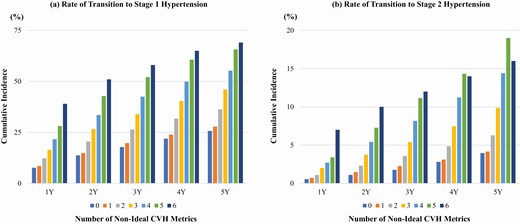
Rate of transition to hypertension. Figure 1 compares the annual rates of transition to stage 1 hypertension (a) or stage 2 hypertension (b) for 5 years after the initial health check-up between the number of non-ideal CVH metrics. Abbreviation: CVH = cardiovascular health.
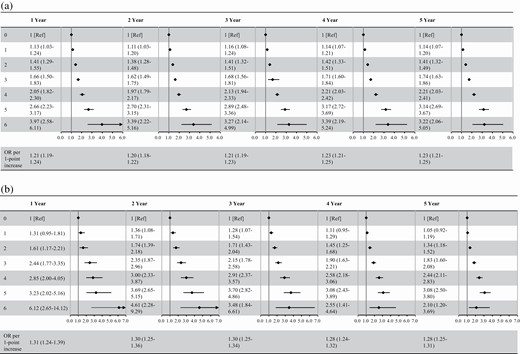
Odds ratios of the number of non-ideal cardiovascular health metrics for progression to hypertension. Odds ratios of the number of non-ideal cardiovascular health metrics for progression to stage 1 hypertension (a) and stage 2 hypertension (b) are summarized. Odds ratios (95% confidence interval) are shown. Odds ratios were calculated after adjustment for age, sex, and baseline blood pressure category.
Figure 3 presents the relationship between each CVH metric component and the risk of transition to stage 1 or stage 2 hypertension. Non-ideal BMI, total cholesterol, and fasting glucose were associated with an elevated risk of transition to stage 1 or stage 2 hypertension at all time points. Non-ideal BMI showed a 2- to 3-fold increased risk for stage 1 or stage 2 hypertension, and the corresponding ORs were higher than those of non-ideal total cholesterol and fasting glucose.
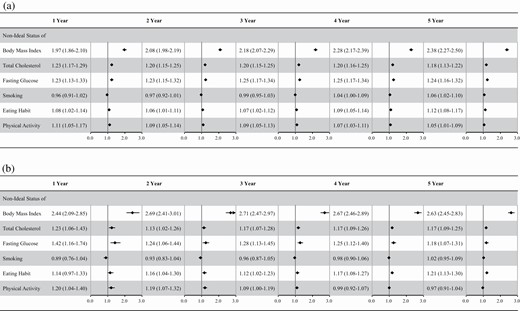
Odds ratios of each component of cardiovascular health metrics for progression to hypertension. Odds ratios of each component of cardiovascular health metrics for progression to stage 1 hypertension (a) and stage 2 hypertension (b) are summarized. Odds ratios (95% confidence interval) are shown. Odds ratios were calculated after adjustment for age, sex, and baseline blood pressure category.
Supplementary Figure 3 (online) summarizes the cumulative incidence rates of transition to stage 1 hypertension (Supplementary Figure 3A online) or stage 2 hypertension (Supplementary Figure 3B online) for 5 years after the initial health check-up according to the number of non-ideal CVH metrics among women and men. The cumulative incidence of stage 1 and stage 2 hypertension was consistently higher in men than in women. The results of subgroup analyses stratified by sex are shown in Supplementary Tables 4 and 5 (online). Higher numbers of non-ideal CVH metrics were associated with increased risk of transition to stage 1 or stage 2 hypertension at all time points in both women and men (Supplementary Table 4 online). P values for interactions were all statistically significant between women and men. ORs of non-ideal BMI for risk of stage 1 or stage 2 hypertension were higher in women than in men at all time points (Supplementary Table 5 online).
We analyzed data from 54,007 participants who maintained normal BP or had elevated BP and had data on CVH metrics at 1 year after the initial health check-up. A 1-point increase in the number of non-ideal CVH metrics was associated with an elevated risk for the transition to stage 1 or stage 2 hypertension annually at 2–5 years after the initial health check-up (Table 2). The ORs of a 1-point increase in the number of non-ideal CVH metrics for stage 1 or stage 2 hypertension at 2 years after the initial health check-up after adjusting for age, sex, baseline BP category, and the number of non-ideal CVH metrics at the initial health check-up were 1.13 (95% CI: 1.09–1.18) or 1.21 (95% CI: 1.05–1.38), respectively.
Association between the change in the number of non-ideal CVH metrics between baseline and year 1 and the subsequent risk of transition to hypertension
| Year 2 | Year 3 | Year 4 | Year 5 | |||||
|---|---|---|---|---|---|---|---|---|
| Stage 1 HTN | Stage 2 HTN | Stage 1 HTN | Stage 2 HTN | Stage 1 HTN | Stage 2 HTN | Stage 1 HTN | Stage 2 HTN | |
| Unadjusted | 1.05 (1.01–1.09) | 1.13 (0.98–1.29) | 1.06 (1.03–1.09) | 1.07 (0.98–1.18) | 1.05 (1.02–1.07) | 1.08 (1.01–1.16) | 1.05 (1.03–1.08) | 1.06 (1.00–1.12) |
| Adjusted | 1.13 (1.09–1.18) | 1.21 (1.05–1.38) | 1.16 (1.12–1.19) | 1.19 (1.09–1.30) | 1.16 (1.13–1.19) | 1.21 (1.12–1.30) | 1.16 (1.13–1.19) | 1.19 (1.12–1.26) |
Abbreviations: CVH, cardiovascular health; HTN, hypertension. Unadjusted odds ratios (ORs) of 1-point increase in the number of non-ideal CVH metrics were adjusted for age, sex, blood pressure category (normal blood pressure or elevated blood pressure), and the number of non-ideal CVH metrics at the initial health check-up. ORs (95% confidence interval) were shown.
Sensitivity analyses
First, after adjustment for SBP instead of baseline BP classification, the association of CVH metrics with incident stage 1 and stage 2 hypertension was consistent (Supplementary Table 6 online). Second, the relationship between CVH metrics and incident stage 1 or stage 2 hypertension was unchanged after adjustment for estimated glomerular filtration rate (Supplementary Table 7 online). Third, even after recalculating CVH metrics, giving 2 points for non-ideal BMI, the number of non-ideal CVH metrics was associated with the increasing risk of developing stage 1 or stage 2 hypertension (Supplementary Table 8 online). Fourth, we studied 112,495 individuals who underwent repeated health check-ups at least once within 5 years after the initial health check-up. Logistic regression analyses using inverse probability of censoring weights showed that the number of non-ideal CVH metrics was associated with an increased risk for stage 1 or stage 2 hypertension (Supplementary Table 9 online). Non-ideal BMI, total cholesterol, fasting glucose, and eating habits increased the risk of both stage 1 and stage 2 hypertension (Supplementary Table 10 online). Fifth, the results of survival analyses using the Cox regression model, as shown in Supplementary Tables 11 and 12 (online), were similar to the results of the original and logistic regression analyses using censoring weights.
DISCUSSION
Our analysis demonstrated that the annual risk of progression to stage 1 or stage 2 hypertension increased with the number of non-ideal CVH metrics in non-hypertensive people aged 20–39 years. Obesity was most strongly associated with an increased risk of transition to hypertension. The relationship between CVH metrics and the risk for hypertension was more pronounced in women than in men. Further, our study is distinct from previous studies in that it demonstrates a relationship of the annual change in CVH metrics with future risk of hypertension. Increases in the number of non-ideal CVH metrics were associated with an elevated risk for developing hypertension, suggesting that optimizing the status of modifiable risk factors and lifestyles is of potential benefit in the prevention of hypertension in young people.
Hypertension is an important risk factor for CVD, even among young people. Preceding analyses demonstrated that both stage 1 and stage 2 hypertension were associated with an elevated risk of CVD events in people aged <40 years,15,16 suggesting the clinical significance of early detection of hypertension in young adults. Considering that CVD incidence in young adults has been stable or increasing over the past few decades compared to the older population,17–20 and benefits of prevention of CVD in young adults are currently recognized, risk stratification of hypertension in young adults is needed for preventing hypertension and subsequent CVD events.
Our study showed that the higher number of non-ideal CVH metrics was associated with the increasing rate of progression to stage 1 or stage 2 hypertension in young adults. For example, even in non-hypertensive young people, more than a quarter of people having 5 or 6 non-ideal CVH metric components developed stage 1 hypertension at 1 year after the initial health check-up, and more than a half of people having 4, 5, or 6 non-ideal CVH metric components developed stage 1 hypertension at 5 years after the initial health check-up.
Non-ideal BMI was most strongly associated with the transition to stage 1 or stage 2 hypertension. Having a non-ideal BMI increased the risk for the development of both stage 1 and stage 2 hypertension by 2- to 3-fold. The importance of BMI in hypertension development has been reported previously.21,22 For example, the Jackson Heart Study reported that BMI <25 kg/m2 was associated with maintaining normal BP (risk ratio: 1.37; 95% CI: 1.08–1.75).22 Additionally, non-ideal total cholesterol and fasting glucose were both associated with a greater risk of developing hypertension. Metabolic disorders including hypercholesterolemia, hyperglycemia (glucose intolerance), and hypertension are known to share common risk factors, such as obesity (particularly, abdominal obesity), and therefore, other pathological mechanisms (e.g., chronic inflammation, neurohumoral activation, enhanced oxidative stress) underlying obesity and associated lifestyle-related disease would contribute to our findings.23–26 It is unknown whether hypercholesterolemia or hyperglycemia would directly increase the risk of hypertension. We need further investigations to uncover the pathophysiological mechanism explaining the relationship of hypercholesterolemia and hyperglycemia with an increasing risk of developing hypertension.
Physical activity is known to reduce the risk of incident hypertension,22,27 but the optimal regimen of physical activity (e.g., type, intensity, and frequency) remains to be determined. Our results showed that skipping breakfast increases the risk of hypertension, consistent with previous studies.28,29 The CARDIA (Coronary Artery Risk Development in Young Adults) study reported that daily breakfast consumption was associated with a lower risk of hypertension (hazard ratio: 0.84; 95% CI: 0.72–0.99) and other metabolic risk factors.28 The influence of cigarette smoking on BP and the development of hypertension is uncertain,30,31 and our study showed unclear results. Nevertheless, smoking cessation should always be recommended, regardless of hypertension prevention.
The association between CVH metrics and the risk for hypertension was seen in both sexes. The relationship between increasing number of non-ideal CVH metrics and the risk for stage 1 or stage 2 hypertension was more pronounced in women. In particular, the effect of non-ideal BMI on hypertension development was greater in women than in men. Although reducing modifiable risk factors and optimizing lifestyles is important for both men and women in order to prevent hypertension and subsequent CVD, risk factor optimization (particularly, maintaining ideal BMI) may potentially provide a greater benefit in young women.
Our study has following strengths and novelties by analyzing the large, population-based cohort of non-hypertensive young adults with consecutive BP measurement data, CVH metrics, and documentation of hypertension development. First, so far, there have been no concrete data on the occurrence rate of hypertension in young adults, and this is the first study showing the concrete annual incidence of both stage 1 and stage 2 hypertension among young people. Second, there have been scarce data on the risk factors for developing hypertension in young adults. Our study confirms data from the REGARDS (Reasons for Geographic and Racial Disparities in Stroke) study,32 and also provides proof that being in the poor CVH status can increase the annual incidence of developing both stage 1 and stage 2 hypertension even in young adults. These findings suggest the necessity of more frequent BP measurements in young people with poor CVH status. Our study is distinguishable from preceding studies in that we demonstrated the association of the annual increase in the number of non-ideal CVH metrics with an elevated risk for the progression to stage 1 or stage 2 hypertension, and identified a potential for optimizing modifiable risk factors and lifestyles to prevent hypertension development in young people. Future research is required to clarify whether modifying CVH metrics could prevent the development of hypertension.
We acknowledge several limitations in this study. Data on BP measurements at a single occasion may not fully represent an individual’s BP phenotype. Because of the low sensitivity of office BP measurement for diagnosing hypertension, we should be concerned about the possibility of missing existing hypertension. Healthcare professionals measured BP according to the standard protocol recommended by the Japanese Ministry of Health, Labour and Welfare, and the average of 2 BP measurements was recorded at annual health check-ups.6 However, adherence to this protocol of BP measurement may be limited on a nationwide scale. Although we obtained similar results by analyzing censoring weights or using multivariable Cox regression analyses, we should consider the possibility of bias caused by loss of follow-up. We performed multivariable regression analyses. However, we were unable to eliminate the possibility of unmeasured confounders and residual bias. For example, socioeconomic status can affect both CVH metrics and the risk of hypertension. Heart rate would also influence the results. Unfortunately, these data were unavailable in the JMDC Claims Database. The original AHA definition for CVH metrics determines eating habits based on dietary components (DASH diet). Similarly, sodium and potassium consumption are also important for the development of hypertension. Unfortunately, the JMDC Claims Database does not include information on such data. Therefore, we defined ideal eating habits as not skipping breakfast, which is known to be associated with incident CVD.33–35 There are concerns regarding external validity of this study. We used data from enrolled individuals with available BP data for 5 consecutive years, which primarily included an employed population (particularly employees of relatively large Japanese companies). Thus, we need to consider the possibility of selection bias (i.e., healthy worker bias) when interpreting our results. However, our main results did not change in a sensitivity analysis that included people who underwent a repeated health check-up at least once within 5 years after the initial health check-up. Further, there can be a racial difference in the association between modifiable risk factors and the risk of developing hypertension (e.g., prevalence of obesity, incidence of hypertension), and thus, further investigations using other datasets (particularly, epidemiological data including various ethnicities) are required to validate our results.
In conclusion, CVH metrics stratified the risk of progression to stage 1 or stage 2 hypertension in non-hypertensive young adults aged 20–39 years. Specifically, obesity was most strongly associated with the risk of hypertension. Further, annual changes in CVH metrics were associated with changing risk for developing hypertension, suggesting the potential for lifestyle interventions in preventing hypertension in young people. Our results can motivate young people to optimize their lifestyle and risk factor status to prevent hypertension development.
FUNDING
This work was supported by grants from the Ministry of Health, Labour and Welfare, Japan (21AA2007) and the Ministry of Education, Culture, Sports, Science and Technology, Japan (20H03907, 21H03159, and 21K08123). The funding sources had nothing with regard to the current study.
AUTHORS’ CONTRIBUTION
Conception and design: H.K., Y.Y., A.O., J.W.M., C.S.P.L., S.O., and I.K; analysis of data: Y.S., A.O., H.I., S.M., K.M., K.F., N.M., T.J., and H.Y; interpretation of data: H.K., Y.S., Y.Y., A.O., A.M., J.W.M., C.S.P.L., S.O., H.Y., and I.K; drafting of the manuscript: H.K., Y.Y., A.O., N.T., H.M., A.O., J.W.M., C.S.P.L., S.O., H.Y., and I.K; critical revision for important intellectual content: N.T., H.M., K.N., J.W.M., C.S.P.L., S.O., H.Y., and I.K; and final approval of the submitted manuscript: A.O., J.W.M., C.S.P.L., S.O., H.Y., and I.K.
DISCLOSURE
H.K. and K.F. received research funding and scholarship funds from Medtronic Japan CO., LTD, Abbott Medical Japan CO., LTD, Boston Scientific Japan CO., LTD, and Fukuda Denshi, Central Tokyo CO., LTD. S.O. reports research grants from Bayer, George Medicines Pty Limited, higi SH llc (higi), and Idorsia Pharmaceuticals; reports ad hoc lecture honoraria from Ascension; reports personal fees from Preventric Diagnostics, Inc. as Chief Medical Officer and from Cincor Pharma Inc. as Scientific Advisory Board Member; and reports annual stipend as Editor-in-Chief for Current Hypertension Reports (Springer Science Business Media LLC), all outside of the submitted work.
DATA AVAILABILITY
The JMDC Claims Database is available for anyone who purchases it from the JMDC inc (https://www.jmdc.co.jp/en/).
