


Abstract
Elevations of fasting glucose (FG) levels are frequently encountered in people treated with thiazide diuretics. The risk is lower in people treated with ACE inhibitors (ACEi). To determine if genetic factors play a role in FG elevation, we examined the interaction of a diabetes gene risk score (GRS) with the use of 3 different antihypertensive medications.
We examined 376 nondiabetic hypertensive individuals with baseline FG <100 mg/dl who were genotyped for 24 genes associated with risk of elevated glucose levels. All participants had ≥1 follow-up FG level over 6 years of follow-up. Participants were randomized to treatment with a thiazide-like diuretic (chlorthalidone), a calcium channel blocker (CCB; amlodipine), or an ACEi (lisinopril). Outcomes were an FG increase of ≥13 or ≥27 mg/dl, the upper 75% and 90% FG increase in the parent cohort from which the present cohort was obtained. Odds ratios were adjusted for factors that increase FG levels.
For every 1 allele increase in GRS, the adjusted odds ratios (ORs) were 1.06 (95% confidence interval (CI): 0.99, 1.14; P = 0.06) and 1.09 (95% CI: 0.99, 1.20; P = 0.08). When results were examined by randomized medications, participants randomized to amlodipine had statistically significant odds for either outcome (OR: 1.23; 95% CI: 1.03, 1.48; P = 0.01 and OR: 1.31; 95% CI: 1.06, 1.62; P = 0.01). No such risk increase was found in participants randomized to the other 2 medications.
A diabetes GRS predicts FG elevation in people treated with a CCB, but not with an ACEi or diuretic. These findings require confirmation.
Trial number NCT00000542.
Elevations of fasting glucose (FG) levels are commonly encountered in people treated for hypertension (HTN). A high prevalence of insulin resistance1,2 and of obesity3 underlie these associations. The choice of medications used for the treatment of HTN also influences the risk for incident glucose elevations: thiazide diuretics increase risk,4 whereas ACE inhibitors (ACEi) lower risk.5 In the Antihypertensive and Lipid-Lowering Treatment to Prevent Heart Attack Trial (ALLHAT) the risk of incident diabetes mellitus (DM) (≥126 mg/dl) at 2-year follow-up among nondiabetic individuals at baseline was highest among users of the thiazide-like diuretic chlorthalidone (9.3%) and lowest among users of the ACEi lisinopril (5.6%).6 Users of the calcium blocker amlodipine had an intermediate risk (7.2%).
Over the past 15 years, many gene variants have been identified that increase the risk for elevated FG levels and for DM.7 To our knowledge, no study has examined whether these genes interact with medications used to treat HTN to increase FG levels. In this study we determine (i) if a gene risk score (GRS), based on gene polymorphisms that predispose to glucose elevation, interacts with the 3 primary antihypertensive medications used in ALLHAT to increase the risk of FG level elevations in nondiabetic participants (drug–gene interaction) and (ii) whether a GRS improves the discriminatory ability of traditional risk factors for predicting new-onset glucose disorders in persons treated for HTN with different antihypertensive medications.
METHODS
ALLHAT
This trial compared first-step treatment with a diuretic (chlorthalidone) vs. an ACEi (lisinopril) or a calcium channel blocker (CCB; amlodipine) for the primary outcome of fatal and nonfatal coronary heart disease (CHD) and for several secondary outcomes (all-cause mortality, stroke, heart failure, left ventricular hypertrophy, decreased renal function, peripheral arterial disease, and blood pressure (BP) lowering).8 A 4th arm of the study, using an alpha blocker (doxazosin; n = 9,061), was stopped early9 and is not considered in this report. Participants were randomized to chlorthalidone, amlodipine, and lisinopril in a 1.7; 1.0; 1.0 ratio. Eligible participants were ≥55 years old with systolic blood pressure (SBP) >140 mm Hg, and/or diastolic blood pressure >90 mm Hg, and/or took HTN medication (<3 drugs) with BP < 160/100 mm Hg at randomization and had at least 1 additional risk factor for CHD. The latter included previous MI or stroke, other manifestations of atherosclerotic cardiovascular disease (CVD), left ventricular hypertrophy, a history of type 2 DM, current smoking, or low HDL cholesterol.
Step 1 medications were formulated to look alike so that the identity of each agent was double-masked. The dose of each step 1 blinded medication was titrated to achieve BP < 140/90 mm Hg. If BP could not be controlled using the maximum dose of step 1 medication, a choice of open-label step 2 medications (reserpine, clonidine, or atenolol) or step 3 medication (hydralazine) were available.
Baseline laboratory tests for glucose, lipids, creatinine, and potassium were obtained after an overnight fast. Analyses were conducted in a certified laboratory. During the 2nd, 4th, and 6th years of follow-up FG levels were repeated. Serum potassium and creatinine were measured at 1 month and at years 1, 2, 4, and 6. Fasting was defined as 8 or more hours without food.
Cohort for this study
Participants for this study were derived from an ALLHAT ancillary study called the Genetics of Hypertension Associated Treatments (GENHAT) study (Figure 1).10 It sought to determine whether variants in HTN susceptibility genes interacted with antihypertensive medication to modify CHD risk in people with HTN. A sub-study of GENHAT implemented a case only design for gene–drug interaction testing. For this study, 2,615 ALLHAT/GENHAT participants with genotype data and a fatal or nonfatal CHD outcome or stroke were examined.11 From these 2,615 participants, those with a baseline FG < 100 mg/dl were examined here.

Derivation of the cohort for the current gene–medication interaction sub-study from the Genetics of Hypertension Associated Treatments (GENHAT)/Antihypertensive and Lipid-Lowering Treatment to Prevent Heart Attack Trial (ALLHAT) parent study.
Gene risk score
Genotyping was performed using a custom-content Illumina Human Exome Array (~2 million single nucleotide polymorphisms (SNPs)). From among the SNPs, 24 were associated with elevated glucose levels (Table 1). Owing to the modest individual impact of genes associated with glucose elevation susceptibility (OR: ~1.06–1.37), a weighted GRS was created to assess the impact of DM susceptibility genes on outcomes. This approach has been used in prior studies and has been validated as a method to assess the overall impact of genes on DM susceptibility.12–15 The GRS per participant was created by multiplying the number of risk alleles per SNP (0, 1, or 2) with the beta estimate reported for that SNP and summing that value across the 24 SNPs. The range of the gene score in our study was from 5.48 to 25.96.
List of single nucleotide polymorphisms (SNPs) used to calculate the gene risk score.
| SNPs | Gene | Risk allele | Allele frequency | Chromosome | OR |
| rs340874 | PROX1 | C | 0.52 | 1 | 1.07 |
| rs780094 | GCKR | T | 0.39 | 2 | 1.06 |
| rs7578597 | THADA | T | 0.90 | 2 | 1.15 |
| rs243021 | BCL11A | A | 0.50 | 2 | 1.08 |
| rs7578326 | IRS1 | A | 0.71 | 2 | 1.11 |
| rs1801282 | PPARG | C | 0.88 | 3 | 1.16 |
| rs11708067 | ADCY5 | T | 0.78 | 3 | 1.12 |
| rs1470579 | IGF2BP2 | C | 0.29 | 3 | 1.17 |
| rs10010131 | WFS1 | T | 0.73 | 4 | 1.11 |
| rs7754840 | CDKAL1 | C | 0.36 | 6 | 1.25 |
| rs2191349 | DGKB | T | 0.52 | 7 | 1.06 |
| rs917793 | GCK | A | 0.16 | 7 | 1.07 |
| rs972283 | KLF14 | G | 0.69 | 7 | 1.07 |
| rs896854 | TP53INP1 | T | 0.24 | 8 | 1.06 |
| rs13266634 | SLC30A8 | C | 0.69 | 8 | 1.15 |
| rs10811661 | CDKN2A/2B | T | 0.83 | 9 | 1.20 |
| rs4747969 | CDC123 | G | 0.18 | 10 | 1.11 |
| rs7903146 | TCF722 | T | 0.30 | 10 | 1.37 |
| rs231362 | KCNQ1 | C | 0.61 | 11 | 1.08 |
| rs1552224 | CENTD2 | A | 0.45 | 11 | 1.14 |
| rs10830963 | MTNR1B | T | 0.35 | 11 | 1.09 |
| rs1531343 | HMGA2 | C | 0.21 | 12 | 1.10 |
| rs7957197 | HNF1A | T | 0.89 | 12 | 1.07 |
| rs11634397 | ZFAND6 | A | 0.43 | 15 | 1.06 |
Abbreviation: OR, odds ratio.
Incident glucose disorders
Because FG levels vary, we chose 2 strict outcomes to minimize the effect of variation. The first outcome was an FG increase of 13 mg/dl from baseline. This was the upper quartile of FG change from our prior analysis.6 The second outcome was an increase of ≥27 mg/dl that corresponds to the highest decile of FG increase in the parent cohort. Because the baseline FG at the start of analysis was <100 mg/dl, such an increase resulted in incident DM.
Cases of incident glucose disorders were chosen in 3 cycles and pooled. Those with an FG increase ≥13 mg/dl or ≥27 mg/dl were considered cases in the first cycle. Those who did not meet criteria at year 2 were considered controls. This procedure was repeated for the 0–4 year and 0–6 years periods.
Statistical analysis
Baseline characteristics were compared between treatment groups using t tests and chi-square tests. Logistic regression models were created to investigate the outcomes of FG ≥13 mg/dl or ≥27 mg/dl as the dependent variable and the GRS as the independent variable. The regression models were adjusted stepwise for age, body mass index, sex, race, baseline FG, HDL, and SBP. Potassium levels from 1 month after randomization visit were also included because increases in FG levels are believed to be due to decreased potassium levels, which lead to decreased insulin secretion.16 We, therefore, chose the 1-month levels to account for chlorthalidone exposure.
The discriminatory capacity of the GRS to predict glucose changes was measured by the area under the curve (AUC) of the receiver operating curve and by net reclassification improvement (NRI). The latter method attempts to quantify how well a new model correctly reclassifies subjects.17 This comparison is between an original “old” model (i.e., the covariates used in the logistic regression model) and a “new” model, which is the original model plus 1 additional component (i.e., the GRS). NRI is composed of subjects without events and with events. Subjects without or with events who are correctly reclassified lower or higher are assigned a+1 or a–1. Subjects without or with events who were incorrectly classified as higher or lower are assigned a–1. Subjects not reassigned are assigned a 0. The scores in each group are summed and divided by the number of subjects in that group. The sum of these 2 values is the NRI.
RESULTS
Cohort with gene risk score
Of the 2,615 ALLHAT/GENHAT participants with CHD outcomes and genotyping, there were 376 (14.4%) without a history of DM and an FG < 100 mg/dl. The remaining 2,239 (85.6%) participants had a history of either DM or elevated FG (≥100 mg/dl) levels.
Baseline characteristics of the cohort categorized by the presence or absence of the 2 study outcomes are shown in Supplementary Appendix. In the total group, the subgroups were similar except that participants who developed glucose outcomes were younger than those who did not develop the outcomes. They were more likely to be African American. When examined by randomized medications, there were no significant differences between participants receiving chlorthalidone or lisinopril who did and did not develop a glucose disorder. Participants randomized to amlodipine who developed glucose disorders were more likely to be African American.
New glucose disorders by quartiles of GRS
Of the 376 participants, 171 (45.5%) were treated with chlorthalidone, 103 (27.4%) with amlodipine, and 102 (27.1%) with lisinopril (similar in proportion to the initial ALLHAT medication randomization scheme of 1.7:1.0:1.0).
The incidence of FG ≥13 mg/dl was 129/376 = 34.3%. An increase of FG ≥13 mg/dl was lowest in the first quartile of the GRS (21/82 = 25.6%) and highest in the 4th quartile (38/96 = 39.6%; Table 2). There was no trend for increasing the numbers of outcomes across quartiles. The incidence of FG ≥ 27 mg/dl was 46/376 = 12.2%. The incidence was lowest in the 1st quartile of GRS (6/82 = 7.3%) and highest in the 3rd (13/92 = 14.3%) and 4th (13/96=13.5%) quartiles. There was no trend of increasing outcomes across quartiles. The distribution of the GRS by the degree of FG change is shown in Figure 2. There were only small differences in median GRS between the 3 groups.
Incidence of FG increase by quartile of gene risk score
| a. FG ≥13 mg/dl. | |||||||||
| Mean score (min, max range) | Total | Chlorthalidone | Amlodipine | Lisinopril | |||||
| GRS | Yes | No | Yes | No | Yes | No | Yes | No | |
| Q1 (n = 82) | 11.28 (5.48, 13.23) | 21 | 61 | 11 | 22 | 3 | 20 | 7 | 19 |
| Q2 (n = 106) | 14.33 (13.24, 15.46) | 39 | 67 | 20 | 31 | 10 | 16 | 9 | 20 |
| Q3 (n = 92) | 16.60 (15.47, 17.79) | 31 | 61 | 19 | 28 | 7 | 15 | 5 | 18 |
| Q4 (n = 96) | 20.09 (17.82, 25.96) | 38 | 58 | 19 | 21 | 14 | 18 | 5 | 19 |
| Total (n = 376) | 15.69 (5.48, 25.96) | 129 | 247 | 69 | 102 | 34 | 69 | 26 | 76 |
| Test for trend | 0.10 | 0.24 | 0.04 | 0.54 | |||||
| b. FG ≥27 mg/dl. | |||||||||
| Mean score (min, max range) | Total | Chlorthalidone | Amlodipine | Lisinopril | |||||
| GRS | Yes | No | Yes | No | Yes | No | Yes | No | |
| Q1 (n = 82) | 11.28 (5.48, 13.23) | 6 | 76 | 3 | 30 | - | 23 | 3 | 23 |
| Q2 (n = 106) | 14.33 (13.24, 15.46) | 14 | 92 | 6 | 45 | 3 | 23 | 5 | 24 |
| Q3 (n = 92) | 16.60 (15.47, 17.79) | 13 | 79 | 7 | 40 | 4 | 18 | 2 | 21 |
| Q4 (n = 96) | 20.09 (17.82, 25.96) | 13 | 83 | 4 | 36 | 6 | 26 | 3 | 21 |
| Total (n = 376) | 15.69 (5.48, 25.96) | 46 | 330 | 20 | 151 | 13 | 90 | 13 | 89 |
| Test for trend | 0.26 | 0.82 | 0.04 | 0.90 |
Abbreviation: FG, fasting glucose; GRS, gene risk score.
Bold values indicate statistically significant (P < 0.05).
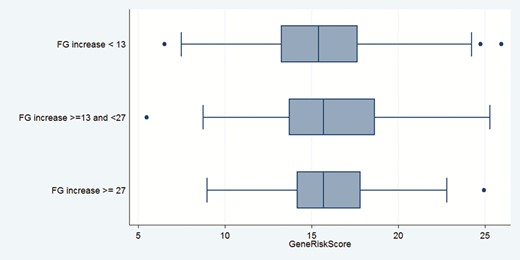
Distribution of gene risk score of genes associated with glucose disorders by degree of fasting glucose change in the Antihypertensive and Lipid-Lowering Treatment to Prevent Heart Attack Trial (ALLHAT)/Genetics of Hypertension Associated Treatments (GENHAT) cohort. Boxes show median levels and 25th and 75th percentiles.
When analyses were categorized by the individual antihypertensive medications, there was a significant trend for an increasing number of outcomes across quartiles of GRS among participants randomized to amlodipine for both outcomes (Ptrend = 0.04 for each). Among participants randomized to chlorthalidone or lisinopril, tests for trend were not statistically significant for either outcome and there were only small differences in outcome rates between the 1st and 4th quartiles
Logistic models
The odds ratios for each outcome per 1-allele increase in GRS, unadjusted and adjusted for risk factors known to increase FG levels, are shown in Table 3. For the total group, there was a borderline significant adjusted association for FG ≥13 mg/dl (OR: 1.06; 95% CI: 0.99, 1.14; P = 0.06) and for FG ≥27 mg/dl (OR: 1.09; 95% CI: 0.99, 1.20]; P = 0.08). There were statistically significant associations per 1-allele increase in GRS for each outcome in participants treated with amlodipine (OR: 1.21; 95% CI: 1.04, 1.39; P = 0.01 and OR: 1.31; 95% CI: 1.06, 1.62; P = 0.01, respectively). For the chlorthalidone- and lisinopril-treated participants, there were no significant associations of GRS with either outcome.
Unadjusted and adjusted odds ratios and 95% confidence interval (CI) for an increase in fasting glucose (FG) of ≥13 mg/dl and ≥27 mg/dl per 1-allele increase in a gene risk score (GRS) consisting of genes associated with glucose disorders
| FG change ≥13 mg/dl | ||||||||
| Total cohort | P | Chlorthalidone | P | Amlodipine | P | Lisinopril | P | |
| Unadjusted | 1.05 (0.98, 1.12) | 0.14 | 1.05 (0.95, 1.15) | 0.35 | 1.16 (1.02, 1.31) | 0.02 | 0.95 (0.83, 1.08) | 0.44 |
| Adjusted 1 | 1.06 (0.99, 1.14) | 0.23 | 1.04 (0.94, 0.15) | 0.45 | 1.21 (1.05, 1.39) | 0.01 | 0.98 (0.85, 1.13) | >0.50 |
| Adjusted 2 | 1.05 (0.98, 1.12) | 0.15 | 1.05 (0.95, 0.16) | 0.31 | 1.16 (1.02, 1.32) | 0.02 | 0.94 (0.82, 1.07) | 0.34 |
| Adjusted 3 | 1.06 (1.00, 1.14) | 0.07 | 1.05 (0.95, 1.16) | 0.37 | 1.21 (1.04, 1.39) | 0.01 | 0.98 (0.84, 1.13) | >0.50 |
| Unadjusted AUC | 0.55 | 0.56 | 0.68 | <0.02 | 0.56 | |||
| Adjusted model 3 AUCa | 0.62 | 0.04 | 0.63 | 0.18 | 0.77 | <0.02 | 0.72 | 0.04 |
| NRI | 0.21 | 0.055 | 0.32 | 0.04 | 0.28 | 0.18 | –0.08 | >0.50 |
| FG change ≥27 mg/dl | ||||||||
| Total cohort | P | Chlorthalidone | P | Amlodipine | P | Lisinopril | P | |
| Unadjusted | 1.06 (0.97, 1.16) | 0.22 | 0.99 (0.86, 1.14) | >0.50 | 1.23 (1.03, 1.48) | 0.02 | 0.99 (0.80, 1.21) | >0.50 |
| Adjusted 1 | 1.09 (0.99, 1.20) | 0.07 | 1.02 (0.86, 1.20) | >0.50 | 1.30 (1.06, 1.59) | 0.01 | 0.99 (0.82, 1.20) | >0.50 |
| Adjusted 2 | 1.06 (0.96, 1.16) | 0.24 | 1.00 (0.86, 1.16) | >0.50 | 1.23 (1.02, 1.49) | 0.03 | 0.99 (0.83, 1.18) | >0.50 |
| Adjusted 3 | 1.09 (0.99, 1.20) | 0.08 | 1.03 (0.87, 1.21) | >0.50 | 1.31 (1.06, 1.62) | 0.01 | 1.00 (0.85, 1.18) | >0.50 |
| Unadjusted AUC | 0.55 | 0.49 | 0.63 | <0.02 | 0.52 | |||
| Adjusted model 3 AUCa | 0.77 | 0.005 | 0.74 | 0.003 | 0.81 | 0.06 | 0.82 | <0.02 |
| NRI | 0.33 | 0.03 | 0.29 | 0.22 | 0.69 | 0.02 | 0.00 | >0.50 |
The discriminatory ability of the GRS is examined by: (i) area under the curve (AUC) and its change when adjusted for age, BMI, sex, race, baseline FG, HDL, systolic blood pressure, and 1-month potassium level; (ii) net reclassification improvement (NRI) score. Adjusted Model 1: age, gender, race, BMI; Adjusted Model 2: SBP, FG, HDL; Adjusted Model 3: age, gender, race, BMI, SBP, FG, HDL potassium. Abbreviations: BMI, body mass index; SBP, systolic blood pressure.
aComparison of unadjusted AUC with GRS alone vs. adjusted model 3.
Discriminatory ability of GRS
Area under the curve
The GRS alone had low ability to capture either outcome in the total group (AUC 0.55 each; Table 3). When results were examined by randomized medications, the baseline AUC for the GRS was highest among participants randomized to amlodipine (0.68 and 0.63, respectively; P < 0.02). The AUC for the GRS was low among participants randomized to chlorthalidone (0.56 and 0.49, respectively) or to lisinopril (0.56 and 0.52, respectively). When the effects of covariates related to elevated glucose levels (baseline age, body mass index, sex, race, baseline FG, triglycerides, HDL, and SBP, and 1-month potassium level) were added, the highest AUC for the FG increase ≥13 mg/dl outcome was in the amlodipine group (0.77); for the ≥27 mg/dl outcome the highest attained AUC was in the amlodipine (0.81) and lisinopril (0.82) groups.
Net reclassification improvement
The NRI scores for the total group were borderline significant and significant, respectively, for either outcome. As an example, for those with the FG ≥13 mg/dl, 52.7% had an increased probability of the outcome with the addition of GRS, whereas for those without FG increase of ≥13 mg/dl outcome, only 42.3% had an increased probability of the outcome. The NRI for the FG ≥13 mg/dl increase outcome among participants randomized to chlorthalidone was statistically significant but not for the FG ≥27 mg/dl outcome. The NRI scores were not significant for either outcome for those randomized to lisinopril but were significant for amlodipine users for the ≥27 mg/dl outcome.
DISCUSSION
In this study of middle-aged and older adults with HTN and CVD—a group enriched for insulin resistance and at high risk for incident glucose disorders—a GRS of DM-related genes was associated with an increased risk of FG level elevation. Participants in the first quartile of the GRS had the lowest risk of FG elevation, whereas participants in the highest quartile had higher risk. There was a borderline statistically significant test of trend for FG level increases with increasing GRS severity. In logistic regression models, a 1-allele increase in GRS was associated with a 6% and 9% increased risk of developing an FG increase of ≥13 mg/dl or ≥27 mg/dl, respectively. These findings are concordant with prior studies that have examined the effects of a GRS for the prediction of glucose disorders in general populations (i.e., not exclusively hypertensive)12,13 but stronger than those reported from the Diabetes Prevention Program. In that cohort of prediabetic individuals, the GRS was more modestly associated with risk of progression to diabetes (hazard ratio (HR) = 1.02 per risk allele; 95% CI: 1.00, 1.05).18 Finally, the GRS increased discriminatory ability through NRI for both outcomes.
When we categorized results by the 3 randomized antihypertensive medications, the overall effect of the GRS on outcomes was significant in participants randomized to amlodipine. The risk of glucose increases was 21% and 31% increased for the FG ≥13 and ≥27 mg/dl outcomes (P = 0.01), respectively, suggestive of a gene–medication interaction. There were no significant increases in risk of increased FG levels in participants randomized to chlorthalidone or lisinopril. There was also an improvement in NRI for amlodipine users for the ≥27 mg/dl increase in FG outcome. One can speculate regarding why there was an interaction of the GRS with amlodipine only. CCBs reduce calcium influx into cells. In smooth muscle cells, this leads to vasodilation19; in pancreatic beta cells, this leads to reduced insulin secretion.20 The vasodilation induced by CCBs leads to increased peripheral glucose uptake and improved insulin sensitivity, thereby counterbalancing their negative effect on insulin-producing cells.21 Consequently, CCBs have no major effect on glucose metabolism. When, however, a CCB is used in the setting of genes related to susceptibility to elevations in FG levels, the impaired insulin secretion is enhanced, overwhelming the peripheral glucose effect. Neither thiazide diuretics nor ACEi interact with beta cell calcium channels. Hence, increased FG levels in people treated with these latter medications appear to be due to factors inherent to these medications. We note that in a prior publication from ALLHAT,22 we reported that all-cause mortality over 8 years in association with incident DM was highest in participants treated with amlodipine compared with participants with incident DM treated with chlorthalidone or lisinopril. It is possible that the high GRS in association with incident DM in people treated with amlodipine predisposed to mortality.
This study has several advantages. First, the cohort was followed to capture as many incident events as possible so that any latent effect of genetic predisposition would be captured over time. Second, we used strict criteria for outcomes as FG levels may fluctuate. Third, we adjusted the effects of the GRS for factors known to be associated with risk of elevated glucose levels. Fourth, there was a high degree of compliance with the use of primary antihypertensive medications.8 Observational studies that have examined the effects of a GRS with antihypertensive medications on CVD outcomes have assumed participants used certain medications for the treatment of HTN. Finally, we examined the effects of the GRS on study outcomes by 2 alternate statistical methods, e.g., AUC and NRI.
Limitations of this study should be acknowledged. The number of participants studied was small. Owing to this, it is possible that true significant associations were not detected. Second, participants for this study were from a sub-cohort of GENHAT11 with CHD or stroke. They were part of a case-only analysis and may not reflect the ALLHAT/GENHAT participants in general. On the other hand, the cohort was enriched for insulin resistance (owing to the presence of HTN and CHD) such that there were many significant or borderline significant outcomes in so small a cohort. Also, because ALLHAT was a HTN study many covariates related to incident glucose disorder (e.g., insulin levels, waist circumference, and family history of DM) were not collected. Two-hour glucose levels, which are frequently elevated in older adults and diagnostic of DM,23 were not assayed. On the other hand, FG levels are the criterion most often used today to categorize glucose disorders. Second, ALLHAT had 70% more participants randomized to chlorthalidone treatment (which did not significantly interact with the GRS for FG elevation outcomes) than to amlodipine or lisinopril treatment. Had the ratio of randomization been 1:1:1 then it is likely that the test of trend of FG elevation and the GRS for the whole cohort would have been statistically significant. Also, given the small size of the cohort we did not try to categorize by age, race, sex, and so forth. Finally, we have not replicated our findings using an independent data-set. Our results are therefore exploratory and preliminary.
In conclusion, a GRS of genes associated with glucose disorders predicts FG elevation over time, especially in people treated with amlodipine. The GRS also significantly improves the ability to predict new glucose disorders, though its effect varies with the medication used.
FUNDING
This research was supported by contracts NO1-HC-35130 and HHSN268201100036C from the National Heart, Lung, and Blood Institute. The Antihypertensive and Lipid-Lowering Treatment to Prevent Heart Attack Trial investigators acknowledge contributions of study medications supplied by Pfizer, Inc. (amlodipine and doxazosin), AstraZeneca (atenolol and lisinopril), and Bristol-Myers Squibb (pravastatin) and financial support provided by Pfizer, Inc. No specific funding was allocated for the work presented in this article.
DISCLOSURE
None of the authors has a financial interest to disclose. The views expressed in this manuscript are those of the authors and do not reflect the official positions of the National Heart, Lung, and Blood Institute, the National Institutes of Health, or the U.S. Department of Health and Human Services. None of the authors has a financial or intellectual conflict of interest regarding the contents of this article.
REFERENCES
