


Abstract
High-sensitivity cardiac troponin T (hs-cTnT) is individually associated with incident hypertension (HTN) and cardiovascular disease (CVD) events. We hypothesize that the increases in hs-cTnT with increases in blood pressure will be related to higher incidence of CVD.
The Cardiovascular Health Study is a longitudinal cohort of older adults. Those with hs-cTnT data and CVD risk factors at baseline and follow-up (2–3 years later) were stratified based on systolic blood pressure (SBP; optimal: <120 mm Hg, intermediate: 120–139 mm Hg, elevated: ≥140 mm Hg) and hs-cTnT (undetectable: <5 ng/l, detectable: 5–13 ng/l, elevated: ≥14 ng/l) categories. SBP and hs-cTnT were classified as increased or decreased if they changed categories between exams, and stable if they did not. Cox regression evaluated incident CVD events over an average 9-year follow-up.
Among 2,219 adults, 510 (23.0 %) had decreased hs-cTnT, 1,279 (57.6 %) had stable hs-cTnT, and 430 (19.4 %) had increased hs-cTnT. Those with increased hs-cTnT had a higher CVD risk with stable SBP (hazard ratio [HR]: 1.28 [1.04–1.57], P = 0.02) or decreased SBP (HR: 1.57 [1.08–2.28], P = 0.02) compared to those within the same SBP group but a stable hs-cTnT. In those with lower SBP at follow-up, there was an inverse relation between diastolic blood pressure (DBP) and risk of CVD events in those with increased hs-cTnT (HR: 0.44 per 10 mm Hg increase, P < 0.01).
An increase in hs-cTnT over time is associated with a higher risk of CVD even when the blood pressure is stable or decreases over time.
Approximately one-half of US adults have hypertension (HTN) according to the most recent definition of ≥130/80 mm Hg or on medication.1 There is a need to identify adults at the highest risk of developing complications, who may benefit from more aggressive medical therapy and lifestyle changes. Several observational studies have shown a strong association between high-sensitivity cardiac troponin T (hs-cTnT) and the sequelae of elevated BP, including clinical events.2,3 The Atherosclerosis Risk in Communities Study (ARIC) even showed an elevated hs-cTnT precedes the development of HTN.4
The question of what is the most appropriate BP target is controversial. While guidelines have previously recommended a goal systolic blood pressure (SBP) of <140 mm Hg,5 the Eighth Joint National Committee (JNC 8) raised the acceptable goal to 150 mm Hg for adults over the age of 60.6 But since the SPRINT trial showed many at elevated CVD risk would experience fewer cardiovascular disease (CVD) events when treated to a more aggressive target of 120 mm Hg,7 the ACC/AHA has recommended goal SBP < 130 mm Hg, including among older persons with atherosclerotic CVD 10-year risk >10%.8 However, in SPRINT those randomized to an SBP goal of 120 mm Hg were more likely to experience hypotension, syncope and electrolyte abnormalities and aggressive SBP control may come at the risk of decreasing diastolic BP to excessively low levels.9
Given the strong association of hs-cTnT with both HTN and CVD events, it may be an attractive biomarker to identify those who could benefit from aggressive BP control. Prior studies of changes in hs-cTnT have only examined its association with baseline levels of cardiovascular risk factors. How changes in hs-cTnT relate to changes in BP have not been described. Therefore we examined the association of changes in SBP with changes in hs-cTnT and the risk of subsequent CVD events.
METHODS
The Cardiovascular Health Study (CHS) is a population-based cohort study of CVD risk factors and outcomes in older community-dwelling adults. Participants were recruited from Health Care Financing Administration Medicare eligibility lists and by other household members in four US regions (Forsyth County, North Carolina; Sacramento County, California; Washington County, Maryland; and Pittsburgh, Pennsylvania). Initial enrollment during 1989–1990 included 5,201 participants. In 1992–1993, a cohort of 687 African-American (AA) participants were recruited, bringing the total sample size to 5,888. Baseline data were collected from standardized questionnaires, a structured physical examination, and fasting blood analyses. The methodology, design, and laboratory collection of CHS have been previously described.10,11
Our analysis included participants with baseline data regarding age, sex, race, body mass index, diabetes status, BP and cholesterol medication use, low-density lipoprotein cholesterol, smoking status, and family history of CVD. All participants without baseline and follow-up hs-cTnT and BP values, or those with a CVD event prior to the second troponin measurement were excluded.
Baseline characteristics definitions
Diabetes mellitus was defined as having a fasting glucose level ≥6.99 mmol/l (126 mg/dl), or self-reported use of oral hypoglycemic medication or insulin. Documentation of lipid-lowering and BP medication use as collected per CHS protocol has been previously defined.12 Smoking history was described as positive based on current or previous significant use by participant report. Family history of CVD was defined as reported premature (women <65 and men <55 years old) event of “heart attack” or “stroke” in first-degree relative by the participant.
Laboratory methods
Baseline hs-cTnT were collected at study year 2 for the non-AA and year 5 for the AA cohort. Follow-up hs-cTnT was collected 2–3 years later (study year 5 for the non-AA and year 7 for the AA cohort) as depicted in Figure 1. All assays for hs-cTnT were performed in April 2010. Blood samples were stored at −70 °C to −80 °C and thawed just before laboratory assays (maximum of three freeze–thaw cycles). Hs-cTnT concentrations were measured using highly sensitive reagents on an Elecsys 2010 analyzer (Roche Diagnostics, Indianapolis, IN). The analytical measurement range of the assay was 3 to 10,000 ng/l with an analytical coefficient of variation of 10%. Analytical sensitivity, specificity, interferences, and precision of the assay were previously validated.13
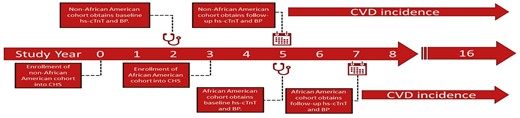
Study design and timeline. Hs-cTnT, high-sensitivity cardiac troponin T; BP, blood pressure.
Cardiovascular events
Baseline CVD was defined as a history of ischemic or hemorrhagic cerebral vascular accident (CVA); coronary heart disease (CHD) including angina, myocardial infarction, coronary artery angioplasty, coronary bypass surgery, CHD death or revascularization; and congestive heart failure (CHF) as determined from the participant’s self-report and/or medical records. Baseline CVD was confirmed by medical records or exam or upon retrospective surveillance. Subsequent CVD events (CVA, CHD, CHF), as well as the cause of death, were adjudicated by the CHS Cardiac Events Committee and the Stroke Committee, using standardized criteria.10 For those without an event, we defined participant’s time-to-survival as time-to-death (from non-CVD causes), time-to-last follow-up, or time-to-the end of the study data (2014) which was analyzed.
SBP and Hs-cTnT categorization
SBP was obtained from an average of two readings based on a seated BP measurement protocol.14 SBP was categorized as optimal (<120 mm Hg), intermediate (120–139 mm Hg), and elevated (≥140 mm Hg) based on definitions in effect at the time of the study. Change in SBP was categorized into three separate SBP groups based on whether participant’s SBP decreased, stayed stable, or increased from one SBP category to another between baseline and at that time of second troponin follow-up.
Similar to prior studies,15 change in hs-cTnT was modeled using two different approaches, the first being change as a continuous outcome (calculated as the change in the serial troponin level). Although troponin can be measured as low as 3 ng/l, values <5 ng/l are considered less precise. Therefore, similar to prior studies,4 all measures <5 ng/l were assigned a value of half the lower limit of measurement (1.5 ng/l). Secondly, hs-cTnT was modeled as a categorical outcome: “undetectable” (hs-cTnT < 5 ng/l), “detectable” (hs-cTnT ≥ 5 and <14 ng/l), or “elevated” (hs-cTnT ≥ 14 ng/l). For the pre-defined categories of hs-cTnT, participants were categorized as having increased (e.g. undetectable to detectable levels), decreased (e.g. elevated to detectable), or stable (e.g. elevated to elevated) hs-cTnT based on whether or not they changed categories between baseline and follow-up 2–3 years after.
Statistical analysis
Baseline participant characteristics and baseline laboratory values stratified by SBP category were compared using analysis of variance (ANOVA) and chi-square analysis. Adjusted hazard ratios (HRs) for CVD risk based on continuous change of SBP and hs-cTnT were calculated using Cox regression analysis. Using those without change in hs-cTnT or SBP as a reference, a surface plot for CVD hazard ratios was constructed by using variable parameter estimates from linear regression models based on change in SBP and hs-cTnT from baseline to follow-up after adjustment for standard covariates (age, body mass index sex, race, smoking status, diabetes status, baseline low-density lipoprotein, baseline use of lipid lowering medications, baseline use of BP lowering medications).
Cox proportional hazard regression analysis was used to examine hazard ratios (HRs) and corresponding 95% confidence intervals (CI) for CVD events based on SBP movement from baseline to follow-up 2–3 years after as stratified by hs-cTnT change. Within each SBP group, the stable hs-cTnT group was used as the reference group. All models were adjusted for standard covariates, as well as baseline SBP and hs-cTnT. Sensitivity analyses were conducted by not including adjustment for BP-lowering medications. Separate models were conducted to evaluate incident CVD events of CHD, CHF, and CVA separately. To evaluate diastolic blood pressure (DBP) effect on CVD, in separate models, a variable for DBP was additionally included in Cox regression models as a continuous variable. SAS statistical software (version 9.1.3; SAS, Cary, NC) was used for all statistical analyses.
RESULTS
Among the 5,888 participants included in CHS, 1,699 participants were excluded for missing hs-cTnT values and two participants were excluded for incongruent extreme hs-cTnT values. An additional three participants were excluded for missing SBP values at either their baseline or follow-up visits. Among the remaining 4,184 participants, 1,928 were excluded due to incident CVD prior to second troponin follow-up. An additional 37 participants were excluded for incomplete baseline demographics. This study included 2,219 participants with a mean follow-up of 8.9 years after the second hs-cTnT. Among the remaining cohort 34% were male with a mean age of 71.6 ± 4.9 years and a baseline troponin of 5.5 ± 7.2 ng/l. Those with a SBP ≥140 mm Hg were more likely to be older, AA, have diabetes, use antihypertensive medication, and have a higher baseline troponin as compared to those with a SBP<140 mm Hg (Table 1).
Baseline characteristics by baseline systolic blood pressure grouping: Cardiovascular Health Study
| Characteristic Mean (SD) or N (%) | Total (N = 2,219) | SBP < 120 mm Hg (N = 542) | 120 ≤ SBP < 140 mm Hg (N = 842) | SBP ≥ 140 mm Hg (N = 835) | P-value |
| Age (years) | 71.6 (4.9) | 70.8 (4.5) | 71.3 (4.8) | 72.5 (5.1) | <0.0001 |
| Male (%) | 752 (33.9) | 179 (33.0) | 304 (36.1) | 269 (32.2) | 0.22 |
| Race | |||||
| White (%) | 1868 (84.2) | 482 (88.9) | 716 (85.0) | 670 (80.2) | <0.01 |
| Black (%) | 340 (15.3) | 59 (10.9) | 122 (14.5) | 159 (19.0) | |
| Other (%) | 11 (0.5) | 1 (0.2) | 4 (0.5) | 6 (0.8) | |
| BMI (kg/m2) | 26.6 (4.6) | 25.7 (4.2) | 26.6 (4.6) | 27.2 (4.9) | <0.0001 |
| Diabetes (%) | 306 (13.8) | 52 (9.6) | 114 (13.5) | 140 (16.8) | <0.001 |
| BP medication use (%) | 863 (38.9) | 150 (27.7) | 312 (37.1) | 401 (48.0) | <0.0001 |
| Stain use (%) | 110 (5.0) | 36 (6.6) | 38 (4.5) | 36 (4.3) | 0.11 |
| LDL-C (mg/dl) | 129.9 (33.9) | 128.6 (34.6) | 130.6 (33.5) | 130.0 (33.8) | 0.57 |
| Smoker | |||||
| Current (%) | 234 (10.6) | 71 (13.1) | 93 (11.0) | 70 (8.4) | <0.01 |
| Former (%) | 888 (40.0) | 240 (44.3) | 314 (37.3) | 334 (40.0) | |
| Reported family history | |||||
| Heart attack (%) | 614 (30.3) | 152 (31.1) | 211 (27.2) | 251 (32.9) | <0.05 |
| Stroke (%) | 281 (13.9) | 59 (12.1) | 112 (14.5) | 110 (14.4) | 0.42 |
| Baseline troponin (ng/l) | 5.5 (7.2) | 4.5 (5.4) | 5.3 (7.0) | 6.4 (8.1) | <0.0001 |
Abbreviations: SBP, systolic blood pressure; BMI, body mass index; LDL-C, low-density lipoprotein cholesterol.
At the time of second troponin, there was no significant difference in the number of participants on antihypertensive medications who had increase in hs-cTnT compared to decrease or stable hs-cTnT (40.9% vs. 38.4%, P = 0.37, respectively). After the second troponin follow-up, 962 participants experienced a CVD event.
Among those with a baseline detectable hs-cTnT, a baseline SBP < 120 mm Hg was protective of CVD events (adjusted HR: 0.63 [0.47–0.84], P < 0.01) as compared to those with a SBP > 140 mm Hg. Among those with a baseline elevated hs-cTnT (>14 ng/l), a baseline SBP < 120 mm Hg showed a similar trend of protection of CVD events as compared to a SBP > 140 mm Hg; however, this analysis did not reach statistical significant (adjusted HR: 0.66 [0.37–1.18]).
CVD events by change in SBP and hs-cTNT
Increased baseline values of hs-cTnT and SBP were both independently significantly associated with CVD events with an interaction effect that trended towards significant (P = 0.07). Increased follow-up values hs-cTnT and SBP were both independently significantly associated with CVD events with an interaction effect that was significant (P = 0.03). The association of continuous measures of the change in SBP and hs-cTnT as related to CVD risk are shown in Figure 2. The relationship of increasing risk for CVD events with increasing hs-cTnT per SD (HR: 1.02, CI: 1.01–1.03, P < 0.0001) was present regardless of increase or decrease in SBP (HR: 1.00, CI: 0.99–1.01, P = 0.16). The interaction variable between change in hs-cTnT and change in SBP was not significant.
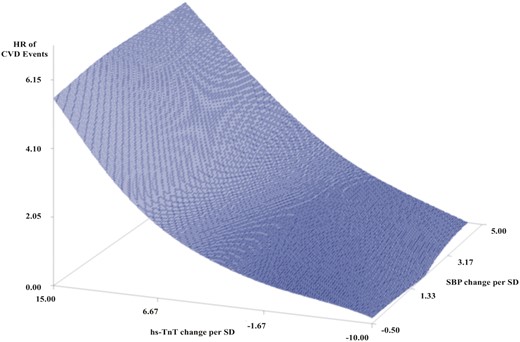
Surface plot of CVD events by continuous change in hs-cTnT and SBP per standard deviation. CVD hazard ratios was constructed by using variable parameter estimates from linear regression models based on change in SBP and hs-cTnT from baseline to second troponin follow-up with adjustment for standard covariates including age, body mass index, sex, race, smoking status, diabetes status, baseline lipids, use of lipid-lowering medication, and use of blood pressure medication. CVD, cardiovascular disease; HR, hazard ratio; hs-cTnT, high-sensitivity cardiac troponin; SBP, systolic blood pressure.
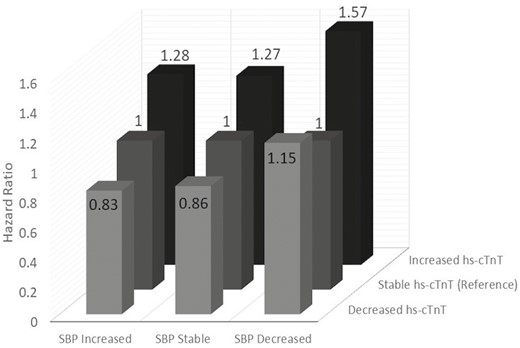
When evaluating hs-cTnT by change, 238 had decreased hs-cTnT, 1,600 had stable hs-cTnT, and 418 had increased hs-cTnT. Those with increased hs-cTnT were more likely to be older (73.0 ± 5.0 vs. 71.0 ± 4.6 years, P < 0.01) and male (42.6% vs. 32.9%, P = 0.02) as compared to those with a decreased hs-cTnT. All other demographics were similar between those with increased and decreased hs-cTnT. When evaluating events, those participants who stayed within the same SBP group but had an increase hs-cTnT had a higher risk of CVD events (HR: 1.27, CI: 1.04–1.57, P = 0.02) compared with stable hs-cTnT (Table 2, Figure 3). Similarly, among those with decreased SBP from baseline to 2- to 3-year follow-up, those with increased hs-cTnT had a higher risk of CVD events (HR: 1.57, CI: 1.08–2.28, P = 0.02) compared with those with stable hs-cTnT. A decrease in hs-cTnT was not associated with the risk of a CVD event.
Adjusted incident cardiovascular disease events based on change of SBP and hs-cTnT
| Change in systolic blood pressure categorization (events; total N) | Change in hs-cTnT categorization (events; N) | Risk of cardiovascular event hazard ratio (confidence interval) |
| SBP increased group (224; 510) | Decreased (25; 56) | 0.83 (0.54–1.30) |
| Stable (154; 367) | 1.00 | |
| Increased (45; 87) | 1.28 (0.90–1.81) | |
| SBP stable group (555; 1,279) | Decreased (52; 128) | 0.86 (0.64–1.15) |
| Stable (368; 899) | 1.00 | |
| Increased (135; 252) | 1.27 (1.04–1.57) ǂ | |
| SBP decreased group (183; 430) | Decreased (23; 47) | 1.15 (0.71–1.85) |
| Stable (122; 311) | 1.00 | |
| Increased (38; 72) | 1.57 (1.08–2.28) ǂ |
Adjusted for baseline high-sensitivity cardiac troponin T (hs-cTnT), baseline SBP, age, body mass index, sex, race, smoking status, diabetes status, baseline lipids, use of lipid-lowering medication, and use of blood pressure medication. Similar results were seen with the excluded adjustment for blood pressure medication use. Change in systolic blood pressure (SBP) definitions. SBP increased: Baseline SBP at optimal (SBP < 120 mm Hg) or intermediate (SBP 120–139 mm Hg), increased to intermediate or elevated (SBP ≥ 140 mm Hg) at follow-up after 2–3 years; SBP stable: Baseline and follow-up SBP remained in the same group; SBP decreased: Baseline SBP at intermediate or elevated, decreased to optimal or intermediate at a follow-up after 2–3 years. Change in hs-cTnT definitions. Increased hs-cTnT: Baseline hs-cTnT at undetectable (<5 ng/l) or detectable (5–14 ng/l), increased to detectable or elevated (≥14 ng/l) at second troponin follow-up (2–3 years later); stable hs-cTnT: Baseline and follow-up. hs-cTnT remained in the same group; decreased hs-cTnT: Baseline hs-cTnT at detectable or elevated, decreased to undetectable or detectable at second troponin follow-up.
ǂP < 0.05.
Adjusted incident cardiovascular disease events based on change of SBP and hs-cTnT. Adjusted for baseline high-sensitivity cardiac troponin T (hs-cTnT), baseline SBP, age, body mass index, sex, race, smoking status, diabetes status, baseline lipids, use of lipid-lowering medication, and use of blood pressure medication.
CVD event type by change in SBP and hs-cTnT
When evaluating components of CVD individually, there were 629 (28.3%) CHD, 499 (22.5%) CHF, and 307 (13.8%) CVA events during follow-up. When evaluating CHD, CHF, and CVA events individually by SBP and hs-cTnT change, similar results for the stable and decreased SBP groups are seen as compared to the composite CVD events when using those with stable hs-cTnT as a reference (Table 3). In adjusted analysis those without change in their SBP group, but with increased hs-cTnT had a significantly higher risk of CHF (HR: 1.33, CI: 1.01–1.76, P < 0.01), and stroke (HR: 1.47, CI: 1.04–2.07, P < 0.01). Similar results were seen for those with a decreased SBP, but increased hs-cTnT, but only CHD events met significance (HR: 1.62, CI: 1.02–2.55, P < 0.05). Unadjusted analysis was similar to adjusted results. Additionally, unadjusted analysis showed in those without change in their SBP group, but with increased hs-cTnT, there was a significantly higher risk of CHD (HR: 1.29, CI: 1.01–1.65, P < 0.05).
Adjusted incident cardiovascular disease events by type of event based on change of SBP and hs-cTnT
| Change in systolic blood pressure categorization | Change in hs-cTnT categorization | CHD hazard ratio (CI) [Events; N] | CHF hazard ratio (CI) [Events; N] | Stroke hazard ratio (CI) [Events; N] |
| SBP increased group | Stable | 1.0 [151; 595] | 1.0 [116; 595] | 1.0 [64; 595] |
| Increased | 1.15 (0.73–1.80) [54; 158] | 1.07 (0.64–1.79) [41; 158] | 1.08 (0.58–2.02) [28; 158] | |
| Decreased | 1.01 (0.59–1.70) [20; 89] | 0.55 (0.28–1.08) [15; 89] | 1.05 (0.52–2.12) [12; 89] | |
| SBP stable group | Stable | 1.0 [88; 404] | 1.0 [56; 404] | 1.0 [40; 404] |
| Increased | 1.12 (0.86–1.45) [16; 83] | 1.33 (1.01–1.76)ǂǂ [19; 83] | 1.47 (1.04–2.07)ǂǂ [10; 83] | |
| Decreased | 0.74 (0.50–1.08) [17; 55] | 1.00 (0.68–1.47) [11; 55] | 0.98 (0.60–1.62) [8; 55] | |
| SBP decreased group | Stable | 1.0 [192; 578] | 1.0 [165; 578] | 1.0 [97; 578] |
| Increased | 1.62 (1.02–2.55)ǂ [65; 170] | 1.38 (0.81–2.35) [54; 170] | 0.97 (0.39–2.38) [34; 170] | |
| Decreased | 1.10 (0.62–1.93) [26; 87] | 0.49 (0.22–1.09) [22; 87] | 1.15 (0.46–2.92) [14; 87] |
Abbreviations: SBP, systolic blood pressure; hs-cTnT, high-sensitivity troponin-T; CHD, coronary heart disease; CHF, congestive heart failure; CI, confidence interval.
Adjusted for baseline hs-cTnT, baseline SBP, age, body mass index, sex, race, smoking status, diabetes status, baseline lipids, use of lipid-lowering medication, and use of blood pressure medication. Change in SBP definitions. SBP increased: Baseline SBP at optimal (SBP < 120 mm Hg) or intermediate (SBP 120–139 mm Hg), increased to intermediate or elevated (SBP ≥ 140 mm Hg) at follow-up after 2–3 years; SBP stable: Baseline and follow-up SBP remained in the same group; SBP decreased: Baseline SBP at intermediate or elevated, decreased to optimal or intermediate at a follow-up after 2–3 years. Change in hs-cTnT definitions. Increased hs-cTnT: Baseline hs-cTnT at undetectable (<5 ng/l) or detectable (5–14 ng/l), increased to detectable or elevated (≥14 ng/l) at second troponin follow-up (2–3 years later); stable hs-cTnT: Baseline and follow-up. hs-cTnT remained in the same group; decreased hs-cTnT: Baseline hs-cTnT at detectable or elevated, decreased to undetectable or detectable at second troponin follow-up.
ǂP < 0.05, ǂǂP < 0.01.
DBP prediction of CVD events
The associations of DBP with incident CVD as stratified by change in SBP and hs-cTnT are shown in Table 4. When evaluating DBP via adjusted Cox linear regression analyses, in those participants that had increased SBP at follow-up, a positive linear association was noted between DBP and risk of CVD events for those within the decreased (HR: 2.03, CI:1.03–4.00, P < 0.05) and increased (HR: 1.69, CI: 1.04–2.77, P < 0.05) hs-cTnT groups. However, when evaluating DBP via regression analyses in those participants with a decreased SBP at follow-up, an inverse relationship was noted between DBP and risk of CVD events in those with increased hs-cTnT (HR: 0.44, CI: 0.24–0.83, P < 0.01).
Adjusted incident cardiovascular disease events according to DBP by change in SBP and hs-cTnT
| Change in systolic blood pressure categorization (Events; total N) | Change in hs-cTnT categorization (Events; N) | Risk of cardiovascular event hazard ratio per 10 mm Hg DBP change (confidence interval) |
| SBP increased group (224; 510) | Decreased (25; 56) | 2.03 (1.03–4.00)ǂ |
| Stable (154; 367) | 0.87 (0.75–1.020 | |
| Increased (45; 87) | 1.69 (1.04–2.77)ǂ | |
| SBP stable group (555; 1,279) | Decreased (52; 128) | 0.91 (0.63–1.32) |
| Stable (368; 899) | 1.01 (0.90–1.12) | |
| Increased (135; 252) | 1.07 (0.88–1.29) | |
| SBP decreased group (183; 430) | Decreased (23; 47) | 1.63 (0.83–3.20) |
| Stable (122; 311) | 0.91 (0.72–1.14) | |
| Increased (38; 72) | 0.45 (0.24–0.83)ǂ |
Adjusted for baseline high-sensitivity cardiac troponin T (hs-cTnT), baseline SBP, age, body mass index, sex, race, smoking status, diabetes status, baseline lipids, use of lipid-lowering medication, use of blood pressure medication and diastolic blood pressure (DBP). Similar results were seen with the excluded adjustment for blood pressure medication use. Change in systolic blood pressure (SBP) definitions. SBP increased: Baseline SBP at optimal (SBP < 120 mm Hg) or intermediate (SBP 120–139 mm Hg), increased to intermediate or elevated (SBP ≥ 140 mm Hg) at follow-up after 2–3 years; SBP stable: Baseline and follow-up SBP remained in the same group; SBP decreased: Baseline SBP at intermediate or elevated, decreased to optimal or intermediate at a follow-up after 2–3 years. Change in hs-cTnT definitions. Increased hs-cTnT: Baseline hs-cTnT at undetectable (<5 ng/l) or detectable (5–14 ng/l), increased to detectable or elevated (≥14 ng/l) at second troponin follow-up (2–3 years later); stable hs-cTnT: Baseline and follow-up. hs-cTnT remained in the same group; decreased hs-cTnT: Baseline hs-cTnT at detectable or elevated, decreased to undetectable or detectable at second troponin follow-up.
ǂP < 0.05, ǂǂP < 0.01.
Discussion
We demonstrate that a serial increase in concentrations of cTnT was associated with incident CVD regardless of systolic BP change in individuals aged 65 years or older without CVD. These results were independent of clinical variables associated well-established to be predictive of CVD, as well as baseline hs-cTnT levels and SBP.
Using data from ARIC study of adults aged 45–64 at baseline, McEvoy et al. showed that an increase in SBP over follow-up was associated with an increase in hs-cTnT.15 Additionally, it has been shown that the presence of elevated hs-cTnT at baseline is predictive of CVD regardless of baseline SBP.9 Importantly, our study shows that decreasing values of hs-cTnT were not found to be associated with decreased CVD risk in any model despite worsening or improvement of SBP. This is in line with recent data that shows that patients treated with antihypertensive medications do not restore CVD risk to ideal levels (based on primordial prevention methods).16
Prior studies have shown that hs-cTnT was independently associated with subsequent development of HTN.4 The mechanism for the elevated hs-cTnT is not completely clear; however, it is known that abnormalities in cardiac structure often occur before the diagnosis of clinical HTN is made.17 However, BP is highly variable both in and out of the clinic, and changes in SBP even within a day can significantly change an individual’s risk for CVD.18 Interestingly, variable BPs confer a risk of having detectable troponin hs-cTnT levels.19 This may best be demonstrated by patients with abnormal diurnal BP patterns having detectable hs-cTnT leak after SBP decreases by as little of 10% from that of daytime SBP levels.
Further complicating the often discordant serial BP readings in the outpatient setting, is the ongoing debate regarding BP goals. Since the SPRINT trial showed reduction for incident CVD events in non-diabetic patients when targeting SBP of <120 mm Hg as compared to <140 mm Hg,7 the HOPE-3 study has also shown that SBP control in those at intermediate CVD risk may not hold the same benefit and may lead to increased adverse events (symptomatic hypotension, dizziness, and lightheadedness without syncope).20 However, the reduction of SBP in the HOPE-3 trial was minimal (6.0 mm Hg) in participants with a mean baseline SBP of 138.1 mm Hg over a 5.6 years period. The SPRINT Trial, and a subsequent analysis of the randomized SPRINT participants ≥75 years old, showed that targeting SBP <120 mm Hg rather than <140 mm Hg led to significantly lower rates of fatal and nonfatal major CVD events and death from any cause.21 This is of particular importance in our study, given its older population. However, our study suggests that regardless of SBP, which often varies from one visit to the next, increased hs-cTnT was predictive of CVD events. One caveat of this may be in those participants with increased SBP and increased hs-cTnT, as our study did not show statistical significance being reached for prediction of CVD events, although still a natural trend for CVD events was seen. This may be related to increasing predictive power of SBP at higher levels. Nonetheless, in this older population, those with improved BPs, had increased risks for CVD events if troponin increased.
Aggressive BP control sometimes comes at risk of decreasing DBP disproportionately. In fact, there has been evidence that aggressive SBP control may lead to decrease in DBP control causing demand/supply myocardial ischemia, and ultimately lead to elevations in hs-cTnT.22 Using data from the ARIC study, McEvoy et al. showed that those with elevated hs-cTnT (≥14 ng/l) and with SBP of 120–139/DBP <60 mm Hg or with SBP ≥ 140 /DBP 60–79 mm Hg had a prospectively higher incidence of CHD compared to those with DBP between 80–89 mm Hg even after adjustment for standard risk factors. Similarly, our results show that in those with a decrease in SBP from ≥140 to 120–140 mm Hg and increased hs-cTnT, decreasing DBP was predictive of increased CVD events. Chronically lower DBP may be related to subclinical myocardial damage manifested by increased hs-cTnT,22 it is likely that similar parallels can be made with acute episodes of DBP dips causing decreased coronary perfusion and thus cTnT elevations consistent with myocardial demand ischemia.23 This could be a daily occurrence in some patients with already low DBP taking BP medications, causing transient myocardial damage and thus measurable hs-cTnT. Commonly cited studies suggesting a more lenient SBP goal of 140–150 mm Hg based on no difference in CVD outcomes compared to <140 mm Hg,24,25 and those suggesting a more strict SBP goal (<120 mm Hg) in the general elderly population with improvement in outcomes20 have left unanswered questions regarding effect of DBP and difference between SBP and DBP (pulse pressure).
Study strength and limitations
Our study has important strengths and limitations. The CHS is a cohort study of mostly Caucasian individuals who were 65 or older at baseline; thus, our results are not generalizable to younger individuals and may differ depending on ethnicity. Additionally, our sample was small when stratifying based on SBP groupings lacking multiple measures given the availability of hs-cTnT data. This may have limited statistical power in some cases. Lastly, as we utilized a prospective cohort study, our inferences do not prove a causal effect despite adjusting for established baseline CVD risk factors. Other factors may have affected the results, such as change of blood pressure groups being related to day-by-day variations in a patient’s compliance to therapy.
In adults ≥65 years old, increases in hs-cTnT over time is associated with a higher risk of CVD even when SBP is stable or decreases over time. Further, a reduction in hs-cTnT over time is not associated with a lower risk of CVD, suggesting that increasing intensity of BP medications for the intention of decreasing hs-cTnT is not useful. Further, in those with decreasing SBP over time to levels <140 mm Hg and increased hs-cTnT, lower DBP may become inversely related to CVD events. Further research is needed to evaluate the utility of serial hs-cTnT in the ambulatory setting as a marker for CVD risk and possible BP medication titration.
Disclosures
The content is solely the responsibility of the authors and does not necessarily represent the official views of the National Institutes of Health. The authors have no additional disclosures to report.
Acknowledgments
This research was supported by contracts HHSN268201200036C, HHSN268200800007C, HHSN268201800001C, N01HC55222, N01HC85079, N01HC85080, N01HC85081, N01HC85082, N01HC85083, N01HC85086, and grants U01HL080295 and U01HL130114 from the National Heart, Lung, and Blood Institute (NHLBI), with additional contribution from the National Institute of Neurological Disorders and Stroke (NINDS). Additional support was provided by R01AG023629 from the National Institute on Aging (NIA). A full list of principal CHS investigators and institutions can be found at CHS-NHLBI.org.
References
Wright JT Jr, Williamson JD, Whelton PK, Snyder JK, Sink KM, Rocco MV, Reboussin DM, Rahman M, Oparil S, Lewis CE, Kimmel PL, Johnson KC, Goff DC Jr, Fine LJ, Cutler JA, Cushman WC, Cheung AK, Ambrosius WT.
Author notes
These authors contributed equally as senior authors.
