


Abstract
Multiple practice guidelines discourage indiscriminate use of broad panels of allergen-specific IgE (sIgE) tests due to increased risk of false positives and misinterpretation of results. We provide an analytical framework to identify specialty-specific differences in ordering patterns and effectiveness, which can be used to improve test utilization.
Test results from a tertiary pediatric hospital were analyzed by ordering specialty to evaluate size of allergen workups. Positivity rates were analyzed to determine effectiveness in selecting tests with high positive pretest probabilities. Laboratory test menu components were also evaluated.
Our findings demonstrate 29% of sIgE tests are ordered as part of broad workups (>20 sIgE tests/date of service) contrary to the recommended testing approach. Detailed descriptions of ordering patterns and positivity rates are provided.
This study provides a framework for using a cross-sectional analytical approach to assess test utilization patterns and evaluate components of laboratory testing menus.
The widespread prevalence of allergy-related diseases makes it increasingly likely that patients will seek diagnosis and treatment for allergies from a variety of specialties. Even with patient histories consistent with allergy, definitive diagnosis of allergy can be a complex endeavor that requires a combination of testing approaches such as skin prick testing (SPT), allergen-specific IgE (sIgE) blood tests, and oral food challenges.1-3 While there are occasions when clinical presentation with only sIgE testing is clinically useful, such as when SPT cannot be performed or oral challenge may endanger the patient, neither SPT nor sIgE results alone are sufficient to distinguish between sensitization and allergy.3-5 Nevertheless, nonallergy providers with resource limitations or those who are unprepared to manage potential anaphylactic reactions in their office may overly rely on ordering large batteries of sIgE allergen tests.6-8
While the technology for sIgE testing has improved from radioallergosorbent tests and enzyme-linked immunosorbent assays to immunoassays that can now be performed on automated chemistry analyzers, sIgE immunoassays are still prone to interferences that can produce false-positive or false-negative results.5,9 In addition, differences in the quality of the antibody-allergen capture technologies produce inconsistent results between laboratories and contribute to a broad range of test sensitivity (60%-95%) and specificity (30%-95%).10,11 These differences can make it difficult for clinicians to interpret results as patients transition care between practices, necessitating additional testing and cost for patients. In addition, there are a seemingly endless number of allergen tests of varying quality marketed directly to clinicians and patients, making it increasingly difficult to correctly select testing and defend conservative testing strategies to patients.
The American Academy of Pediatrics (AAP) recommends careful consideration of clinical presentation and pretest probabilities when selecting allergy tests, whether by SPT, oral challenge, or sIgE.5 These recommendations echo the “Choosing Wisely” guidelines from the American Academy of Asthma, Allergy & Immunology (AAAAI), which caution against the use of large batteries of allergen tests or the use of any allergy test when there are low pretest probabilities of a positive result (history inconsistent with allergy, lack of geographic exposure, etc).12 Stukus et al13 observed that allergists were less likely to rely on large bundles than primary care providers. As with many other types of laboratory tests, indiscriminate allergen test selection increases the rate of false-positive results. This, coupled with misinterpretation of results—such as mistaking sensitization for allergy—can burden patients with unnecessary concern, lifestyle changes, nutritional limitations, and costs of additional testing.12
To our knowledge, no published studies examine the utilization of individual sIgE allergen tests by provider specialty. The aim of our study was to compare the size of allergen workups (tests/patient and tests/date of service) and test positivity rates by provider specialty in a pediatric population to look for opportunities to improve test utilization and patient care.
Materials and Methods
This study was approved by the Seattle Children’s Institutional Review Board. Outpatient serum sIgE tests ordered individually and through predefined testing panels at Seattle Children’s Hospital (SCH) between October 2014 and June 2016 were extracted from the Laboratory Information System. Results were paired with provider specialty designations in the SCH electronic medical record or according to their primary area of clinical expertise. Specialties and related subspecialties were consolidated into six specialty groups, which ordered the majority of tests: allergy (ALG), pulmonology and sleep medicine (PUL), gastroenterology and hepatology (GIH), dermatology (DER), pediatrics and medicine (PED), and naturopathic medicine (NAT). All remaining providers were consolidated into a category of miscellaneous and unknown (MISC).
Serum sIgE testing for 65 analytes was conducted on the Immulite 2000 (Siemens) in the SCH laboratory. The remaining 121 assays were sent to outside reference laboratories.
Data were analyzed to determine the number of dates of service per patient (unique sample collection dates), the number of tests ordered per patient, and the number of tests per date of service (T/DOS). Results were categorized as negative, intermediate, or positive reactivity based on manufacturer test interpretation guidelines. The number and percentage of negative, indeterminate, or positive results were calculated by patient, analyte, provider, and specialty. In addition, the number and percentage of negative, indeterminate, and positive results were calculated for each of the allergen assays. Frequency distributions were analyzed for tests/patient, T/DOS, and T/DOS as a percentage of total tests, in summary and by specialty. Data analysis was completed in Excel (Microsoft) and GraphPad Prism (GraphPad Software).
Results
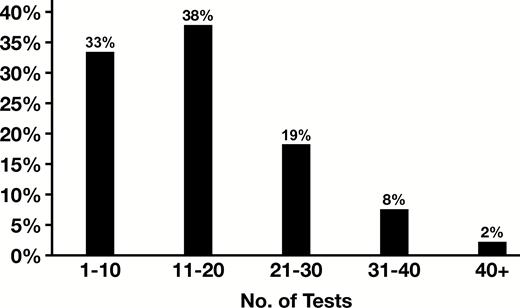
During the 20-month period, there were 21,629 tests ordered for 1,910 patients. The number of allergens tested for each patient ranged from 1 to 91 tests with an average of 11.3 tests per patient. While 62.1% of patients received testing for small numbers of allergens per visit (1-10 T/DOS), 11.2% had much larger workups (>20 T/DOS). A distribution of the total tests ordered by date of service is shown in Figure 1. Most tests were ordered by providers in ALG (53.6%). Detailed distribution of testing by ALG and the other specialty groups is shown in Table 1.
Analysis of Tests/Patient, Tests/Date of Service, and Positivity Rates by Ordering Provider Specialtya
| No. (%) of Results | ||||||||
|---|---|---|---|---|---|---|---|---|
| Specialty | No. of Patients | DOS | Negative/ Nonreactive | Indeterminate | Positive/Highly Reactive | Total | No. of Tests/ Patient | No. of Tests/ DOS |
| ALG | 892 | 1,029 | 6,215 (53.6) | 1,967 (17.0) | 3,419 (29.5) | 11,601 (53.6) | 13.0 | 11.3 |
| DER | 125 | 130 | 1,155 (75.0) | 138 (9.0) | 247 (16.0) | 1,540 (7.1) | 12.3 | 11.8 |
| GIH | 275 | 279 | 1,532 (94.0) | 61 (3.7) | 37 (2.3) | 1,630 (7.5) | 5.9 | 5.8 |
| PED | 225 | 232 | 2,413 (85.7) | 167 (5.9) | 237 (8.4) | 2,817 (13.0) | 12.5 | 12.1 |
| PUL | 232 | 235 | 1,562 (85.3) | 82 (4.5) | 188 (10.3) | 1,832 (8.5) | 7.9 | 7.8 |
| NAT | 77 | 84 | 1,217 (92.5) | 54 (4.1) | 44 (3.3) | 1,315 (6.1) | 17.1 | 15.7 |
| MISC | 93 | 97 | 593 (66.3) | 119 (13.3) | 182 (20.4) | 894 (4.1) | 9.8 | 9.2 |
| Total | 1,917 | 2086 | 14,687 (67.9) | 2,588 (12.0) | 4,354 (20.1) | 21,629 (100.0) | 11.3 | 10.4 |
ALG, allergy; DER, dermatology; DOS, dates of service; GIH, gastroenterology and hepatology; MISC, other providers; NAT, naturopathic medicine; PED, pediatrics and medicine; PUL, pulmonology and sleep medicine.
aSome patients are represented in more than one specialty.
Simultaneous tests ordered per patient visit.
While the mean T/DOS was 10.4, there was a broad range of T/DOS (1-91), with 67% of results obtained with T/DOS more than 10 and 29% with T/DOS more than 20, as shown in Figure 1. Median T/DOS also varied widely between specialties (6 GIH, 14 NAT), as shown in Figure 2. Mean number of tests per patient was 11.3, with a similarly broad range (1-91) and variance by specialty. Detailed results by specialty are shown in Table 1.
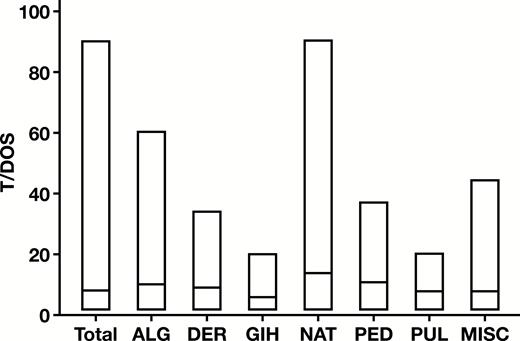
Variation in number of tests ordered per date of service (T/DOS) by specialty. Bars represent the range with the median indicated by the line. ALG, allergy; DER, dermatology; GIH, gastroenterology and hepatology; MISC, other providers; NAT, naturopathic medicine; PED, pediatrics and medicine; PUL, pulmonology and sleep medicine.
We next examined the frequency distribution of T/DOS as a percentage of total tests by specialty. This demonstrated that there were also wide variations in specialty ordering patterns Figure 3. For example, GIH and PUL had the highest proportion of small panel sizes with T/DOS less than 10 for 91% and 80% of tests ordered, respectively. This is further reflected in the relatively low number of allergens tested by GIH (71) and PUL (59) compared with the other specialty groups (range, 104-169). On the other end of the spectrum, only 9% of NAT tests were ordered with T/DOS less than 10, while 51% had T/DOS more than 20.
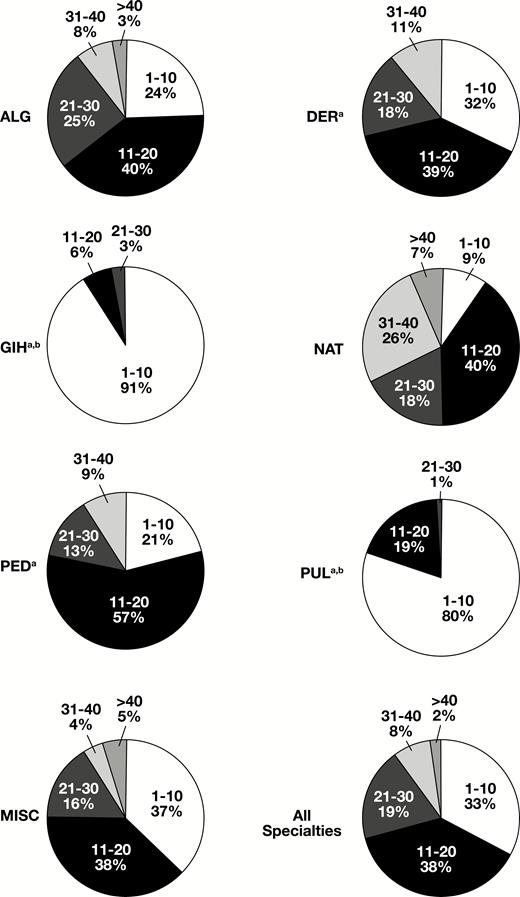
Distribution of the number of tests ordered per date of service (T/DOS) by specialty. ALG, allergy; DER, dermatology; GIH, gastroenterology and hepatology; MISC, other providers; NAT, naturopathic medicine; PED, pediatrics and medicine; PUL, pulmonology and sleep medicine. aMore than 40 T/DOS less than 1%. bThirty-one to 40 T/DOS less than 1%.
We next determined the rate of positive test results, also shown in Table 1. ALG and MISC providers had the highest rate of positive results, 29.5% and 20.4%, respectively. In contrast, NAT and GIH had the lowest positivity rate, with 3.3% and 2.3%, respectively. There was no apparent correlation between T/DOS and rate of positive results.
Last, we evaluated the positivity rates of the 186 sIgE allergen tests offered at SCH, including 121 assays that were processed by other reference laboratories on behalf of SCH. Analysis of the distribution of positive results by allergen assay showed that 59% of assays (110/186) had a positivity rate less than 10%, including 36% of assays (66/186) that produced no positive results during the study period. Two of these assays that produced no positives were included in at least one panel-based requisition known to be used for outpatient ordering. Positivity rates and numbers of orders for each allergen tested are included in Supplement 1 (all supplemental materials can be found at American Journal of Clinical Pathology online).
Discussion
Our findings demonstrate that while many patients received moderately sized workups, 29% of sIgE tests were ordered as part of broad workups (>20 T/DOS), which may be contrary to the recommended selective testing approach.
GIH and PUL specialists had the highest percentage of ordered tests in the lowest T/DOS category (91% and 80%, respectively). GIH had the lowest test/patient ratio (5.9) in this study. This suggests a high attention to selective test ordering from these groups, which is not surprising as relatively few food allergens contribute to subtle gastrointestinal symptoms, and only a couple inhalant allergens (dust mites, animals, indoor molds) drive the risk for persistent asthma. Between these two specialties, there were differences in positive test rates, with 2.3% of GIH orders producing a positive result and PUL 10.3%. This ordering and results pattern can be explained by the fact that the diagnosis of many inflammatory gastrointestinal and pulmonary diseases is often an exercise in exclusion.
More than half of the orders reviewed in this study were generated by providers specializing in allergy. ALG providers had the second highest test/patient and T/DOS (13.0 and 11.3, respectively). While 76% of ALG orders contained tests for more than 10 T/DOS, they also had the highest positivity rate (29.5%). This is significantly different from the pattern observed by naturopathic providers, who had 91% of orders with more than 10 T/DOS and 3.3% positivity. NAT providers also had the highest test/patient and T/DOS in this study (17.1 and 15.7, respectively). In one particularly notable NAT case, a single patient on a single visit received orders for 91 sIgE allergen tests (almost half the test menu of 186 tests, and only eight results were positive). While this case may have skewed overall results for this specialty group, it is a prime example of the testing approach that the AAAAI’s “Choosing Wisely” and AAP practice guidelines advise against.
This study examined ordering patterns based on individual sIgE tests ordered. While some providers may have used panel-guided ordering, which might have influenced the size of workups, more than half of the orders examined originated outside the SCH system, which limited our ability to determine if such panels were used. The results of this study highlight the need to improve sIgE test utilization. This can be achieved by using common techniques from the laboratory utilization “tool box” 14:
Target educational outreach to clinicians on strategies to improve test selection by choosing fewer, better targeted tests and incorporating clinical presentation and history with pretest probabilities.
Educate clinicians on diagnostic criteria for allergy.
Limit access to tests with low positivity or large panels (test menu, preapproval, etc).
When panel-based ordering is needed, periodically review panel components to remove tests that have low positivity.
In conclusion, this study provides a framework for how to use a cross-sectional analytical approach to assess test utilization patterns. Future studies need to measure the impact of implementing these interventions on improving sIgE utilization.
