


Abstract
To investigate the diagnostic potential of AEG-1 and GPC-3 in hepatocellular carcinoma (HCC).
AEG-1 and GPC-3 immunohistochemistry were performed on HCC, adjacent nontumor tissue (ANT), and dysplastic nodules (DN).
H score of AEG-1 or GPC-3 in HCC was significantly higher than in ANT or DN. In HCC, 92% and 54% showed AEG-1 and GPC-3 positivity, respectively. In ANT, 16.2% were AEG-1 and 7.6% GPC-3 positive. AEG-1 staining was mostly diffuse, whereas GPC-3 frequently showed focal staining. AEG-1 alone showed high sensitivity but low specificity and accuracy. GPC-3, on the other hand, showed high specificity but low sensitivity and accuracy. Combination of both stains boosted the sensitivity, specificity, and accuracy to 94.6%, 89.5%, and 90.5%, respectively, when only diffuse staining was considered as positive.
AEG-1 or GPC-3 alone seemed not an ideal marker for HCC. The combination of AEG-1 and GPC-3 might improve early diagnosis of HCC.
Hepatocellular carcinoma (HCC) most often occurs in patients with cirrhosis, mainly resulting from chronic alcohol abuse, nonalcoholic fatty liver disease, or hepatitis virus infection.1 It is the fifth most common cancer and third most common cause of cancer mortality worldwide.2 To achieve long-term survival, early diagnosis of the disease when potentially therapeutic options are feasible is the key. Due to absence of specific signs/symptoms in the early stages of the disease, more than 60% of affected patients are not diagnosed until reaching a late stage with metastasis.3 Surveillance with imaging technology of at-risk patients for early detection of HCC is therefore recommended.4,5 In the suspected cases without the typical appearance of imaging, a biopsy is needed for a diagnosis of HCC.5 Although a biopsy is the gold standard for diagnosis of HCC, sometime it is imprecise due to a high rate of false-negative results.6 Furthermore, in some cases, it is impossible to differentiate high-grade dysplastic nodules (DN) from very well-differentiated HCC based on morphologic characteristics.7 Therefore, molecular biomarkers that can discriminate HCC from nonmalignant lesion are absolutely necessary in order to improve patient outcome.8,9
Astrocyte elevated gene-1 (AEG-1) is an oncogene that was first identified in 2001 in primary human fetal astrocytes as a human immunodeficiency virus-1– and tumor necrosis factor-α–inducible gene.10 In 2009, high expression of AEG-1 in human HCC tissues and its potential roles in HCC development was reported.11 Subsequently, studies have consistently demonstrated that AEG-1 is overexpressed in most human HCC patients (more than 90%), and suggested that high expression of AEG-1 might be a diagnostic and prognostic biomarker for HCC.12-14
Glypican-3 (GPC-3) is a member of the glypican family, which was suggested as a potential diagnostic marker for HCC in 1997 because of its preferential expression in HCC.15 In recent decades, the role of GPC-3 in diagnosis, progression, and treatment of HCC have been widely investigated in vivo and in vitro.16,17 High expression of GPC-3 has been seen in most patients with HCC.18 GPC-3 has become a potential serologic and immunohistochemical marker for diagnosis of HCC.16,18,19
Immunohistochemical biomarkers have been used extensively to help diagnosis of hepatic neoplasms. However, an individual biomarker alone often does not possess enough sensitivity and/or specificity for detecting HCC, particularly at early stages, because heterogeneous staining properties, such as diffuse or focal staining and various staining density, may be seen.20-25 In this study, the AEG-1 and GPC-3 expression patterns in HCC, DN, and adjacent nontumor tissue (ANT) were studied. The diagnostic values of AEG-1, GPC-3, and a combination of both markers were evaluated in order to explore novel biomarkers for early diagnosis of HCC.
Material and Methods
Patient Recruitment and Tissue Samples
The study was approved by the University of Rochester Research Subjects Review Board, which waived the need for consent. Thirty-seven resected HCCs from 2005 to 2011 were selected from the pathology database at the University of Rochester Medical Center. The selection criteria were (1) pathologic stage I to IV tumor without prior treatment effect, and (2) availability of slides and tissue blocks. All selected cases were diagnosed and staged according to the American Joint Committee on Cancer eighth edition tumor/nodes/metastases (TNM) classification system. The diagnosis of HCC for each case was confirmed by two gastrointestinal pathologists (W.C. and M.S.) and a representative block for each case was selected for immunohistochemistry. A total of 37 qualified cases was achieved, and DN was identified in nine cases. Demographic and clinic pathologic parameters were retrieved from the clinical notes, laboratory results, and pathology reports.
Immunohistochemical Staining
Serial sections were immunohistochemically stained with GPC-3 and AEG-1 antibodies as previously described.26 Briefly, 4-μm paraffin sections were deparaffinized and rehydrated. This was followed by antigen retrieval in EDTA buffer (pH 9.0) at 98°C for 20 minutes and blockage of endogenous peroxidase activity with 3% hydrogen peroxide. The slides were incubated with antibodies against AEG-1 (ab45338, Abcam, 1:1000) or GPC-3 (clone 9C2, Sigma-Aldrich, 1:200) at 4°C overnight and were then incubated for 30 minutes with EnVision+ system horseradish peroxidase-labeled polymer conjugated with biotinylated secondary antibody and 3,3′-diaminobenzidine substrate. All sections were then counterstained with Mayer’s hematoxylin. Gastric adenocarcinoma and hepatocellular carcinoma were used as positive controls. Negative controls were established by replacement of primary antibodies with normal serum.
Evaluation of Immunohistochemical Staining
The H score was adopted to evaluate the expression level of AEG-1 and GPC-3, as described in a previous study.26 To evaluate their expression characteristics and value of diagnosing HCC, the staining of AEG-1 and GPC-3 in HCC and ANT were evaluated and assigned to one of the following categories: (1) negative, weak staining or 5% or less of epithelial cells with moderate to strong staining; (2) focal positive, moderate or strong staining in more than 5% but 50% or less; and (3) diffuse positive, moderate, or strong staining in more than 50%. In the study, except for analyzing diagnostic values, positive staining included both focal and diffuse positive categories.
Statistical Analyses
Statistical analyses were performed using the Prism 5 statistical package from GraphPad Software. A P value of .05 was considered statistically significant after using the ANOVA with Tukey multiple comparison or two-tailed χ2 test with the Fisher exact test.
Results
Clinicopathologic Features of HCC
In our cohort, the median age of patients with HCC was 65 years. Eighty-nine percent of the patients were male. At the time of surgical resection, the median size of HCC was 3.4 cm. Thirty-five percent of the HCCs were stage T1, 48.6% were stage T2, and 16.2% were stage T3/T4. Histopathologically, 21% of the HCCs were well differentiated, 64.9% were moderately differentiated, and 13.5% were poorly differentiated. The underlying diseases associated with HCC development in the cohort were 42.3% with hepatitis C, 16.2% with hepatitis B, 27% with alcoholic steatohepatitis/nonalcoholic steatohepatitis, 2.7% with hemochromatosis, 2.7% with α-1 antitrypsin deficiency, and 8.1% with unknown etiology. The demographic and clinicopathologic characteristics are summarized in Table 1.
Demographic and Clinicopathologic Parameters of 37 Hepatocellular Carcinoma Patients
| Characteristics | Category | Cases (n) |
|---|---|---|
| Age, y | >65 | 19 |
| ≤65 | 18 | |
| Sex | Male | 33 |
| Female | 4 | |
| BMI, kg/m | >30 | 17 |
| ≤30 | 20 | |
| Etiology | Hep C | 16 |
| Hep B | 6 | |
| ASH/NASH | 10 | |
| Hemochromatosis | 1 | |
| AAT deficiency | 1 | |
| Unknown | 3 | |
| Cirrhosis | Yes | 33 |
| No | 4 | |
| Alanine aminotransferase, IU/L | >56 | 15 |
| ≤56 | 22 | |
| Aspartate transaminase, IU/L | >40 | 27 |
| ≤40 | 10 | |
| Total bilirubin, mg/dL | >1.2 | 21 |
| ≤1.2 | 16 | |
| Alkaline phosphatase, IU/L | >147 | 13 |
| ≤147 | 24 | |
| α-fetoprotein, ng/mL | ≤7 | 15 |
| 8-100 | 13 | |
| >100 | 9 | |
| Tumor size, cm | >3.4 | 18 |
| ≤3.4 | 19 | |
| Tumor grade | Well | 8 |
| Moderate | 24 | |
| Poor | 5 | |
| Pathologic stage | T1 | 13 |
| T2 | 18 | |
| T3 and above | 6 | |
| Small vessel invasion | Yes | 21 |
| No | 16 | |
| Large vessel invasion | Yes | 5 |
| No | 32 | |
| Recurrence/metastasis | Yes | 10 |
| No | 27 |
AAT, α-1 antitrypsin; ASH, alcoholic steatohepatitis; BMI, body mass index; NASH, nonalcoholic steatohepatitis.
AEG-1 and GPC-3 Expression Patterns in Tissue Samples
The expressions of AEG-1 and GPC-3 were evaluated with immunochemistry staining. The staining densities of AEG-1 and GPC-3 were classified as in Image 1. The expression densities of AEG-1 and GPC-3 in most HCC cases were stronger than that in ANT and DN; representative images are shown in Image 2. The H score of AEG-1 and GPC-3 in HCC were greatly higher compared to that in ANT and DN (P < .001) Figure 1. HCC and ANT paired sections from 37 cases were stained with AEG-1 and GCP-3. Strong immunoreaction was mostly seen in HCCs compared to ANT (Image 2). Based on the criteria described in the “Material and Methods,” negative and positive AGE-1 and GPC-3 staining was defined. Thirty-four of 37 (91.9%) HCCs showed positive AEG-1 staining and 20 of 37 (54%) HCCs showed positive GPC-3 staining, which was significantly higher than that in ANT (Figure 1). In positive cases, AEG-1 showed 100% diffuse pattern in HCCs, whereas GPC-3 displayed 85% diffuse and 15% focal staining patterns. In the paired stained sections, cases with diffuse positive AEG-1 had negative, focal positive, or diffuse positive GPC-3 staining Image 3. Diffuse positive staining was often seen in AEG-1 staining; however, the focal positive pattern mainly occurred in GPC-3 staining Figure 2 and Table 2. In ANT, 16.2% were AEG-1 positive, in which 83.3% were diffuse pattern. In contrast, 7.6% of ANT were GPC-3 positive, all of which showed focal staining. The staining patterns of AEG-1 and GPC-3 in HCC and ANT are summarized in Table 2.
Immunostaining of AEG-1 and GPC-3 in HCC and ANT
| Immunostain | Negative Staining | Positive Staining | |
|---|---|---|---|
| Focal Positive | Diffuse Positive | ||
| AEG-1, HCC | 3 | 0 | 34 |
| GPC-3, HCC | 17 | 3 | 17 |
| AEG-1, ANT | 31 | 1 | 5 |
| GPC-3, ANT | 35 | 2 | 0 |
| Immunostain | Negative Staining | Positive Staining | |
|---|---|---|---|
| Focal Positive | Diffuse Positive | ||
| AEG-1, HCC | 3 | 0 | 34 |
| GPC-3, HCC | 17 | 3 | 17 |
| AEG-1, ANT | 31 | 1 | 5 |
| GPC-3, ANT | 35 | 2 | 0 |
AEG-1, astrocyte elevated gene-1; ANT, adjacent nontumor tissue; GPC-3, glypican-3; HCC, hepatocellular carcinoma.
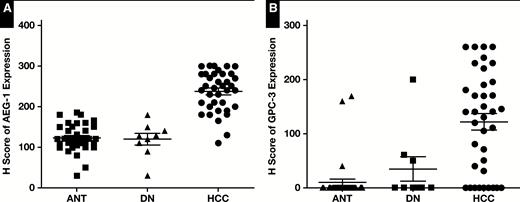
Quantitative data showed the expression level of astrocyte elevated gene-1 (AEG-1) (A) and glypican-3 (GPC-3) (B) in hepatocellular carcinoma (HCC) was significantly higher than in adjacent nontumor tissue (ANT) and dysplastic nodules (DN) (P < .001).

Quantitative data showed that diffuse staining was mostly with astrocyte elevated gene-1 (AEG-1) (P < .05) compared to glypican-3 (GPC-3) in hepatocellular carcinoma and adjacent nontumor tissue.
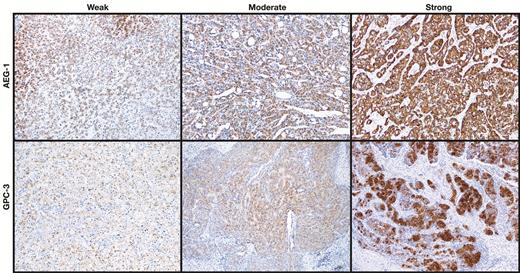
Expression of astrocyte elevated gene-1 (AEG-1) and glypican-3 (GPC-3) in hepatocellular carcinoma and adjacent nontumor tissue. Representative images show immunostaining densities of AEG-1 and GPC-3 (x100).
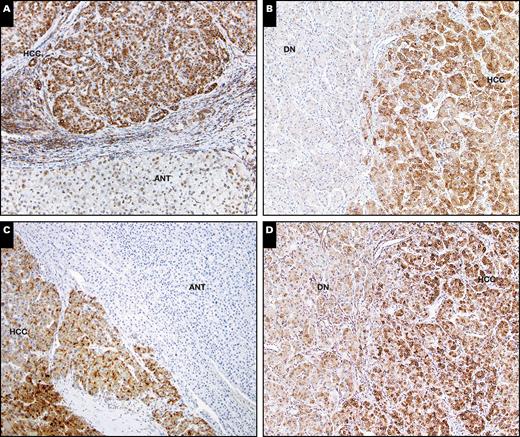
Expression of glypican-3 (GPC-3) (A and B) and astrocyte elevated gene-1 (AEG-1) (C and D) in hepatocellular carcinoma (HCC) and adjacent nontumor tissue (ANT). Strong AEG-1 or GPC-3 expression was seen in HCC compared to ANT and dysplastic nodules (DN) (x100).


Patterns of astrocyte elevated gene-1 (AEG-1) (A, C, and E) and glypican-3 (GPC-3) (B, D, and F) expression in hepatocellular carcinoma and adjacent nontumor tissue. Images represent paired staining with AEG-1 and GPC-3 showing diffuse AEG-1 (A, C, and E), and diffuse (B), negative (D), or focal (F) GPC-3 staining (x100).
Diagnostic Values of AEG-1 and GPC-3 in HCC
The sensitivity, specificity, positive predictive value, negative predictive value, and accuracy of AEG-1, GPC-3, and the combination of AEG-1 and GPC-3 for HCC diagnosis were analyzed. AEG-1 staining alone showed a high sensitivity and low specificity, whereas GPC-3 staining alone had a low sensitivity and very high specificity. The combination of AEG-1 and GPC-3 (cases classified positive if either AEG-1 or GPC-3 was positive) seemed not to improve the diagnosis values, and showed a low specificity and accuracy Table 3. Because focal staining always challenges HCC diagnosis, specifically with fine-needle aspiration specimens, to minimize the impact of focal staining in diagnosis we made changes to our criteria described in the “Material and Methods”; that is, only diffuse positive staining was defined as positive and focal positive was considered negative. AEG-1 alone had a high sensitivity but relative low specificity and accuracy; GPC-3 alone showed a high specificity and accuracy but low sensitivity. The change of criteria seemed to not obviously alter the diagnostic values of AEG-1 or GPC-3 staining alone (Table 3). However, when the combination of AEG-1 and GPC-3 immunoreactivity (case classified as positive if either AEG-1 or GPC-3 was diffuse positive), the sensitivity and accuracy increased to 94.6% and 90.5%, respectively. The specificity was 89.5%. The data are summarized in Table 3.
Diagnostic Values of AEG-1, GPC-3, or Combination of AEG-1 Plus GPC-3
| Sensitivity, % (95% CI) | Specificity, % (95% CI) | PPV, % (95% CI) | NPV, % (95% CI) | Accuracy, % (95% CI) | |
|---|---|---|---|---|---|
| AEG-1, positive | 91.9 (78.1-98.3) | 83.7 (68.0-93.8) | 85.0 (73.0-92.2) | 91.2 (77.6-96.9) | 87.8 (78.9-94.1) |
| GPC-3, positive | 54.1 (36.9-70.5) | 94.6 (81.8-99.3) | 90.9 (71.6-97.6) | 67.3 (59.0-74.6) | 74.3 (62.8-83.8) |
| AEG-1 + GPC-3, either one with positive staining | 94.7 (82.3-99.3) | 78.4.1 (61.8-90.1) | 81.8 (70.8-89.3) | 93.5 (78.8-98.3) | 86.7 (76.8-93.4) |
| AEG-1, diffuse positive | 91.8 (78.3-98.1) | 86.5 (71.2-95.5) | 87.2 (75.0-93.9) | 91.4 (78.1-91.0) | 89.2 (79.8-95.2) |
| GPC-3, diffuse positive | 54.1 (36.9-70.5) | 100 (90.5-100) | 100 | 68.5 (60.5-70.5) | 77.0 (65.8-86.0) |
| AEG-1 + GPC-3, either one with diffuse positive staining | 94.6 (81.8-99.3) | 89.5 (71.2-95.5) | 87.5 (75.30-94.14) | 94.1 (80.5-98.4) | 90.5 (81.5-96.1) |
AEG-1, astrocyte elevated gene-1; CI, confidence interval; GPC-3, glypican-3; NPV, negative predictive value; PPV, positive predictive value.
Discussion
The essential aim of this study was to investigate the expression of AEG-1 and GPC-3 in HCCs and nontumor tissues in order to further evaluate the diagnostic value of AEG-1, GPC-3, and a combination of AEG-1 and GPC-3. Our findings indicated that the expression of AEG-1 and GPC-3 in HCC was significantly increased compared to that in ANT and DN. AEG-1 showed a diffuse staining pattern more often than GPC-3 did. The combination of AEG-1 and GPC-3 (positive was defined as either AEG-1 or GPC-3 diffuse positive) had a better sensitivity and accuracy to discriminate HCC from nontumor tissues than AEG-1 or GPC-3 alone, suggesting that the combination may be more useful in HCC diagnosis, particularly in situations with small size of tissues, like needle core biopsy specimens.
GPC-3 may function differently in a variety of cancers. GPC-3 is downregulated in breast cancer, ovarian cancer, and lung adenocarcinoma, but upregulated in gastric carcinoma and HCC.17,27,28 GPC-3 expression is thought to participate in HCC initiation and development.17 Upregulation of GPC-3 has been noted in 53% to 90% of HCC cases using immunohisto- chemistry.1,16,29-31 In our study, the expression of GPC-3 in HCC was significant higher than in ANT and DN. Fifty-four percent of HCCs displayed positive GPC-3 staining. Notably, reports on expression of GPC-3 in nonmalignant tissues of the liver have been inconsistent, but most of the studies suggested a low positive rate (about 10%).32-34 Our data showed 7.5% of nontumor tissues were positive for GPC-3, which is in line with previous reports. Positive GPC-3 immunostaining in HCC is either diffuse or focal (patchy). In our study, 15% (3/20) HCC showed focal GPC-3 staining. One study by Wang et al32 reported that 16.4% of GPC-3 is focal positive in HCC with a cirrhotic background. In nonmalignant tissues of the liver, focal GPC-3 staining was more frequently seen. Focal GPC-3 staining may have a considerable impact in HCC diagnostic accuracy with needle core biopsy specimens because a high false-positive or negative rate should be expected due to sampling issues.32,35
AEG-1 is expressed in a diverse array of cancers.36,37 It has been identified as an important player in cancer development and progression, including tumor cell proliferation, migration, invasion, and metastasis, as well as angiogenesis and chemoresistance.36 To date, various expression analyses have demonstrated high expression of AEG-1 in many cancers, including HCC.37,38 In our study, the expression of AEG-1 in HCC was higher than that in ANT and DN.11 In human HCC specimens, the positive staining rate was reported as 93.6% in one study.11 Consistent with that report, 91.8% of HCC cases in our human HCC cohort showed positive AEG-1 staining. Two other studies reported that most of their HCC cases displayed positive AEG-1 staining, and high expression of AEG-1 was detected in about 54% to 67% of cases.12,39 AEG-1 staining in tissue sample could be diffuse or focal. In our study, all positive AEG-1 staining in HCC was diffuse. In nontumor tissues, five of six AEG-1–positive cases showed diffuse staining. A high rate of diffuse AEG-1 staining in HCC was also seen in another study.40 High diffuse staining with AEG-1 may help in the diagnosis of HCC but may also increase the false-positive rate in nontumor tissues.
Many of studies have evaluated the sensitivity and specificity of GPC-3 in diagnosis of HCC. For resection specimens, the sensitivity ranged from 75.7% to 94.8% and specificity from 96% to 97%.16,19,30,32,41-44 In studies using tissue microarrays, the sensitivity and specificity were 63.6%34 and 90%, respectively.45 Thus, GPC-3 has a high specificity and relative low sensitivity. In our study, the same trend was noted. The sensitivity was 54.1% and specificity was 94.5% with low accuracy (74.3%). Even when we changed criteria to define focal positive as negative, the trend was not altered. Our data further supported the finding that GPC-3 is a biomarker for diagnosis of HCC with high specificity and low sensitivity. The lower sensitivity of GPC-3 for diagnosis of HCC was seen in liver biopsy specimens, which ranged from 53% to 90%.29,46,47 The false-negative result from focal expression in liver tissues may be a major contributor to the low sensitivity of diagnosis, specifically in core needle biopsy specimens.
Because AEG-1 is markedly overexpressed in HCC and its expression is tightly related to tumor stage and grade, as well as overall survival and recurrence rate of the disease, it might serve as a potential diagnostic/prognostic marker for HCC.13 At present, there have been few studies to evaluate the diagnosis value of AEG-1 in HCC. One report suggested that mRNA of AEG-1 from blood might be a potential biomarker for early diagnosis of HCC.48 Our data indicated that when using AEG-1 as biomarker to distinguish HCC from nontumor tissues, a high sensitivity of AEG-1 (91.9%) was seen, which was in agreement with a previous report.40 However, the specificity and accuracy were relatively low (83.7% and 87%, respectively), suggesting that AEG-1 alone has limitations for consideration as a biomarker for diagnosis of HCC.
Distinguishing between well-differentiated HCC and benign lesions can be challenging, particularly in cases with biopsy of liver lesion. Several biomarkers have been adopted for distinguishing HCC from nonmalignant lesions, including GPC-3. However, the currently available markers have significant diagnostic limitations.49,50 International guidelines have suggested the use of biomarkers in combination to improve HCC diagnosis.51 Some studies with a combination of different biomarkers to improve HCC diagnosis sensitivity and specificity have been reported.52 When we combined AEG-1 and GPC-3, a case was considered positive when either AEG-1 or GPC-3 was positive. The sensitivity and specificity were not obviously improved. Because AEG-1 staining in HCC was mostly diffuse, focal GPC-3–positive cases in HCC showed diffuse AEG-1 staining, and diffuse false-positive AEG-1 in ANT may show negative or focal false-positive GPC-3, we tested the diagnosis value of a combination of AEG-1 and GPC-3 in the cohort, with positive defined as either AEG-1 or GPC-3 diffuse positivity. The sensitivity, specificity, and accuracy were 94.6%, 89.5%, and 90.5%, respectively, which were significantly better than with AEG-1 or GPC-3 alone. Notably, our study was retrospectively performed in a small HCC cohort. Further studies with a combination of AEG-1 and GPC-3 staining should be conducted in larger cohorts retrospectively and prospectively, especially in core needle biopsy specimens, to solidify our results.
In summary, our study demonstrated that the combination of AEG-1 and GPC-3 (either AEG-1 or GPC-3 diffuse staining classified as positive) would have a better sensitivity, specificity, and accuracy in HCC diagnosis than either of them used alone. Considering diffuse staining as positive would reduce false positives in the diagnosis of HCC, and the combination of AEG-1 and GPC-3 would be useful to improve early diagnosis of HCC in cases with less than ideal sample size, like core needle biopsy specimens.
This work was supported by Department of Pathology and Laboratory Medicine, University of Rochester Medical Center, Rochester, NY.
