


ABSTRACT
To determine the relationship between baseline variations in the partial thromboplastin time (PTT) and the discordance between the PTT and anti-Xa heparin activity (anti-Xa) during heparin therapy.
The baseline PTT on heparin was determined using automated heparin neutralization with protamine (prPTT). The prPTT was used to calculate a baseline-corrected PTT on heparin to reduce discordance with anti-Xa measurements.
The prPTT removed up to 1 U/mL of heparin, returning baseline values for normal, factor-deficient, and lupus inhibitor plasmas. A prolonged prPTT was seen in 97 (53%) of 182 samples from heparinized patients. The heparinized PTT was discordant compared with anti-Xa in 64 (35%) of 182 samples and 43 (67%) of 64 discordant samples, and 46% of concordant samples showed a prolonged prPTT. A baseline-corrected PTT reduced discordance with anti-Xa measurements by 64%.
PTT/anti-Xa discordance due to baseline PTT prolongation could be reduced using a baseline-corrected PTT.
Optimizing anticoagulation requires finding the proper balance between thrombotic and bleeding risks. Intravenous unfractionated heparin (UFH) therapy has been a mainstay for the prevention and treatment of venous and arterial thrombosis due to its documented efficacy and rapid reversibility. Protein binding, saturable elimination kinetics, and antithrombin deficiency can produce significant variability in the response of individuals to UFH therapy.1 As such, the anticoagulant effect of UFH cannot be predicted by weight-based dosing alone, making laboratory monitoring essential to achieve appropriate anticoagulation.
The activated partial thromboplastin time (PTT) is routinely used for monitoring intravenous UFH therapy. Traditionally, the UFH therapeutic range goal was a PTT 1.5 to 2.5 times the mean control PTT. The chromogenic anti-Xa assay for UFH (heparin activity) has shown increasing use as an alternative method of monitoring UFH therapy, either alone or in conjunction with the PTT assay, and has a stable recommended therapeutic range of 0.3 to 0.7 IU/mL.2,3 The current standard practice is to determine the PTT therapeutic range by ex vivo comparison of PTT vs anti-Xa heparin activity in samples from patients on heparin.4 Due to a lack of standardization of PTT reagents, validation of the PTT therapeutic range based on comparison with anti-Xa heparin activity is required with any changes in reagent lot or instrument.2
The PTT was originally designed to aid in the diagnosis of hemophilia because it is an effective screening tool to demonstrate plasma-based hemostatic defects in patients who have experienced hemorrhage.5 One of the primary reasons for the continued use of the PTT for UFH monitoring is the idea that it serves as a surrogate marker of the global level of anticoagulation in the patient because it is sensitive to both factor levels and heparin therapy.6 Interpreting the PTT in this context is limited by the fact that the PTT is sensitive to other conditions commonly present in hospitalized patients that affect the assay result in a way that is not representative of the patient’s coagulation status and risk for bleeding or thrombosis.7,8 For example, both contact system deficiencies and lupus anticoagulants frequently prolong the PTT outside of the therapeutic range but do not reflect an increased risk of bleeding or represent an increased risk of thrombosis, respectively. A patient with a prolonged baseline PTT may show a PTT on heparin therapy that is greater than predicted based on the heparin therapeutic range. Whether this additional prolongation is clinically significant (ie, due to factor deficiency) is not transparent, making correct interpretation of the heparinized PTT result difficult. Alternatively, the PTT can be shortened in the setting of elevated factor VIII levels or other heparin binding proteins.6 Increasing the heparin dose to bring the PTT into the therapeutic range in this scenario may place the patient at increased risk of bleeding without clear evidence for a reduction in the risk of thrombosis.9
The variability in the PTT response to heparin has become increasingly apparent as institutions transition to measuring heparin activity by the anti-Xa assay and report discordance rates of 40% to 75% between PTT and heparin activity results.6,10-12 In most cases, the heparin activity result is likely a better representation of the anticoagulant effect of UFH therapy, as it is sensitive to only heparin and antithrombin levels in plasma.13 The heparin activity result, however, can be falsely lowered by increased levels of bilirubin and/or hemoglobin.14 With high levels of hemolysis and/or icterus, the anti-Xa heparin activity assay can fail due to saturation of the spectrophotometer, leaving the PTT as the only option for UFH monitoring in these patients.
The goals of this study were to (1) develop an automated method for neutralizing heparin so that the baseline PTT could be measured while on heparin therapy, (2) determine the effect of these baseline PTT variations on the PTT response to heparin, and (3) evaluate using the baseline PTT to adjust the heparinized PTT to improve concordance with the anti-Xa heparin activity assay.
Materials and Methods
Human Participants
This study was approved by the Seattle Children’s Hospital Human Subjects Review Committee. Remaining plasma from samples submitted for coagulation testing were collected and stored at −80°C. All samples were originally collected in blue-top tubes and anticoagulated by combining nine volumes of blood with one volume of 0.105 mol/L (3.2%) trisodium citrate and then centrifuged at 4,600g for 3 minutes; plasma was removed, initial testing was performed, and any remaining plasma was frozen at −80°C within 2 hours. No additional blood was drawn from any patient. Relevant clinical information and test results, including prothrombin time (PT), PTT, anti-Xa heparin activity, and antithrombin, were collected.
Laboratory Assays
PT using Neoplastin CI Plus reagent, PTT using STA-PTT A reagents, protamine PTT (prPTT) using STA-PTT A reagents and protamine sulfate, anti-Xa UFH activity using liquid anti-Xa reagents (does not contain antithrombin supplementation), lupus inhibitor using STACLOT-LA (hexagonal phase phospholipid neutralization), and antithrombin activity using Stachrom ATIII reagents were obtained from Diagnostica Stago and measured on Stago Compact analyzers (Diagnostica Stago). The PT normal range was 12.5 to 15.2 seconds (age >3 months) and 12.5 to 17 seconds (age ≤3 months), and the PTT normal range was 25 to 35 seconds (age >3 months) and 25 to 40 seconds (age ≤3 months). Protamine sulfate and heparin were obtained from Fresenius Kabi. Owren-Koller buffer was obtained from Diagnostica Stago. Pooled normal citrate plasma and factor XII–deficient plasma were obtained from PrecisionBiologics. A prolonged PT plasma pool was prepared from samples from patients on warfarin; the final PT for the pool of these samples was 17.1 seconds. A moderate lupus inhibitor pool was prepared from samples with a normal PT, a positive STACLOT-LA lupus inhibitor assay, and a PTT of 40 to 50 seconds (final average PTT of 41 seconds). A strong lupus inhibitor pool was prepared from samples with a normal PT, a positive STACLOT-LA lupus inhibitor assay, and a PTT of greater than 50 seconds (final average PTT of 66 seconds).
prPTT Assay
An automated heparin neutralization assay was developed to measure the baseline PTT in samples from patients on heparin therapy. The reagent sequence on the Stago Compact analyzer was as follows: 50 µL of patient plasma and 25 µL of 20 µg/mL protamine sulfate, incubate for 30 seconds; 50 µL STA-PTT A reagent, incubate for 240 seconds; and 50 µL of 0.025 mol/L calcium chloride.
Preparation of In Vitro Samples
To evaluate the ability of the prPTT assay to neutralize heparin and return the original baseline PTT result, the prPTT and PTT were measured on normal, prolonged PT, factor XII–deficient, and strong and moderate lupus inhibitor–positive pooled plasmas at heparin concentrations of 0, 0.1, 0.3, 0.5, 1, 1.5, 2, and 3 U/mL.
prPTT Reference Range
Clinical information was reviewed on leftover pediatric samples with a normal PT and PTT to identify 28 normal/healthy subjects (testing submitted for orthopedic surgery preoperative evaluation or well-child follow-up visit). The prPTT assay was run on each sample to determine a normal range (mean ± 2 SD) for the prPTT assay.
Heparin Therapeutic Range
A heparin therapeutic range was established in compliance with College of American Pathologists guidelines.2 Clinical information and test results on samples with a normal PT (12.5-15.2 seconds) and normal prPTT (31-43 seconds) were reviewed to select 30 samples without hemolysis or icterus from 26 patients on stable heparin therapy (no rate change or bolus within 4 hours) and with no recently documented antithrombin deficiency (antithrombin activity <60%). A standard linear regression was used to determine the correlation between the PTT and heparin activity. Heparin therapeutic range data were also used to determine the 99% prediction interval.15 The prediction interval shows the expected upper and lower limits of PTT values for a corresponding heparin activity based on variation in the heparin therapeutic range data.16
Concordance of Heparin Activity With PTT in Pediatric Patient Samples
Clinical data for PTT and heparin activity were obtained on samples submitted for heparin monitoring. Samples were excluded if the PTT was above 200. For samples where the heparin activity was reported as less than 0.1 U/mL, a value of 0.09 was assigned as the heparin activity value. PT, PTT, prPTT, and anti-Xa heparin activity were performed on 182 samples from 100 pediatric patients. Samples were defined as concordant if the result fell within the 99% prediction interval from the heparin therapeutic range. Samples were defined as discordant if they fell outside the 99% prediction interval.
Baseline-Corrected PTT
A baseline-corrected PTT (bcPTT) was calculated for clinical samples using the following equation:
where PTT is the patient’s measured PTT on heparin, the prPTT is the PTT after heparin neutralization with protamine, CI is the exponential correction index, and 36.6 is the mean normal prPTT determined from the prPTT reference range. Calculations of bcPTT were performed using CIs of 1.0 to 1.9 in increments of 0.1 to determine the value at which the number of discordant PTT/heparin activity values was maximally reduced while minimizing the number of newly discordant values (originally concordant, discordant after baseline correction).
Results
prPTT Assay Validation—In Vitro Heparin Spiked Samples
Figure 1 shows the PTT in normal plasma prolonged with increasing concentrations of heparin, plateauing at the upper limit of detection (>236 seconds) at heparin concentrations of 0.5 U/mL and higher. Addition of 10 µg protamine per milliliter of plasma neutralized up to 1 U/mL of heparin, producing a stable baseline prPTT (range, 30-33 seconds). At heparin concentrations above 1 U/mL, the prPTT began to increase, indicating that the protamine was no longer completely neutralizing the effect of heparin on the PTT.
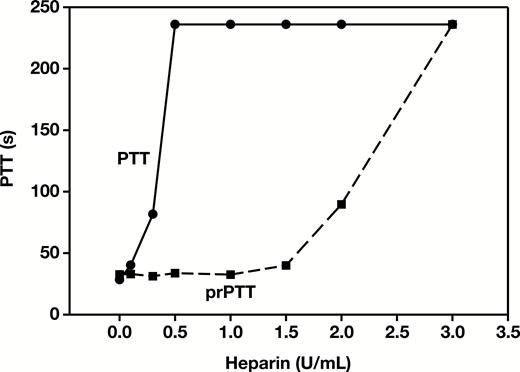
Partial thromboplastin time (PTT) and protamine PTT (prPTT) results for pooled normal plasma spiked with increasing concentrations of heparin.
The prolonged PT plasma had a prolonged baseline prPTT of 45 seconds with no heparin added. The PTT in the prolonged PT plasma increased to the upper limit of detection (>236 seconds) at heparin concentrations of 0.5 U/mL and higher Figure 2A. In the prolonged PT plasma pool, protamine was able to neutralize heparin to 1 U/mL, producing a stable baseline prPTT (range, 39-44 seconds). The factor XII–deficient plasma had a prolonged baseline PTT in the absence of heparin of 46 seconds that increased to the upper limit of detection at heparin concentrations of 0.5 U/mL and higher Figure 2B. In factor XII–deficient plasma, protamine was again able to neutralize heparin up to 1 U/mL, producing a stable baseline prPTT (range, 44-46 seconds). Protamine was able to neutralize heparin up to 1 U/mL in lupus inhibitor plasma, producing a stable baseline prPTT for both the strong lupus plasma (range, 57-60 seconds; Figure 3A) and moderate lupus plasma (range, 39-41 seconds; Figure 3B).
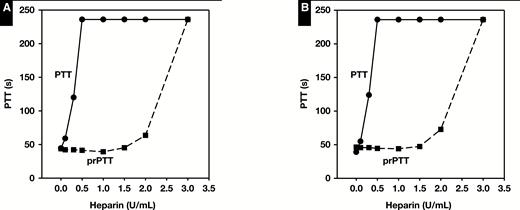
Partial thromboplastin time (PTT) and protamine PTT (prPTT) results for prolonged (≥17.1 seconds) prothrombin time plasma (A) or factor XII–deficient (≤20%) plasma (B) spiked with increasing concentrations of heparin.

Partial thromboplastin time (PTT) and protamine PTT (prPTT) results for strong lupus inhibitor plasma (A) or moderate lupus inhibitor plasma (B) spiked with increasing concentrations of heparin.
prPTT Reference Range
Twenty-eight healthy pediatric patients with a normal PT and PTT were used to establish a reference range for the prPTT. The mean ± SD values were 13.3 ± 0.6 seconds for PT, 33 ± 2 seconds for PTT, and 36.6 ± 3 seconds for prPTT. The reference range for prPTT was defined as the mean ± 2 SD and was determined to be 31 to 43 seconds.
prPTT Variation in Hospitalized Patients on Heparin Therapy
Figure 4 demonstrates the variability of the prPTT for three patients during their hospitalization. One patient’s prPTT remained relatively stable while on heparin therapy (prPTT range, 28-34, solid line), while the other two demonstrated variability in their prPTT values. The prPTT for the second patient was initially prolonged at 58 seconds and then decreased to 45 seconds, while in the third patient, the prPTT was initially within the normal range, prolonged to 65 seconds, and then returned back to normal. This demonstrates the need to measure the prPTT on each sample for heparin monitoring to determine the current baseline PTT, rather than using a single baseline PTT prior to starting heparin therapy.
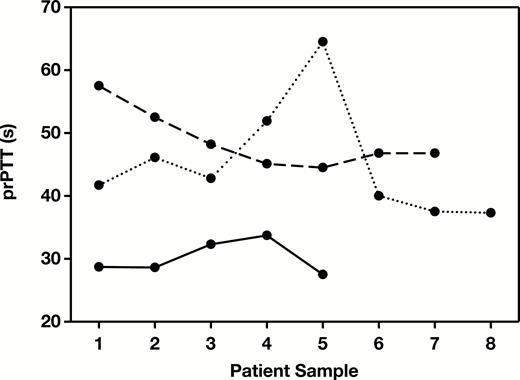
Example protamine partial thromboplastin time (prPTT) results for three patients demonstrating individual variation in prPTT results over time.
Heparin Therapeutic Range
Measurements of heparin activity, PTT, PT, and prPTT were performed on 30 selected samples from 26 pediatric patients on heparin therapy. The mean ± SD values were 0.32 ± 0.16 IU/mL (median, 0.28; range, 0.09-0.68) for heparin activity, 68 ± 22 seconds (median, 60; range, 32-115) for PTT, 13.8 ± 0.9 seconds (median, 13.8; range, 12.2-15.6) for PT, and 38 ± 4 seconds (median, 38; range, 32-43) for prPTT. Figure 5 shows the correlation (r2 = 0.61) between PTT and heparin activity results. The therapeutic PTT range corresponding to heparin activity levels of 0.3 and 0.7 IU/mL was 66 to 108 seconds. The 99% prediction interval was calculated to define the upper and lower limits of the expected PTT value for a corresponding anti-Xa heparin activity (Figure 5, solid lines). Samples were defined as discordant if they were outside of the 99% prediction interval for PTT/anti-Xa heparin activity.
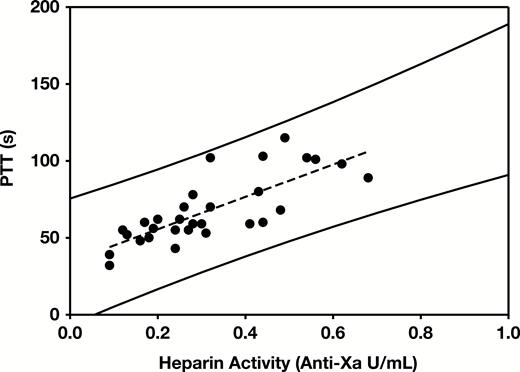
Heparin therapeutic range. Correlation of heparin activity and measured partial thromboplastin time (PTT) results from pediatric patients with normal prothrombin time and protamine PTT (prPTT). r2 = 0.61. Solid lines represent the upper and lower limits of the 99% prediction interval.
Baseline prPTT in Pediatric Patients on Heparin
The mean ± SD values in 182 samples from pediatric patients were 0.30 ± 0.15 IU/mL (median, 0.29; range, 0.09-0.87) for heparin activity, 16.5 ± 4 seconds (median, 15.6; range, 11.2-42.3) for PT, 95 ± 41 seconds (median, 91; range, 32-198) for PTT, and 45 ± 10 (median, 44; range, 26-81) for prPTT Table 1. A normal prPTT was seen in 81 (45%) of 182 samples. Of these, 26 showed a prolonged PT, which indicated some level of PT deficiency (fibrinogen or factor II, V, VII, or X). A prolonged prPTT was seen in 97 (53%) of 182 samples. A normal PT was seen in 45 of 97 samples with a prolonged prPTT, indicating that the prPTT could be prolonged even when the PT was normal. A short prPTT was seen in four samples; all had a normal PT.
Patient Results Grouped by Protamine Partial Thromboplastin Time and Prothrombin Time
| Characteristic | No. (%) | prPTT, Mean (SD), s | PT, Mean (SD), s | PTT, Mean (SD), s | Heparin Activity, Mean (SD), IU/mL |
|---|---|---|---|---|---|
| Normal prPTT | 81 (45) | 38 (3) | 15.4 (2.1) | 84 (37) | 0.33 (0.16) |
| Normal PT | 55 | 38 (3) | 14.3 (1.2) | 82 (35) | 0.32 (0.14) |
| Long PT | 26 | 38 (3) | 17.6 (1.9) | 90 (40) | 0.34 (0.19) |
| Long prPTT | 97 (53) | 52 (9) | 17.6 (4.8) | 105 (43) | 0.27 (0.14) |
| Normal PT | 45 | 49 (6) | 14.8 (1.2) | 100 (42) | 0.26 (0.12) |
| Long PT | 52 | 55 (10) | 19.9 (5.5) | 110 (43) | 0.27 (0.16) |
| Short prPTT | 4 (2) | 28 (1) | 13.4 (0.3) | 53 (10) | 0.47 (0.17) |
| Normal PT | 4 | 28 (1) | 13.4 (0.3) | 53 (10) | 0.47 (0.17) |
| Total | 182 (100) | 45 (10) | 16.5 (4.0) | 95 (41) | 0.30 (0.15) |
prPTT, baseline partial thromboplastin time with heparin neutralized using protamine sulfate; PT, prothrombin time; PTT, partial thromboplastin time.
Concordance of PTT and Anti-Xa Heparin Activity
Figure 6A shows the correlation between the original PTT and anti-Xa heparin activity in 182 samples from pediatric patients on heparin therapy (r2 = 0.11). The total number of discordant samples was 64 (35%) of 182 Table 2. One sample was below the 99% prediction interval (discordant low), and 63 were above the 99% prediction interval (discordant high). A normal baseline prPTT was seen in 20 (11%) of 182 samples. Most samples with discordant PTT results, 43 (67%) of 64, had a prolonged baseline prPTT. Of the samples with a long baseline prPTT, 43 (44%) of 97 were discordant compared with samples with a normal baseline prPTT where only 20 (25%) of 81 were discordant.
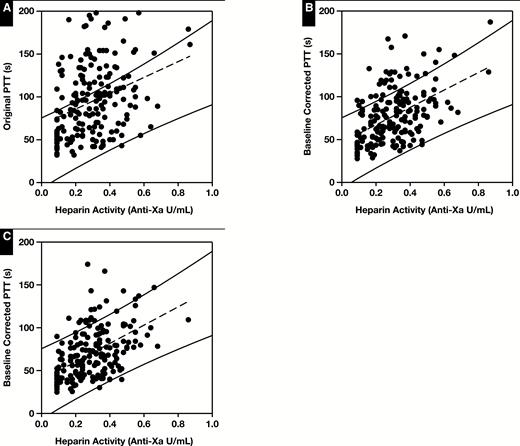
Correlation of heparin activity and measured PTT. A, Original data (n = 182); r2 = 0.11. B, Heparin activity vs baseline-corrected PTT (bcPTT) using correction index (CI) of 1.0; r2 = 0.24. C, Heparin activity vs bcPTT using a CI of 1.5; r2 = 0.27. Solid lines represent the upper and lower limits of the 99% prediction interval from the heparin therapeutic range (Figure 5). Results outside of these limits are considered discordant.
Discordance Levels at Different Correction Indices
| Correction Index | Original Discordance, No. | New Discordance, No. | Total Discordance, No. |
|---|---|---|---|
| 0 | 64 | 0 | 64 |
| 1 | 30 | 2 | 32 |
| 1.1 | 29 | 2 | 31 |
| 1.2 | 27 | 2 | 29 |
| 1.3 | 25 | 2 | 27 |
| 1.4 | 23 | 3 | 26 |
| 1.5 | 20 | 3 | 23 |
| 1.6 | 18 | 4 | 22 |
| 1.7 | 18 | 4 | 22 |
| 1.8 | 16 | 5 | 21 |
| 1.9 | 15 | 6 | 21 |
Correcting the PTT Using the prPTT Baseline
The first PTT adjustment tested was a linear correction proportional to the prPTT. The heparinized PTT result was divided by (prPTT/36.6) to give a new PTT result (36.6 is the mean normal prPTT). Using the prPTT to correct the heparinized PTT reduced the discordance by 50% and increased the correlation between PTT and heparin activity (r2 = 0.24, Figure 6B). To amplify the prPTT correction, an exponential correction index was applied, similar to the international sensitivity index used for international normalized ratio (INR) calculations. The heparinized PTT result was now divided by (prPTT/36.6)CI. The initial linear correction was equivalent to using an exponential CI of 1.0. As the correction index was increased, the total number of results that remained discordant decreased, but the number of samples that became newly discordant also increased Figure 7 and Table 3. A CI of 1.5 was selected that maximized the reduction in total discordant samples while minimizing the number of newly discordant samples. Using a CI of 1.5, overall discordance was reduced by 64%, correlation was increased (r2 = 0.27, Figure 6C), and there was an 81% reduction in discordance when the prPTT was prolonged (Table 2).
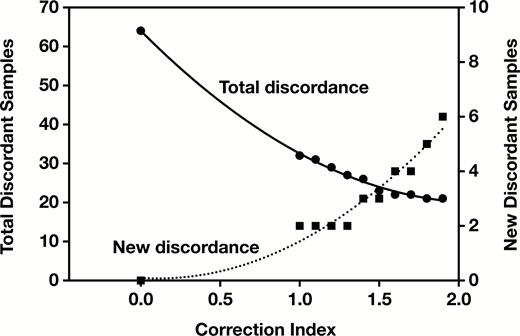
Effect of increasing correction index on the total number of discordant samples and on the number of newly discordant samples.
Discordant Patient Samples Grouped According to Baseline prPTT Resultsa
| Characteristic | Discordant PTT, No. (%a) | Discordant bcPTT (CI = 1.5), No. (%) | Percent Reduction in Discordance |
|---|---|---|---|
| Normal prPTT | 20 (11) | 15 (8) | 25 |
| Long prPTT | 43 (24) | 8 (4) | 81 |
| Short prPTT | 1 (<1) | 0 | 100 |
| Total | 64 (35) | 23 (13) | 64 |
| Characteristic | Discordant PTT, No. (%a) | Discordant bcPTT (CI = 1.5), No. (%) | Percent Reduction in Discordance |
|---|---|---|---|
| Normal prPTT | 20 (11) | 15 (8) | 25 |
| Long prPTT | 43 (24) | 8 (4) | 81 |
| Short prPTT | 1 (<1) | 0 | 100 |
| Total | 64 (35) | 23 (13) | 64 |
bcPTT, baseline-corrected partial thromboplastin time; CI, correction index; prPTT, heparin neutralized, protamine partial thromboplastin time.
aPercent of total samples that were discordant, n = 182.
Discussion
Unfractionated heparin therapy requires laboratory monitoring for appropriate dosing. The PTT is commonly used to monitor heparin therapy due to its sensitivity to both heparin level and coagulation factor levels. The adoption of the anti-Xa heparin activity assay has highlighted the frequency of discordant PTTs that are affected by more than just heparin level and has brought into question how to manage heparin therapy when the PTT and anti-Xa heparin activity results are discordant.6,10-12 We hypothesized that a major contributor to the high discordance rates was prolongation of the baseline PTT. We hypothesized that correction of the heparinized PTT for baseline PTT variations could reduce discordance between the PTT and anti-Xa heparin activity.
Determination of the baseline PTT in patients on heparin requires heparin removal with columns or beads that bind heparin, heparinase to destroy the heparin, or heparin neutralizing agents such as protamine or polybrene. Columns, beads, and heparinase required manual processing of samples. Our goal was to develop an automated method for heparin neutralization that could be run along with the PTT and anti-Xa assay. We used protamine sulfate for automated heparin neutralization. The prPTT values were slightly longer than the original PTT due to dilution and protamine effect, resulting in a prPTT reference range of 31 to 43 seconds. Using samples spiked with heparin, we showed the prPTT method could neutralize heparin up to 1.0 U/mL, returning the original baseline PTT value for normal plasma and for samples with a prolonged baseline PTT due to PT factor deficiency, factor XII deficiency, and both moderate and strong lupus inhibitors. Samples with more than 1 U/mL of heparin can still show some prolongation due to heparin on the prPTT, but none of the 182 heparinized pediatric samples we evaluated contained more than 1 U/mL of heparin.
One option for using the baseline PTT would be to measure a PTT prior to starting heparin therapy, then use this value to adjust subsequent heparinized PTT values. When we looked at individual patients over time, we found their baseline prPTT values changed throughout their hospitalization, indicating that a single baseline PTT was inadequate and a prPTT would be required for each heparin monitoring sample.
Reasons for a prolonged baseline PTT include factor deficiency and deficiency in contact activation, including contact factor deficiencies and phospholipid neutralization by lupus inhibitors. When the baseline PTT was shortened, this was typically due to elevated factor VIII levels.6,7,13 A prolonged PTT does not predict an increased risk of bleeding when it is due to factor XII deficiency or a lupus inhibitor, but the underlying cause for prolongation cannot be determined by PTT alone.5 The PT can be used to determine if a PT factor deficiency is present, but the PT did not predict the prolongation in the prPTT. In our 182 pediatric samples, 25% had a prolonged prPTT and a normal PT, suggesting that the prolongation of the prPTT was caused by something other than a PT factor deficiency.
Studies looking at concordance between PTT and heparin activity results have used different definitions for what it means to be discordant.10,11 Current guidelines for using the PTT to monitor UFH therapy in children recommend targeting a PTT range that corresponds to a heparin activity of 0.3 to 0.7 IU/mL.17 One method is to use concordance boxes based on the therapeutic ranges for heparin activity and PTT. If both the PTT and heparin activity are in the therapeutic range, both below, or both above, they are considered concordant; outside of these limits, they are considered discordant. When using concordance boxes, there tend to be a larger number of discordant values because values at the edge of the defined ranges are labeled as discordant, although they may not be clinically treated as discordant.
To address this issue, we calculated the 99% prediction interval for our heparin therapeutic range to define the limits of concordance (Figure 5). To determine our heparin therapeutic range, we selected 28 pediatric patients on heparin with normal PT and prPTT. The correlation of PTT with anti-Xa for our heparin therapeutic range (r2 = 0.61) was similar to previously reported PTT therapeutic ranges (r2 = 0.35-0.57).4 Using the 99% prediction interval for the 182 samples from all heparinized patients, we would expect only one to two samples to be discordant if the relationship between PTT and heparin activity remained the same for all patients. Instead, we found that overall, 35% of PTT results were discordant. Basing concordance on the heparin therapeutic curve 99% prediction interval may account for why our overall discordance rate of 35% was lower than reported in other studies (40%-75%).6,10-12
We then assessed the relationship of the prPTT to discordance between PTT and heparin activity results. We hypothesized that when the baseline prPTT was prolonged, the heparinized PTT would show a greater prolongation than expected from the heparin therapeutic curve. As expected, the average heparinized PTT for samples with a prolonged prPTT was 21 seconds longer than the average PTT with a normal prPTT (Table 1). Sixty-four samples were discordant, and of these, 97% were discordant high, with PTT more prolonged than predicted. Most patients (67%) with discordant PTT had a prolonged baseline prPTT. In 25% of discordant samples, the prPTT was prolonged even though the PT was normal, indicating the prolonged prPTT was not due to PT deficiency.
To adjust the heparinized PTT for baseline PTT variation, we developed a bcPTT. For the initial correction, we divided the heparinized PTT by a ratio of the prPTT to mean normal prPTT. This correction reduced the number of discordant samples by 50% and improved the correlation between PTT and anti-Xa activity but resulted in a small number of results becoming discordant when the correction was applied. In prior studies using this type of correction (such as the INR), it was found that an exponential correction produced a better fit than a linear correction, so we evaluated the effect of an exponential factor.18 An exponential CI was applied to the ratio of prPTT to mean normal prPTT, in effect amplifying the correction being applied due to the variations in the prPTT. The larger the CI value, the greater the effect it had on the PTT and the greater difference there was between the original PTT and the bcPTT. A CI of 1.5 was selected as the optimal value to maximize the reduction in total discordant samples (64%) while minimizing the number of newly discordant samples (1.6%) (Figure 7). This correction was effective for samples with long or short prPTT values. With a long prPTT, the bcPTT was decreased compared with the original PTT, and for a short prPTT, the bcPTT was increased compared with the PTT. For samples with normal prPTT, the correction had only a minimal effect on the heparinized PTT result. For the samples that remained discordant despite correction with a CI of 1.5, most were discordant high (91%) and had a normal prPTT (71%). Another possible use of the automated protamine neutralization is a clinician request for a baseline PTT with heparin neutralized. Automated protamine neutralization can be used to rule out heparin as a cause of unexpected prolonged PTT.
Overall, we demonstrated that an automated heparin neutralization assay using protamine sulfate could be used to generate a baseline prPTT for patients on UFH therapy. This baseline prPTT result varied during the course of a hospitalization and likely contributed to discordance between the PTT and heparin activity results. The prPTT was used to generate a bcPTT that was less sensitive to baseline PTT variations, improving the correlation between PTT and anti-Xa heparin activity. Further studies are required to confirm if the bcPTT is a better measure for heparin monitoring and to determine its clinical utility.
