


Abstract
Quantitative olfactory assessment has demonstrated clinical utility for the evaluation of a range of neurologic, psychiatric, and sinonasal conditions. Here, we provide age, sex, race, and education-specific normative data for the 12-item Sniffin Sticks Odor Identification Test (SSOIT-12) in older Black and White U.S. adults without preclinical or clinical dementia or sinonasal disease.
A sample of 2,224 Atherosclerosis Risk in Communities study participants aged 66–89 years were included. A normative regression equation was developed using a linear model for the association of age, sex, race, and education with odor identification score. Regression-based normative mean scores and percentiles were generated by age, sex, race, and education groups.
Participants (mean age = 74 years, 59% women, 20% Black, 48% > high school education) had a mean SSOIT-12 score of 9.8. Age, sex, race, and education were all associated with odor identification performance (all ps < .05). A linear regression model for the predicted SSOIT-12 score was developed for use with an individual’s actual SSOIT-12 score in order to calculate the Z-score and corresponding percentile for a specific age, sex, race, and education group. Data are also reported in tabular format.
Our study provides SSOIT-12 normative data obtained from a large population of White and Black older adults without preclinical or clinical dementia or sinonasal disease living in the USA. These findings can aid clinicians in assessing the degree of olfactory loss, establishing concordance with a person’s perception of olfactory difficulties and quantitatively monitoring changes in olfactory performance over time.
Introduction
The olfactory system is a relatively neglected, yet informative avenue, for understanding neurodegenerative and neuropsychiatric conditions in later life. Two synapses separate the olfactory sensory environment from cortical targets, allowing olfactory psychophysical measures direct access to the orbitofrontal and limbic neurocircuitry implicated in multiple neurodegenerative conditions (Doty & Kamath, 2014). Smell loss can predate clinical motor signs by up to a decade in Parkinson’s disease (Chen et al., 2017), and hyposmia serves as a vulnerability marker for transition to mild cognitive impairment or dementia due to Alzheimer’s disease (Devanand et al., 2015; Schubert et al., 2008; Yaffe et al., 2017). Olfactory loss in late life is also an independent predictor of all-cause mortality (Pang et al., 2022). During the COVID-19 pandemic, chronic olfactory loss emerged as a growing public health concern, with an exponential increase in the number of people at risk for long-term olfactory dysfunction in the USA (Khan et al., 2022). As such, there is increasing need for normative data for psychophysical olfactory tests in Black and White older adults.
The 12-item Sniffin Sticks Odor Identification Test (SSOIT-12) was initially developed in Germany and was normed in a cohort of 1,012 healthy subjects, 5 to 86 years of age, from Dresden, Germany (Hummel et al., 1997). The test is composed of 12 common odors in which participants identify the odorant from four choices using a forced-choice multiple-choice format. Although the test has since been normed in other populations across Europe, there are limited normative data for the 12-item version in older adults living in the USA and more specifically in demographic groups historically underrepresented in research. The absence of these data diminishes the clinical utility of the SSOIT-12 in the USA. In the current study, we expanded on existing work by developing normative data for the SSOIT-12 in a large clinically characterized sample of Black and White adults living in the USA over the age of 65 years from the Atherosclerosis in Risk Communities (ARIC) study. Of note, we used a subset of the ARIC study population who completed olfactory testing and were free of dementia, neurological conditions, and sinonasal disease. We considered multiple demographic factors that may influence olfaction in our analyses, including age, sex, race, and education level, based on prior work describing the influence of these factors on odor identification ability (Dong et al., 2017; Doty & Kamath, 2014; Papazian & Pinto, 2021).
Materials and Methods
Study Population and Design
The ARIC study is a prospective population-based cohort of 15,792 adults (initially aged 45 to 64 years) who were first evaluated at baseline from 1987 to 1989. Participants were recruited from U.S. communities in Washington County, Maryland; Forsyth County, North Carolina; Jackson, Mississippi; and selected suburbs of Minneapolis, Minnesota by use of area sampling or probability samples in which population-wide lists (e.g., driver’s licenses) were employed. Only Black participants were recruited in Jackson, Mississippi. Each institution of the ARIC study has Institutional Review Board approval and each participant (or legally authorized representatives) provided written informed consent in order to participate at each study visit. The current study complies with the Declaration of Helsinki for medical research involving human subjects. The ARIC protocol and sampling procedure is fully described in prior work (The ARIC Investigators, 1989; Wright et al., 2021).
The current study involves a subset of surviving participants examined at ARIC Visit 5 (2011 to 2013), when olfaction was first assessed. A total of 6,538 participants attended Visit 5. In order to adjudicate dementia cases, the ARIC study created a Visit 5 normative sample, in which individuals were excluded for factors indicative of clinical or preclinical dementia and factors which may influence their performance on cognitive testing, including the following: prior stroke, history of neurological disease or brain surgery/radiation, use of cholinomimetics, a prorated Mini Mental State Examination (MMSE; Folstein et al., 1975) score <22, self-reported memory problems, self-reported diagnosis of Alzheimer’s dementia, cognitive impairment or vascular dementia, an ARIC study dementia diagnosis (Knopman et al., 2016) at or before Visit 5 or occurring after Visit 5 and before 2016, an ARIC study diagnosis of mild cognitive impairment at Visit 5, current depression, presence of two APOE ε4 alleles, decline in cognitive testing prior to Visit 5 (performance in the worst 10th percentile on 1/3 cognitive tests or in the worst 20th percentile on 2/3 cognitive tests), self-reported race other than Black or White, missing the Reading Subtest of the Wide Range Achievement Test—3rd edition (WRAT-3R; Wilkinson, 1993), a WRAT-3R raw score <10, or missing education level. For the current study, we applied the following additional exclusion criteria: history of sinonasal disease (i.e., identified from continuously collected ARIC hospital surveillance ICD-9 diagnostic codes for chronic rhinosinusitis, nasal polyps, and sinus surgery), history of repeated (2+) head injury or moderate/severe/penetrating head injury, and missing olfactory data. The number of participants excluded following application of each exclusion criteria are shown in Fig. 1. The final sample included 2,224 older adults.

Normative population inclusion/exclusion, ARIC Visit 5 (2011–2013).
Odor Identification Performance
Odor identification performance was assessed with the English version of the 12-item SSOIT (Hummel et al., 1997). Participants were presented with an odor-embedded pen and asked to smell and identify the odor from four choices in a force-choice multiple-choice format. The 12 odors include orange, leather, cinnamon, peppermint, banana, lemon, licorice, coffee, cloves, pineapple, rose, and fish. The score was the total number of correct identifications, with a maximum possible score of 12.
Statistical Analysis
To characterize our analytic population, we quantified several variables known to influence olfactory performance. We present this information for our total analytic sample overall and stratified by sex (men; women). The following demographic covariates are presented: age (years), self-reported race (Black; White), field center (Minneapolis, MN; Washington County, MD; Jackson, MS; Forsyth County, NC), and education (<high school; high school, GED, or vocational school; some college, college, graduate or professional school). In addition, the following lifestyle, cardiovascular, and cognitive factors are presented: cigarette smoking (current, former, never), alcohol consumption (current, former, never), diabetes (defined as fasting glucose ≥126 mg/dl, non-fasting glucose ≥200 mg/dl, hemoglobin A1c >6.5%, self-reported diagnosis by physician, or use of diabetes medications), hypertension (defined as systolic blood pressure ≥ 140 mmHg, diastolic blood pressure ≥ 90 mmHg, self-reported diagnosis by physician, or use of hypertension medications), MMSE score (total number correct), and WRAT-3R score (total raw score).
In order to create SSOIT-12 norms, we modeled the association of multiple demographic factors with odor identification score using linear regression, consistent with prior normative studies of the SSOIT in other populations (Hummel et al., 1997; Vickers et al., 2019). We tested the assumptions for linear regression analysis by examining the distribution of residual values, homoscedasticity, and multicollinearity. As noted in prior work (Pek et al., 2018), normality tests can be overly sensitive in larger samples and assumptions of normality can be relaxed with larger sample sizes. Although there was a tendency toward a negatively skewed distribution for SSOIT scores, data were acceptable to proceed with linear regression analyses. Furthermore, Piovesana and Senior (2018) note that larger sample sizes (n ≥ 85) show stable means and standard deviations regardless of the degree of skewness. As such, transformations were not performed.
We chose age, sex, race, and education level for regression-based analysis based on prior work describing the influence of these factors on odor identification ability (Dong et al., 2017; Doty & Kamath, 2014; Papazian & Pinto, 2021). We also considered interactions of multiple variables including age*sex, age*race, sex*race, age*education, sex*education, and race*education. We next calculated the linear regression coefficients in tabular form. The predicted mean SSOIT-12 scores stratified by age, sex, self-reported race, and education derived from our linear regressions are presented in Figs. 2 and 3. We next calculated regression-based normative data according to the following formula:
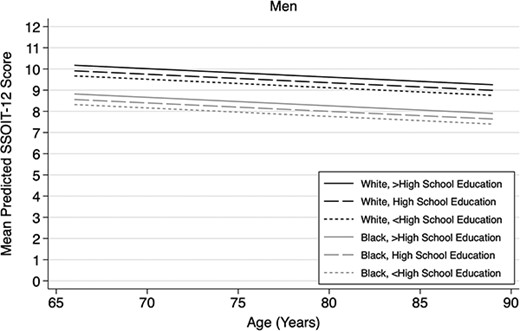
Predicted mean SSOIT-12 test performance derived from linear regression model† by age, race, and education among men. †Linear regression model: Intercept 9.59; Age (centered at 74 years)= −0.04 Female= 0.65; Black= −1.35; Less than high school education= −0.24; Greater than high school education= 0.26; SD (residual)*= 1.91; *Root mean square error from full linear regression model.
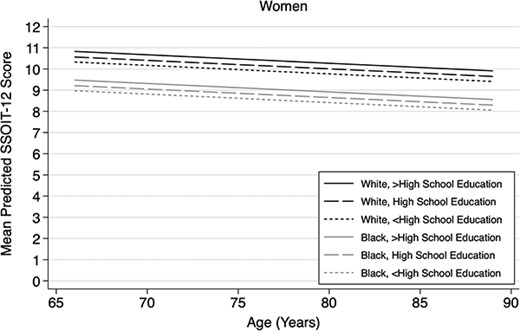
Predicted mean SSOIT-12 test performance derived from linear regression model† by age, race, and education among women. †Linear Regression Model: Intercept=9.59; Age (centered at 74 years)=−0.04; Female=0.65; Black=−1.35; Less than High School Education=−0.24; Greater than High School Education=0.26; SD(residual)*=1.91; *Root Mean Square Error (RMSE) from full linear regression model
where we subtracted the predicted SSOIT-12 score using the linear regression model from each actual SSOIT-12 score (i.e., the residual score) and dividing by the standard deviation of the residuals from the model (i.e., root mean square error) and then converted the resulting Z-score to a percentile (Oosterhuis et al., 2016; Vickers et al., 2019). The percentile ranges corresponding to each SSOIT-12 score are presented stratified by age, sex, self-reported race, and education in Tables 2 and 3 using ranges reported in the American Academy of Clinical Neuropsychology (AACN) consensus recommendations for descriptive labels (Guilmette et al., 2020). In addition, percentiles corresponding to each SSOIT-12 score are presented in Supplemental Tables S1 and S2 for interested researchers and clinicians.
Complete item-level SSOIT-12 data were entered in a subset of participants (n = 885). First, overall differences in sample characteristics were examined between individuals with and without item-level data. Because item-level SSOIT-12 data were entered in a subset of participants, we created inverse probability weights so that the item-level analyses presented herein are representative of our entire analytic population. The weights were created using logistic regression models (including SSOIT-12 score, age, sex, race, and education) and were proportional to the inverse of the probability of having item-level data and were standardized so that the sum of the weights equaled the number of participants with item-level data. We then examined performance on each of the 12 odors from the SSOIT-12 by age group, sex, race, and education level using weighted chi-square tests.
A two-tailed p value <.05 was considered statistically significant, and all analyses were performed using Stata SE version 17 (StataCorp).
Data Availability
ARIC data are accessible from the NIH National Heart, Lung, and Blood Institute (NHLBI) sponsored Biologic Specimen and Data Repository Information Coordinating Center at biolincc.nhlbi.nih.gov/studies/aric-non. Additional information regarding ARIC is available at https://aric.cscc.unc.edu/aric9/.
Results
Sample Characteristics
Sample characteristics are shown in our overall normative sample and by sex in Table 1. ARIC participants in the overall normative analytic sample had a mean age of 74.3, 59.4% of the participants were women, 20.3% were Black, and 48.1% had greater than high school education. With respect to vascular risk factors, 5.2% were current smokers, 54.8% were current alcohol consumers, 70.5% had hypertension, and 31.1% had diabetes. The mean SSOIT-12 score for the overall sample was 9.8, the mean MMSE score was 28.3, and the mean WRAT-3R score was 46.0.
Participant characteristics overall and stratified by sex, ARIC Visit 5 (2011–2013), N = 2,224
| Overall n = 2,224 | Men (n = 902) | Women (n = 1,322) | p Valuea | |
|---|---|---|---|---|
| SSOIT-12 score, mean (SD) | 9.8 (2.0) | 9.5 (2.2) | 10.0 (1.9) | <.001 |
| Age (years), mean (SD) | 74.3 (4.7) | 74.7 (4.6) | 74.1 (4.7) | .004 |
| Age category, n (%) | .019 | |||
| 66 to <70 years | 327 (14.7) | 109 (12.1) | 218 (16.5) | |
| 70 to <75 years | 951 (42.8) | 378 (41.9) | 573 (43.3) | |
| 75 to <80 years | 600 (27.0) | 261 (28.9) | 339 (25.6) | |
| 80 to <85 years | 284 (12.8) | 127 (14.1) | 157 (11.9) | |
| 85 to <90 years | 62 (2.8) | 27 (3.0) | 35 (2.6) | |
| Race | .009 | |||
| White | 1772 (79.7) | 743 (82.4) | 1029 (77.8) | |
| Black | 452 (20.3) | 159 (17.6) | 293 (22.2) | |
| Field center, n (%) | .002 | |||
| Minneapolis, Minnesota | 720 (32.4) | 308 (34.1) | 412 (31.2) | |
| Washington County, Maryland | 607 (27.3) | 230 (25.5) | 377 (28.5) | |
| Forsyth County, North Carolina | 485 (21.8) | 222 (24.6) | 263 (19.9) | |
| Jackson, Mississippi | 412 (18.5) | 142 (15.7) | 270 (20.4) | |
| Education, n (%) | <.001 | |||
| Less than high school | 225 (10.1) | 75 (8.3) | 150 (11.3) | |
| High school, GED, vocational school | 930 (41.8) | 325 (36.0) | 605 (45.8) | |
| Some college, college, graduate, or professional school | 1069 (48.1) | 502 (55.7) | 567 (42.9) | |
| Cigarette smoking, n (%) | <.001 | |||
| Current | 116 (5.2) | 45 (5.0) | 71 (5.4) | |
| Former | 1000 (45.0) | 505 (56.0) | 495 (37.4) | |
| Never | 886 (39.8) | 260 (28.8) | 626 (47.4) | |
| Not reported | 222 (10.0) | 92 (10.2) | 130 (9.9) | |
| Alcohol consumption, n (%) | <.001 | |||
| Current | 1219 (54.8) | 550 (61.0) | 669 (50.6) | |
| Former | 541 (24.3) | 249 (27.6) | 292 (22.1) | |
| Never | 406 (18.3) | 84 (9.3) | 322 (24.4) | |
| Not reported | 58 (2.6) | 19 (2.1) | 39 (3.0) | |
| Hypertension, n (%) | 1569 (70.5) | 637 (70.6) | 932 (70.5) | .950 |
| Diabetes, n (%) | 692 (31.1) | 317 (35.1) | 375 (28.4) | <.001 |
| Prorated MMSE score, mean (SD) | 28.3 (1.7) | 28.0 (1.7) | 28.4 (1.6) | <.001 |
| WRAT-3Rb score, mean (SD) | 46.0 (7.1) | 45.8 (7.4) | 46.0 (6.9) | .520 |
ap values comparing men and women were calculated using t-tests for continuous variables and Pearson’s chi-squared tests for categorical variables.
bReading Subtest of the Wide Range Achievement Test—3rd edition (WRAT-3R; Wilkinson, 1993).
Men and women differed on several demographic and clinical characteristics. Men were slightly older and had a higher composition of White participants. In addition, men were more likely to have greater than high school education, be a former smoker, and current consumer of alcohol. Women were more likely to be never smokers. Hypertension prevalence was comparable between men and women, though men had higher prevalence of diabetes. Finally, women had slightly higher SSOIT-12 and MMSE scores on average, whereas the WRAT-3R scores were comparable by sex.
Normative Data
Multiple factors influence performance on the SSOIT-12 and our model supported that age, sex, race, and education level were associated with olfactory performance (all ps < .05). Interactions of age*sex, age*race, sex*race, age*education, sex*education, and race*education were not significant (all ps > .26) and were therefore not included in our final normative model. Using the aforementioned analytic approach, a normative regression equation was created to compute the predicted SSOIT-12 score using age, sex, race, and education level as predictor variables. The final equation was
For example, a 67-year-old Black woman with greater than high school education obtained a score of 8 on the SSOIT-12 when tested in the clinic, representing her actual score. The normative regression equation and predicted score generated for this individual would be calculated as follows: (−0.04 × [67–74]) + (0.65) + (−1.35) + (0.26) + 9.59. Calculation of the equation results in a predicted score of 9.43. The actual and predicted scores can be used to calculate the individual’s residual score by subtracting the predicted score (9.43) from the actual SSOIT-12 score (8). The resulting difference score (−1.43) is then divided by the SD(residual) value (1.91) to generate a standardized Z-score (−0.75), which corresponds to the 23rd percentile. For this example individual, her actual score of 8 is indicative of low average performance using AACN consensus recommendations for descriptive labels (Table 3).
An 84-year-old White man with less than high school education with an actual score of 5 on the SSOIT-12 would generate the following equation: (−0.04 × [84–74]) + (−0.24 if Less than High School Education) + 9.59. Calculation of the equation results in a predicted score of 8.95 and a Z-score of −2.07, which corresponds with less than the 2nd percentile for his age, sex, race, and education level. His score is indicative of exceptionally low performance using AACN consensus recommendations for descriptive labels (Table 2).
| Percentile | Age 66 to <70 years SSOIT score | Age 70 to <75 years SSOIT score | Age 75 to <80 years SSOIT score | Age 80 to <85 years SSOIT score | Age 85 to < 90 years SSOIT score |
|---|---|---|---|---|---|
| White men with less than high school education | |||||
| ≥98 | — | — | — | — | — |
| 91–97 | — | 12 | 12 | 12 | 12 |
| 75–90 | 11–12 | 11 | 11 | 11 | 11 |
| 25–74 | 9–10 | 9–10 | 8–10 | 8–10 | 8–10 |
| 9–24 | 7–8 | 7–8 | 7 | 7 | 7 |
| 2–8 | 6 | 6 | 6 | 6 | 5–6 |
| <2 | 0–5 | 0–5 | 0–5 | 0–5 | 0–4 |
| White men with high school education | |||||
| ≥98 | — | — | — | — | — |
| 91–97 | — | — | 12 | 12 | 12 |
| 75–90 | 12 | 11–12 | 11 | 11 | 11 |
| 25–74 | 9–11 | 9–10 | 9–10 | 8–10 | 8–10 |
| 9–24 | 8 | 8 | 7–8 | 7 | 7 |
| 2–8 | 6–7 | 6–7 | 6 | 6 | 6 |
| <2 | 0–5 | 0–5 | 0–5 | 0–5 | 0–5 |
| White men with greater than high school education | |||||
| ≥98 | — | — | — | — | — |
| 91–97 | — | — | — | — | 12 |
| 75–90 | 12 | 12 | 11–12 | 11–12 | 11 |
| 25–74 | 9–11 | 9–11 | 9–10 | 9–10 | 8–10 |
| 9–24 | 8 | 8 | 8 | 7–8 | 7 |
| 2–8 | 7 | 6–7 | 6–7 | 6 | 6 |
| <2 | 0–6 | 0–5 | 0–5 | 0–5 | 0–5 |
| Black men with less than high school education | |||||
| ≥98 | 12 | 12 | 12 | 12 | 12 |
| 91–97 | 11 | 11 | 11 | 11 | 10–11 |
| 75–90 | 10 | 10 | 10 | 9–10 | 9 |
| 25–74 | 7–9 | 7–9 | 7–9 | 7–8 | 7–8 |
| 9–24 | 6 | 6 | 6 | 6 | 5–6 |
| 2–8 | 5 | 5 | 4–5 | 4–5 | 4 |
| <2 | 0–4 | 0–4 | 0–3 | 0–3 | 0–3 |
| Black men with high school education | |||||
| ≥98 | — | — | 12 | 12 | 12 |
| 91–97 | 11–12 | 11–12 | 11 | 11 | 11 |
| 75–90 | 10 | 10 | 10 | 10 | 9–10 |
| 25–74 | 8–9 | 7–9 | 7–9 | 7–9 | 7–8 |
| 9–24 | 6–7 | 6 | 6 | 6 | 6 |
| 2–8 | 5 | 5 | 5 | 4–5 | 4–5 |
| <2 | 0–4 | 0–4 | 0–4 | 0–3 | 0–3 |
| Black men with greater than high school education | |||||
| ≥98 | — | — | — | 12 | 12 |
| 91–97 | 12 | 12 | 11–12 | 11 | 11 |
| 75–90 | 10–11 | 10–11 | 10 | 10 | 10 |
| 25–74 | 8–9 | 8–9 | 8–9 | 7–9 | 7–9 |
| 9–24 | 7 | 6–7 | 6–7 | 6 | 6 |
| 2–8 | 5–6 | 5 | 5 | 5 | 4–5 |
| <2 | 0–4 | 0–4 | 0–4 | 0–4 | 0–4 |
aPercentile ranges correspond to the ranges reported and recommended in the American Academy of Clinical Neuropsychology (AACN) consensus recommendations for descriptive labels (Guilmette et al., 2020). Recommended score labels are as follows: exceptionally low (<2 percentile), below average score (2–8 percentile), low average (9–24 percentile), average (25–74 percentile), high average (75–90 percentile), above average (91–97 percentile), and exceptionally high (≥98 percentile).
bScores for each age group were derived using the midpoint of each age category (i.e., age 68, 72.5, 77.5, 82.5, and 87.5 years, respectively).
| Percentile | Age 66 to <70 years SSOIT score | Age 70 to <75 years SSOIT score | Age 75 to <80 years SSOIT score | Age 80 to <85 years SSOIT score | Age 85 to < 90 years SSOIT score |
|---|---|---|---|---|---|
| White men with less than high school education | |||||
| ≥98 | — | — | — | — | — |
| 91–97 | — | 12 | 12 | 12 | 12 |
| 75–90 | 11–12 | 11 | 11 | 11 | 11 |
| 25–74 | 9–10 | 9–10 | 8–10 | 8–10 | 8–10 |
| 9–24 | 7–8 | 7–8 | 7 | 7 | 7 |
| 2–8 | 6 | 6 | 6 | 6 | 5–6 |
| <2 | 0–5 | 0–5 | 0–5 | 0–5 | 0–4 |
| White men with high school education | |||||
| ≥98 | — | — | — | — | — |
| 91–97 | — | — | 12 | 12 | 12 |
| 75–90 | 12 | 11–12 | 11 | 11 | 11 |
| 25–74 | 9–11 | 9–10 | 9–10 | 8–10 | 8–10 |
| 9–24 | 8 | 8 | 7–8 | 7 | 7 |
| 2–8 | 6–7 | 6–7 | 6 | 6 | 6 |
| <2 | 0–5 | 0–5 | 0–5 | 0–5 | 0–5 |
| White men with greater than high school education | |||||
| ≥98 | — | — | — | — | — |
| 91–97 | — | — | — | — | 12 |
| 75–90 | 12 | 12 | 11–12 | 11–12 | 11 |
| 25–74 | 9–11 | 9–11 | 9–10 | 9–10 | 8–10 |
| 9–24 | 8 | 8 | 8 | 7–8 | 7 |
| 2–8 | 7 | 6–7 | 6–7 | 6 | 6 |
| <2 | 0–6 | 0–5 | 0–5 | 0–5 | 0–5 |
| Black men with less than high school education | |||||
| ≥98 | 12 | 12 | 12 | 12 | 12 |
| 91–97 | 11 | 11 | 11 | 11 | 10–11 |
| 75–90 | 10 | 10 | 10 | 9–10 | 9 |
| 25–74 | 7–9 | 7–9 | 7–9 | 7–8 | 7–8 |
| 9–24 | 6 | 6 | 6 | 6 | 5–6 |
| 2–8 | 5 | 5 | 4–5 | 4–5 | 4 |
| <2 | 0–4 | 0–4 | 0–3 | 0–3 | 0–3 |
| Black men with high school education | |||||
| ≥98 | — | — | 12 | 12 | 12 |
| 91–97 | 11–12 | 11–12 | 11 | 11 | 11 |
| 75–90 | 10 | 10 | 10 | 10 | 9–10 |
| 25–74 | 8–9 | 7–9 | 7–9 | 7–9 | 7–8 |
| 9–24 | 6–7 | 6 | 6 | 6 | 6 |
| 2–8 | 5 | 5 | 5 | 4–5 | 4–5 |
| <2 | 0–4 | 0–4 | 0–4 | 0–3 | 0–3 |
| Black men with greater than high school education | |||||
| ≥98 | — | — | — | 12 | 12 |
| 91–97 | 12 | 12 | 11–12 | 11 | 11 |
| 75–90 | 10–11 | 10–11 | 10 | 10 | 10 |
| 25–74 | 8–9 | 8–9 | 8–9 | 7–9 | 7–9 |
| 9–24 | 7 | 6–7 | 6–7 | 6 | 6 |
| 2–8 | 5–6 | 5 | 5 | 5 | 4–5 |
| <2 | 0–4 | 0–4 | 0–4 | 0–4 | 0–4 |
aPercentile ranges correspond to the ranges reported and recommended in the American Academy of Clinical Neuropsychology (AACN) consensus recommendations for descriptive labels (Guilmette et al., 2020). Recommended score labels are as follows: exceptionally low (<2 percentile), below average score (2–8 percentile), low average (9–24 percentile), average (25–74 percentile), high average (75–90 percentile), above average (91–97 percentile), and exceptionally high (≥98 percentile).
bScores for each age group were derived using the midpoint of each age category (i.e., age 68, 72.5, 77.5, 82.5, and 87.5 years, respectively).
| Percentile | Age 66 to <70 years SSOIT score | Age 70 to <75 years SSOIT score | Age 75 to <80 years SSOIT score | Age 80 to <85 years SSOIT score | Age 85 to <90 years SSOIT score |
|---|---|---|---|---|---|
| White women with less than high school education | |||||
| ≥98 | — | — | — | — | — |
| 91–97 | — | — | — | — | 12 |
| 75–90 | 12 | 12 | 12 | 11–12 | 11 |
| 25–74 | 9–11 | 9–11 | 9–11 | 9–10 | 9–10 |
| 9–24 | 8 | 8 | 8 | 8 | 7–8 |
| 2–8 | 7 | 7 | 6–7 | 6–7 | 6 |
| <2 | 0–6 | 0–6 | 0–5 | 0–5 | 0–5 |
| White women with high school education | |||||
| ≥98 | — | — | — | — | — |
| 91–97 | — | — | — | — | — |
| 75–90 | 12 | 12 | 12 | 12 | 11–12 |
| 25–74 | 10–11 | 9–11 | 9–11 | 9–11 | 9–10 |
| 9–24 | 8–9 | 8 | 8 | 8 | 8 |
| 2–8 | 7 | 7 | 7 | 6–7 | 6–7 |
| <2 | 0–6 | 0–6 | 0–6 | 0–5 | 0–5 |
| White women with greater than high school education | |||||
| ≥98 | — | — | — | — | — |
| 91–97 | — | — | — | — | — |
| 75–90 | 12 | 12 | 12 | 12 | 12 |
| 25–74 | 10–11 | 10–11 | 10–11 | 9–11 | 9–11 |
| 9–24 | 9 | 8–9 | 8–9 | 8 | 8 |
| 2–8 | 7–8 | 7 | 7 | 7 | 7 |
| <2 | 0–6 | 0–6 | 0–6 | 0–6 | 0–6 |
| Black women with less than high school education | |||||
| ≥98 | — | — | — | — | 12 |
| 91–97 | 12 | 12 | 12 | 11–12 | 11 |
| 75–90 | 11 | 10–11 | 10–11 | 10 | 10 |
| 25–74 | 8–10 | 8–9 | 8–9 | 7–9 | 7–9 |
| 9–24 | 7 | 7 | 6–7 | 6 | 6 |
| 2–8 | 5–6 | 5–6 | 5 | 5 | 5 |
| <2 | 0–4 | 0–4 | 0–4 | 0–4 | 0–4 |
| Black women with high school education | |||||
| ≥98 | — | — | — | — | — |
| 91–97 | 12 | 12 | 12 | 12 | 11–12 |
| 75–90 | 11 | 11 | 11 | 10–11 | 10 |
| 25–74 | 8–10 | 8–10 | 8–10 | 8–9 | 8–9 |
| 9–24 | 7 | 7 | 7 | 6–7 | 6–7 |
| 2–8 | 6 | 6 | 5–6 | 5 | 5 |
| <2 | 0–5 | 0–5 | 0–4 | 0–4 | 0–4 |
| Black women with greater than high school education | |||||
| ≥98 | — | — | — | — | — |
| 91–97 | 12 | 12 | 12 | 12 | 12 |
| 75–90 | 11 | 11 | 11 | 11 | 10–11 |
| 25–74 | 9–10 | 8–10 | 8–10 | 8–10 | 8–9 |
| 9–24 | 7–8 | 7 | 7 | 7 | 6–7 |
| 2–8 | 6 | 6 | 6 | 5–6 | 5 |
| <2 | 0–5 | 0–5 | 0–5 | 0–4 | 0–4 |
aPercentile ranges correspond to the ranges reported and recommended in the American Academy of Clinical Neuropsychology (AACN) consensus recommendations for descriptive labels (Guilmette et al., 2020). Recommended score labels are as follows: exceptionally low (<2 percentile), below average score (2–8 percentile), low average (9–24 percentile), average (25–74 percentile), high average (75–90 percentile), above average (91–97 percentile), and exceptionally high (≥98 percentile).
bScores for each age group were derived using the midpoint of each age category (i.e., age 68, 72.5, 77.5, 82.5, and 87.5 years, respectively).
A subset of participants had complete item-level SSOIT-12 data available (n = 885). Nearly all Black participants had available item-level SSOIT-12 data (98%), whereas only 25% of White participants had available item-level SSOIT-12 data. Compared to participants without available item-level data, participants with item-level data were of similar age, were more likely to be women, have less than high school education, and scored lower on the SSOIT-12 (Supplemental Table S3). Patterns of individual item odor identification performance by age, sex, race, and education are shown in Table 4. Cinnamon and pineapple odors performed consistently across age, sex, race, and education levels. Older individuals were more likely to incorrectly identify orange odor compared to younger individuals. Men were more likely to incorrectly identify peppermint, licorice, coffee, cloves, and rose compared to women. Black participants were more likely to incorrectly identify orange, leather, banana, lemon, licorice, cloves, rose, and fish compared to White participants. Participants with lower education were more likely to incorrectly identify orange, leather, banana, lemon, licorice, coffee, and cloves compared to participants with higher education.
Discussion
Quantitative olfactory assessment has demonstrated clinical utility for the evaluation of a range of neurologic, psychiatric, and sinonasal conditions. Formal assessment of olfactory functioning can capture the degree of orbitofrontal involvement or damage following traumatic brain injury or anterior communicating artery aneurysms (Zald & Andreotti, 2010) and has been employed pre–post intervention for chronic sinusitis (Haxel et al., 2017). Olfactory testing can differentiate persons with Parkinson’s disease and dementia with Lewy bodies from individuals with essential tremor and atypical forms of neurodegenerative parkinsonism (Doty & Hawkes, 2019), and has been used in conjunction with cognitive testing to identify older adults who do not transition to dementia (Devanand et al., 2020). In the current study, we established age-, sex-, race-, and education-adjusted normative data for the 12-item SSOIT in a large well-characterized sample of Black and White U.S. older adults. The SSOIT-12 has been normed in multiple European countries, but the lack of these data in the U.S. population has limited its clinical applicability to date, particularly in individuals over the age of 65 and who identify as Black. To our knowledge, the current study represents the largest normative sample available for SSOIT-12 in the USA, importantly, with exclusions for cognitive impairment and for factors such as sinonasal disease that can directly affect olfactory ability.
The decline in odor identification ability we observed across increasing age groups has been demonstrated in multiple prior studies of olfactory performance in older adults (Hedner et al., 2010; Pinto et al., 2015; Ship et al., 1996; Wehling et al., 2016). A recent systematic review by Desiato et al., (2021) examined the prevalence of olfaction dysfunction in general populations worldwide. A higher prevalence of olfactory dysfunction was observed in older cohorts when compared to younger cohorts. In the large population-based Betula Project study of health and cognition in aging, the investigators found that age, sex, and educational attainment were unique predictors of decline in odor identification ability (Hedner et al., 2010). Similarly, Pinto et al., (2015) found a greater magnitude of olfactory decline in older participants. Due to its direct environmental exposure, the olfactory nerve is particularly vulnerable to injury and disruptions from environmental pathogens. Age-related decline in odor identification performance has been attributed to alterations in the nature and integrity of peripheral and central olfactory regions. With increasing age, cumulative environmental exposure can lead to olfactory epithelial damage and olfactory receptor neurons can lose selectivity to odors (Doty & Kamath, 2014). Of note, performance on odor identification tasks has been linked with olfactory bulb (OB) size (Lu et al., 2021), and right amygdala and bilateral entorhinal cortex volumes (Albers et al., 2016; Segura et al., 2013). OB size declines with increasing age, starting at the fourth decade of life (Yousem et al., 1998). Recently, Lu et al., (2021) found that the association between SSOIT-12 performance and central olfactory brain regions was modified by OB volume and the magnitude of this OB-mediated association was dependent on and increased with age. The findings from our “robust” normative population suggest that the association of age with reduced olfactory function is present even among individuals without preclinical or clinical dementia and sinonasal disease.
Item performance on the SSOIT-12 by age, sex, race, and education level, n = 885
| SSOIT-12 item number | Odor | Age | Sex | Race | Education |
|---|---|---|---|---|---|
| 1 | Orange | a | a | a | |
| 2 | Leather | a | a | ||
| 3 | Cinnamon | ||||
| 4 | Peppermint | a | |||
| 5 | Banana | a | a | ||
| 6 | Lemon | a | a | ||
| 7 | Licorice | a | a | a | |
| 8 | Coffee | a | a | ||
| 10 | Pineapple | ||||
| 11 | Rose | a | a | ||
| 12 | Fish | a |
Notes: Age was categorized as 66 to <70, 70 to <75, 75 to <80, 80 to <85, 85–90 years. Sex was compared between men and women. Race was compared between Black and White participants. Education was compared between individuals with less than high school, high school or equivalent, and greater than high school. Each odor was categorized as correctly versus incorrectly identified.
aHighlighted cells represent p <.05 from weighted chi-square tests; older individuals, men, Black participants, and individuals with lower levels of education were more likely to incorrectly identify odor.
The sex differences we observed in odor identification ability are another well-replicated finding (for a review, see: Sorokowski et al. 2019). In both cross-sectional and longitudinal studies of olfaction, men show reduced olfactory abilities and a greater rate of decline compared to women (Hedner et al., 2010; Pinto et al., 2015; Ship et al., 1996; Wehling et al., 2016). Differences in neuroendocrine functions, socialization, and cognition are hypothesized to explain the female advantage in olfactory functioning. Olfactory performance can fluctuate as a function of gonadal hormones and their influence on brain regions subserving olfactory functioning. Socially, women may have higher exposure and familiarity with odors and greater olfactory awareness in their social environments compared to men. Better odor identification ability is associated with a higher quality “social life” in women, measured by the amount of friends/relatives and socializing (Boesveldt et al., 2017). In contrast, men experience higher rates of occupational hazards and exposure to toxic chemicals, which can adversely affect olfactory functions. Finally, measures of odor identification are cognitively mediated, as individuals are required to attach a semantic label to a presented odor from four choices. As such, the cognitive advantage in verbal abilities observed for women may in part explain olfactory-related sex differences (Sorokowski et al., 2019).
Race has emerged as another unique predictor of olfactory decline. In the subset of our population with individual item-level data, we observed the greatest differences in individual item performance by race when compared to differences by age, sex, and education. In the U.S.-based National Health and Nutrition Examination Survey, odor identification ability was reduced in Black, Asian, and Mexican-American participants compared to White participants (Hoffman et al., 2016). Interestingly, at least one study found that group differences between Black and White older adults were no longer apparent when using olfactory measures that were less influenced by cognitive factors, such as measures of odor detection threshold (Xu et al., 2020). However, over a 5-year period, Pinto et al., (2015) found that Black participants demonstrated greater olfactory decline when compared to White participants, even with adjustment for other demographic factors, cognitive functioning, and physical/psychological conditions. Race has been widely noted to be a poor surrogate of social and structural determinants of health (SSDoH), which span factors such as economic stability, neighborhood and physical environment, access and quality of health care, quality of education, food security, and level of community engagement. Poor diet, stress, poverty, racism, educational segregation, and under-resourced schooling and housing, for example, are SSDoH factors that can contribute to health disparities observed by race. SSDoH such as pollution, diet quality, educational access, social support, and socioeconomic status can all influence olfactory abilities. For example, Hedner et al., (2010) found that educational attainment was a unique predictor of decline in odor identification ability. This relationship may be due, in part, to the semantic component of the task, in which individuals are required to attach a verbal label to a presented odor from four choices. Linguistic development and odor familiarity progress with age and education quality which can influence odor identification performance. Prior work has also noted associations between olfactory dysfunction and both cumulative pollutant exposure and lower socioeconomic status (for a review, see: Papazian & Pinto, 2021). Moreover, cultural differences in odor exposure, familiarity, and awareness are also reported; factors which may have contributed to differences across demographic groups on the individual item performance in this study. SSDoH are often difficult to standardize and measure in clinical settings and may not individually capture the differences captured by race. Therefore, additional work is needed to disentangle the relationship between race and olfactory dysfunction in older adults and how best to assess and incorporate SSDoH into olfactory norms and the clinical assessment of olfaction.
Limitations of the current work include the single test of olfactory functioning and the restricted age range of our population to older adults between 66 and 89 years of age; the regression-based normative data provided in this paper are not generalizable to individuals outside of this age range. Our normative population included English-speaking Black and White participants and results may not generalize to other race/ethnicities. Furthermore, Black participants were mainly recruited at two ARIC field centers resulting in race-site aliasing. As such, we were not able to separate out the impact of race from study location. We excluded individuals with a history of chronic rhinosinusitis, nasal polyps, prior sinus surgery, or prior significant head trauma, increasing the robustness of our population to peripheral olfactory deficits. However, participants did not undergo a formal ENT evaluation to rule out peripheral causes to olfactory loss. Finally, the influence of medication use on SSOIT-12 is a limitation of the current work. Prior reviews note the complexities and few studies have systematically examined what medications influence quantitative olfactory assessment, and a clear pattern has not emerged (Lotsch et al., 2015; Schiffman, 2018).
Conclusions
Healthy older adults show high rates of discordance between self-report and quantitative assessment of olfactory functioning, and unawareness of olfactory loss can worsen with aging and medical co-morbidities (Adams et al., 2017; Schneider et al., 2022; White & Kurtz, 2003). Unawareness of olfactory loss can make it difficult to seek medical evaluation, delaying treatment and leading to adverse outcomes (e.g., eating spoiled food, inability to detect dangerous chemicals in one’s environment). To date, quantitative olfactory assessment has demonstrated utility for the evaluation of a range of neurologic, psychiatric, and sinonasal conditions. In older adults, olfactory dysfunction is a risk factor for frailty and faster rates of physical decline (Nagururu et al., 2023; Yuan et al., 2022). The results of this study provide normative data for odor identification performance on the SSOIT-12 obtained from a large population of U.S. Black and White adults aged 66–89 years without preclinical or clinical dementia or sinonasal disease. These psychophysical olfactory norms can improve a clinician’s ability to assess the degree of loss, aid in differential diagnosis, establish concordance with a person’s perception of olfactory difficulties, and quantitatively monitor changes in olfactory performance over time.
Funding
This work was supported in whole or in part with Federal funds from the National Heart, Lung, and Blood Institute, National Institutes of Health, Department of Health and Human Services (contract numbers: HHSN268201700001I; HHSN268201700002I; HHSN268201700003I; HHSN268201700004I; HHSN268201700005I) for the Atherosclerosis Risk in Communities study. The neurocognitive data are supported by grants numbers U01 2U01HL096812, 2U01HL096814, 2U01HL096899, 2U01HL096902, and 2U01HL096917 from the National Institutes of Health (National Heart, Lung, and Blood Institute, National Institute of Neurological Disorders and Stroke, National Institute on Aging and National Institute on Deafness and Other Communication Disorders), and with previous brain MRI examinations funded by grant number R01HL70825 from the National Heart, Lung, and Blood Institute. VK has received support from NIA (grant number R01AG064093) and the NINDS (grant number R01NS108452). HC is supported NIA (grant number R01AG071517) and NIEHS (grant number R01ES029227). ALCS is supported by NINDS (grant number K23NS123340). JAD is supported by NIA grant K01AG054693. The views and opinions expressed in this article are those of the authors and should not be construed to represent the views of the sponsoring organizations, agencies, or U.S. Government.
Conflict of Interest
Multiple authors receive research support from the NIH. Dr. Schneider receives research support from the Department of Defense and is an Associate Editor at the journal Neurology. Dr. Deal reports honoraria from Frontiers in Epidemiology, Velux Stiftung and Medical Education Speakers Network. The remaining authors have no other conflicts of interest to disclose.
Acknowledgements
The authors thank the staff and participants of the ARIC study for their important contributions.
Authors’ contributions
Vidyulata Kamath (Conceptualization, Methodology, Writing—original draft, Writing—review & editing), Honglei Chen (Conceptualization, Funding acquisition, Investigation, Project administration, Resources, Validation, Writing—review & editing), Srishti Shrestha (Conceptualization, Writing—review & editing), Dawn Mechanic-Hamilton (Conceptualization, Methodology, Writing—review & editing), Jennifer A. Deal (Methodology, Writing—review & editing), Thomas H. Mosley (Conceptualization, Funding acquisition, Investigation, Project administration, Resources, Supervision, Writing—review & editing), and Andrea L.C. Schneider (Conceptualization, Formal analysis, Methodology, Visualization, Writing—original draft, Writing—review & editing)
