






Abstract
The Automated Neuropsychological Assessment Metrics (Version 4) Traumatic Brain Injury Military (ANAM4 TBI-MIL) is commonly administered among U.S. service members both pre-deployment and following TBI. The current study used the ANAM4 TBI-MIL to develop a cognition summary score for TBI research and clinical trials, comparing eight composite scores based on their distributions and sensitivity/specificity when differentiating between service members with and without mild TBI (MTBI).
Male service members with MTBI (n = 56; Mdn = 11 days-since-injury) or no self-reported TBI history (n = 733) completed eight ANAM4 TBI-MIL tests. Their throughput scores (correct responses/minute) were used to calculate eight composite scores: the overall test battery mean (OTBM); global deficit score (GDS); neuropsychological deficit score-weighted (NDS-W); low score composite (LSC); number of scores <50th, ≤16th percentile, or ≤5th percentile; and the ANAM Composite Score (ACS).
The OTBM and ACS were normally distributed. Other composites had skewed, zero-inflated distributions (62.9% had GDS = 0). All composites differed significantly between participants with and without MTBI (p < .001), with deficit scores showing the largest effect sizes (d = 1.32–1.47). The Area Under the Curve (AUC) was lowest for number of scores ≤5th percentile (AUC = 0.653) and highest for the LSC, OTBM, ACS, and NDS-W (AUC = 0.709–0.713).
The ANAM4 TBI-MIL has no well-validated composite score. The current study examined multiple candidate composite scores, finding that deficit scores showed larger group differences than the OTBM, but similar AUC values. The deficit scores were highly correlated. Future studies are needed to determine whether these scores show less redundancy among participants with more severe TBIs.
Introduction
The Automated Neuropsychological Assessment Metrics (Version 4) Traumatic Brain Injury Military (ANAM4 TBI-MIL) is a widely used computerized cognitive test battery in the United States military (Center for the Study of Human Operator Performance, 2007). It was selected as the primary battery for pre-deployment cognitive testing by the US Department of Defense and it has been used more than 1.8 million times (Hinds, 2015). The ANAM4 TBI-MIL is recommended as a supplemental test for the National Institute of Neurologic Disorders and Stroke’s Common Data Elements for TBI research (National Institute of Neurological Disorders and Stroke, 2012). It has been used in several studies of mild traumatic brain injury (MTBI) in active duty service members (Coldren, Russell, Parish, Dretsch, & Kelly, 2012; Dretsch, Kelly, Coldren, Parish, & Russell, 2015; Kelly, Coldren, Parish, Dretsch, & Russell, 2012; Proctor et al., 2015). Advanced psychometric methods for interpreting low scores and reliable change on the battery have been developed (Haran et al., 2016; Ivins et al., 2015; Vincent et al., 2012). The ANAM4 TBI-MIL is comprised of seven individual cognitive tests and it yields three scores (reaction time, accuracy, and “throughput”) for each test. Although a method for calculating a whole battery composite score has been available to users of ANAM4 TBI-MIL (i.e., the ANAM Composite Score [ACS]), this composite has not been provided in the automated scoring program and has not been well validated. A single composite cognition score for ANAM4 TBI-MIL would be valuable as a correlate in neuroimaging research, a primary endpoint in clinical trials and prognostic studies, and in studies needing to reduce the number of variables that are analyzed.
For any cognitive test battery, a straightforward method for creating a single composite score is to convert individual test scores to a common metric (e.g., norm-referenced z, T, or standard score) and average them, producing an overall test battery mean (OTBM) (Miller & Rohling, 2001). The OTBM discriminates between levels of TBI severity (Rohling, Meyers, & Millis, 2003), and it has been used in TBI clinical trials (Boussi-Gross et al., 2013). A potential limitation of the OTBM is that mild specific impairments could be “washed out” by average and above average performances in other areas (Babikian, McArthur, & Asarnow, 2013). As an alternative to composite scores such as the OTBM that measure the full spectrum of cognitive performance, impairment-focused composite scores could be a simple calculation of the number of low scores at or below a set criterion [e.g., one standard deviation (SD) below the mean or below the 5th percentile]. Using this multivariate base rate approach, people with TBIs obtain a significantly greater number of low test scores than healthy control subjects (Iverson, Holdnack, & Lange, 2013). A limitation of this approach is that a single cutoff for defining a low score must be chosen (e.g., 1 SD or the 5th percentile). For example, individuals with multiple very mild deficits (i.e., <16th percentile) might not be detected if the cutoff for a low score is set too low (i.e., <5th percentile). The difficulty in selecting a single cutoff for a low score results, in part, from the relationship between objective performances and premorbid characteristics. A score below the 25th percentile may be considered low for individuals with high intellectual functioning, whereas a more stringent low score cutoff (e.g., ≤5th percentile) may be preferable for individuals with preexisting neurodevelopmental conditions. A potential solution to this problem is a composite score that aggregates information about the breadth and depth of low scores across a battery of tests.
Building on the legacy of earlier neuropsychological deficit scales (Reitan & Wolfson, 1985, 1993, Russell, 1984, 2011; Russell, Neuringer, & Goldstein, 1970), the Global Deficit Scale (GDS) (Carey et al., 2004) assigns increasing weight to individual test scores that are more discrepant from the normative mean and then sums these weights. The GDS has been widely used in HIV research (Carey et al., 2004; Cysique et al., 2015; Decloedt et al., 2016; Robertson et al., 2016), and to a lesser extent, in other conditions such as schizophrenia (Reichenberg et al., 2009), chemotherapy effects (Vardy, Rourke, & Tannock, 2007), sleep apnea (Haensel et al., 2009), hepatitis C (Bieliauskas et al., 2006), substance abuse (Cattie et al., 2012), and stroke (Stricker, Tybur, Sadek, & Haaland, 2010). It has been validated against clinician ratings and various disease biomarkers in clinical samples (Bieliauskas et al., 2006; Carey et al., 2004; Haensel et al., 2009).
The purpose of this study is to compare and contrast eight candidate composite scores for the ANAM4 TBI-MIL in healthy control subjects and active duty service members who sustained a recent MTBI, including previously established composite scores (i.e., the OTBM, GDS, and ACS) and novel composite scores that build from these previous methods. The four aims of this study were as follows: (a) examine the distributional characteristics of composite scores to evaluate how zero-inflation (i.e., an excess number of scores of zero in a distribution) might influence normality, within-group variability, and between-group variability in scores; (b) explore the associations between different composite scores to identify those that might be redundant from those that provide unique information; (c) compare healthy control subjects to those with MTBIs and identify those composites that show the largest effect sizes between groups; and (d) determine the extent to which the composite scores are associated with post-concussion symptom reporting. Given the heterogeneity in the location, nature, severity, and consequences of neuropathology in MTBI (Bigler et al., 2013; Rosenbaum & Lipton, 2012), we hypothesized that the OTBM might have weaker diagnostic validity than the other composites.
Methods
Participants
Data from 733 healthy U.S. Army service members with no self-reported lifetime history of TBI (controls) and 56 service members clinically evaluated for MTBI were used in these analyses. All service members in both groups were men, and all had valid ANAM4 TBI-MIL data per embedded effort measures (Cognitive Science Research Center, 2011). All procedures were approved by the IRB and service members who agreed to participate provided written informed consent. Testing was completed at the Defense and Veterans Brain Injury Center at Fort Bragg, North Carolina. Healthy service members were tested in a group setting with up to 25 service members tested at one time and proctors available to assist them if they had questions about or problems with ANAM4 TBI-MIL. An initial sample of 1,825 service members was considered for the control group in this study. A large number were excluded for the following reasons: past history of TBI (n = 619; 33.9%), unknown history of TBI (n = 71; 3.9%), women (n = 146; 8.0%), missing pay grade information (n = 1; 0.1%), fewer than 12 years of education (n = 4; 0.2%), could not assess effort on ANAM4 TBI-MIL (n = 46; 2.5%), poor overall effort on ANAM4 TBI-MIL (n = 53; 2.9%), or <56% correct on one or more ANAM4 TBI-MIL tests (n = 152; 8.3%), as recommended by ANAM4’s developers (Cognitive Science Research Center, 2011). After applying these exclusions, 733 healthy men with valid ANAM4 TBI-MIL performance remained in the control sample. The average age of the control sample was 28.2 years (SD = 6.8). Their average number of years on active duty was 5.4 (SD = 5.1). Their military rank was as follows: junior enlisted (58.8%), non-commissioned officers (32.5%), senior non-commissioned officers (4.8%), and warrant/commissioned officers (4.0%). The racial breakdown of the sample was 64.8% white, 16.4% African American, 13.2% Hispanic, and 5.6% other. The education of the sample was as follows: high school graduate or general equivalency diploma (56.8%), some college (30.8%), and college graduate (12.4%).
At Fort Bragg, service members recruited because of a suspected TBI were tested individually with a proctor present. The injury characteristics of the service members clinically evaluated for a suspected TBI were obtained from a computerized self-report questionnaire that asked when the injury happened, if they were dazed or confused, if they experienced any loss of consciousness (LOC), and if they could remember the injury event. Service members with one or more of the following were included in the MTBI group: (a) LOC lasting 20 min or less, (b) being dazed or confused after the injury, and/or (c) having amnesia for less than 24 hr. An initial sample of 177 service members was considered for the MTBI group. A large number were excluded for the following reasons: no TBI or could not determine if TBI occurred = 9 (5.1%), unable to classify severity of TBI = 37 (20.9%), TBI was greater in severity than mild = 11 (6.2%), women = 11 (6.2%), completed fewer than 7 ANAM4 TBI-MIL tests = 17 (9.6%), could not assess effort on ANAM4 TBI-MIL due to missing scores = 8 (4.5%), poor overall effort on ANAM4 TBI-MIL = 14 (7.9%), or <56% correct on one or more ANAM4 TBI-MIL tests = 14 (7.9%). After applying these exclusions, 56 men with valid ANAM4 TBI-MIL performance remained in the MTBI sample. The average age of the MTBI sample was 26.9 years (SD = 6.5). Their average number of years on active duty was 6.0 (SD = 6.0). Their military rank was as follows: junior enlisted = 55.4%, non-commissioned officers = 23.2%, senior non-commissioned officers = 10.7%, and warrant/commissioned officers = 10.7%. The racial breakdown of the sample was 78.6% white, 1.8% African American, 10.7% Hispanic, and 8.9% other. The education of the sample was as follows: high school graduate or general equivalency diploma (37.5%), some college (48.2%), and college graduate (14.3%). Only 12.5% of MTBIs were combat-related, all of which were blast injuries. Mechanism of injury included parachuting (53.6%), motor vehicle accident (8.9%), fall (7.1%), blunt object (14.3%), sports or fitness activities (1.8%), blast (12.5%), or other mechanisms (1.8%). Parachuting injuries occurred in training jumps, conducted within the continental United States. Nearly all injuries in parachuting occur when landing, and it can be considered a type of fall. The median number of days since injury was 11 (M = 23.3; SD = 36.1, IQR = 5–30.8, Range = 0–245). The MTBI group was more likely to consist of senior non-commissioned officers and officers (p = .015) and more likely to have some college education (p = .014). There were no significant differences on other demographic or military characteristics. Although a modest proportion of the control (8.0%) and MTBI groups (6.2%) were women, these participants were excluded because, after exclusion based on other criteria (e.g., missing data, poor effort, unknown TBI severity), an extremely small sample of women with MTBIs were eligible for inclusion, thus limiting the generalizability of this subgroup, as well as the ability to draw meaningful comparisons between groups.
Measures
ANAM4 TBI-MIL is composed of seven cognitive tests. Simple Reaction Time (SRT) provides an index of attention and visuo-motor response time by having the user respond as fast as possible to a snowflake symbol that appears on the monitor. Code Substitution-Learning (CDS) provides an index of complex scanning, visual tracking, and attention by requiring the user to compare a digit-symbol pair to a predefined set of digit symbol pairs that appear on the monitor. Procedural Reaction Time (PRO) measures reaction time and processing efficiency by presenting the user with a number on the monitor. The user then has to indicate whether the number is low (2 or 3) or high (4 or 5) by pressing the left or right mouse button, respectively. Mathematical Processing (MTH) provides an index of basic computational skills, concentration, and working memory by asking the user to solve a simple arithmetic problem and indicate whether the answer is less than or greater than five. Matching to Sample (MSP) provides an index of spatial processing and visuo-spatial working memory by requiring the user to first view a pattern in a 4 × 4 sample grid and then determine which of two additional grids that appear matches the sample grid. Code Substitution-Delayed (CDD) provides a measure of learning and delayed visual recognition memory by requiring the user to determine whether a digit-symbol pair matches those presented during the Code Substitution-Learning test presented earlier in the battery. Simple Reaction Time (Repeated) (SR2) is identical to the Simple Reaction Time test administered earlier in the battery and is designed to assess fatigue.
The main scores generated for each test are mean reaction time, percent correct, and throughput, which is a composite of reaction time and accuracy reflecting the number of correct responses per minute of test time. Throughput is the score most often used in clinical assessments and research because it is believed to best reflect the cognitive processes ANAM evaluates (Short, Cernich, Wilken, & Kane, 2007) and so was the score used in our analyses. ANAM4 TBI-MIL raw scores were converted to z-scores using available normative data from a large sample of U.S. military service members (Cognitive Science Research Center, 2009; Vincent et al., 2012), and then converted to T scores for use with some of the composite scores (M = 50, SD = 10).
The Neurobehavioral Symptom Inventory (NSI) is a checklist that asks patients to rate the severity of 22 symptoms often associated with TBI that they have experienced in the previous two weeks (Cicerone & Kalmar, 1995). Each symptom is rated using a five-point scale from 0 to 4, with 0 indicating no symptom and 4 indicating a very severe symptom. Numerous studies have found that NSI symptoms generally cluster into four domains: physical/sensory, cognitive, affective, and vestibular (Vanderploeg et al., 2015). The NSI is widely used by clinicians in the U.S. military health system and the Veterans Affairs health care system and is included in the National Institute of Neurologic Disorders and Stroke’s Common Data Elements for TBI (National Institute of Neurological Disorders and Stroke, 2012). Previous researchers have reported high internal consistency for the 22 item total score (α ≥ .90) among national guard service members and veterans (King et al., 2012; Soble et al., 2014).
Composite Scores
Eight different composite scores were examined in this manuscript. These composite scores are described below.
The Overall Test Battery Mean (OTBM) was calculated by averaging T scores for all ANAM4 TBI-MIL tests (Miller & Rohling, 2001; Rohling et al., 2003). Lower scores indicate worse performance.
The Global Deficit Score (GDS) (Carey et al., 2004; Kendler, Gruenberg, & Kinney, 1994) was calculated by assigning the following weights to T scores (calculated as M = 50, SD = 10) from each ANAM4 TBI-MIL: 39–35 = 1, 34–30 = 2, 29–25 = 3, 24–20 = 4, and ≤19 = 5 (Note: T scores of 40 and above are assigned a weight of 0). The average weight was then calculated for the entire battery. Higher scores indicate greater deficits and worse performance.
The Neuropsychological Deficit Score-Weighted (NDS-W) is a new composite that assigns the following weights to T scores: 49–47 = 0.25, 46–44 = 0.5, 43–41 = 1, 40–37 = 1.5, 36–35 = 2, 34–31 = 3, 30–28 = 4, 27–24 = 5, 23–21 = 6, and ≤20 = 7 (Note: scores of 50 or above are assigned a weight of 0). Higher scores indicate greater deficits and worse performance. This new deficit score was inspired in part by the GDS described above but provides an increase in gradations to lower the floor effect of the GDS.
The Low Score Composite (LSC) is a new composite. T scores of 50 or higher are assigned a weight of 50, and T scores below 50 are assigned a weight identical to the T score (i.e., a T score of 35 would correspond to a weight of 35). The weights are averaged to produce a score reflecting overall battery performance. Lower scores indicate greater deficits and worse performance. This new composite score was inspired in part by the GDS as well, but provides an even greater range of scores than the NDS by using T scores in its calculation, rather than assigning deficit scores to ranges of possible T scores.
The number of scores at or below the 5th percentile (#≤5th %tile) is calculated by assigning the value 1 to any score at or below the 5th percentile and a zero to any score above the 5th percentile and summing those values. Higher scores indicate greater deficits and worse performance. This score has been used in previous research calculating multivariate base rates for a variety of neuropsychological test batteries (Brooks, Holdnack, & Iverson, 2011; Brooks, Iverson, & Holdnack, 2013; Brooks, Iverson, & White, 2009b; Brooks, Iverson, Holdnack, & Feldman, 2008; Holdnack et al., 2017; Ivins et al., 2015; Karr, Garcia-Barrera, Holdnack, & Iverson, 2017, 2018).
The number of scores at or below the 16th percentile (#≤16th %tile) is calculated by assigning the value 1 to any score at or below the 16th percentile and a zero to any score above the 16th percentile and summing those values. Higher scores indicate greater deficits and worse performance. As with the #≤5th %tile, this score has been calculated in previous multivariate base rate research (Brooks et al., 2011, 2013, 2008, 2009b; Holdnack et al., 2017; Karr et al., 2017, 2018).
The number of scores below the 50th percentile (#<50th %tile) is a new composite score. It is calculated by assigning the value 1 to any score below the 50th percentile and a zero to any score at or above the 50th percentile and summing those values. Higher scores indicate greater deficits and worse performance. Although this score has not been calculated in previous multivariate base rate research, it was inspired by this line of research, providing a higher cutoff when quantifying the number of low performances.
The ANAM Composite Score (ACS) is calculated by first converting raw ANAM4 TBI-MIL scores into standard scores (M = 100, SD = 15) and then summing the standard scores. A z-score is then calculated by subtracting from this sum the mean summed standard score from a military normative sample (i.e., M = 700.98), and dividing the difference by the standard deviation of the normative mean [i.e., SD = 67.48; (Cognitive Science Research Center, 2012)]. Lower scores indicate worse performance. This score is mathematically similar to the OTBM.
Statistical Analyses
Spearman’s rho was used to examine the intercorrelations between the composites as well as between the composites and throughput scores from each ANAM4 TBI-MIL test. Unequal variance t-tests (sometimes known as Welch’s t-test or the Welch/Satterwaite test) that are robust to unequal variances and sample sizes were used to compare the mean composite, individual ANAM4 TBI-MIL tests, and NSI scores from the control and MTBI groups. Cohen’s d was used to determine the effect sizes of mean differences. We also performed unequal variance t-tests on ranked composites and ANAM4 TBI-MIL scores to determine if the statistical significance of the original t-tests was affected by non-normal distributions. This method is similar to a non-parametric Mann–Whitney U test, but accounts for unequal variances. Receiver operating characteristic (ROC) analyses were used to determine how well each composite and individual ANAM4 TBI-MIL score distinguished the MTBI cases from controls.
Results
Descriptive statistics and distributional characteristics of all composite scores are presented in Table 1. Histograms for the composite scores, stratified by group, are presented in Fig. 1. The OTBM and ACS are approximately normally distributed in the control group. The GDS, NDS-W, and the number of scores at or below the 5th and 16th percentiles, by design, are skewed to the right. The LSC, by design, is skewed left. The number of scores below the 50th percentile is skewed right in the control group but skewed left in the mTBI group. Values of the composites also differ because of the different numeric scales they are based on. The GDS, #≤5th %tile, and the #<16th %tile had pronounced ceiling effects with 62.9%, 81.2%, and 52.7%, respectively, of service members in the control group scoring 0. In contrast, only 13.6% of the service members in the control group scored 0 on NDS-W or scored 50 on the LSC.
Descriptive statistics and distributional characteristics of the composite scores
| Overall Test Battery Mean | Global Deficit Score | NDS-W | Low Score Composite | #≤5th %tile | #≤16th %ile | #<50th %ile | ANAM Composite Score | |
|---|---|---|---|---|---|---|---|---|
| Control N = 733 | ||||||||
| Percent Scoring Zero | NA | 62.9 | 13.6 | 13.6a | 81.2 | 52.7 | 13.6 | N/A |
| M, Md | 52.53, 52.57 | 0.15, 0.00 | 0.43, 0.29 | 46.93, 47.86 | 0.26, 0.00 | 0.87, 0.00 | 2.72, 3.00 | 0.38, 0.38 |
| SD | 6.78 | 0.31 | 0.53 | 3.30 | 0.63 | 1.22 | 1.93 | 1.06 |
| Inter-quartile Range | 8.43 | 0.14 | 0.60 | 3.86 | 0.00 | 1.00 | 3.00 | 1.32 |
| Range (Min-Max) | 28.57–72.29 | 0.00–2.57 | 0.00–4.14 | 28.57–50.00 | 0.00–5.00 | 0.00–7.00 | 0.00–7.00 | −3.35–3.47 |
| Skewness, Kurtosis | −0.20, 0.44 | 3.78, 19.03 | 2.63, 9.98 | −2.00, 5.74 | 3.26, 13.29 | 1.81, 3.80 | 0.38, −0.73 | −0.22, 0.48 |
| Cutoff scores | ||||||||
| 98th Percentile | 68.80 | 0.00 | 0.00 | 50.00 | 0.00 | 0.00 | 0.00 | 2.47 |
| 95th Percentile | 63.57 | 0.00 | 0.00 | 50.00 | 0.00 | 0.00 | 0.00 | 2.07 |
| 93rd Percentile | 62.29 | 0.00 | 0.00 | 50.00 | 0.00 | 0.00 | 0.00 | 1.90 |
| 91st Percentile | 61.71 | 0.00 | 0.00 | 50.00 | 0.00 | 0.00 | 0.00 | 1.80 |
| 84th Percentile | 59.37 | 0.00 | 0.36 | 49.86 | 0.00 | 0.00 | 1.00 | 1.44 |
| 75th Percentile | 56.71 | 0.00 | 0.07 | 49.43 | 0.00 | 0.00 | 1.00 | 1.04 |
| 25th Percentile | 48.29 | 0.14 | 0.61 | 45.57 | 0.00 | 1.00 | 4.00 | −0.28 |
| 16th Percentile | 46.00 | 0.29 | 0.79 | 44.21 | 1.00 | 2.00 | 5.00 | −0.64 |
| 9th Percentile | 43.86 | 0.43 | 1.07 | 42.58 | 1.00 | 3.00 | 6.00 | −0.96 |
| 7th Percentile | 42.77 | 0.57 | 1.20 | 42.14 | 1.00 | 3.00 | 6.00 | −1.13 |
| 5th Percentile | 41.43 | 0.71 | 1.50 | 40.49 | 1.00 | 3.00 | 6.00 | −1.34 |
| 2nd Percentile | 37.86 | 1.14 | 2.12 | 37.57 | 2.00 | 5.00 | 7.00 | −1.93 |
| MTBI N = 56 | ||||||||
| Percent Scoring Zero | NA | 37.5 | 7.1 | 7.1a | 55.4 | 26.8 | N/A | |
| M, Md | 44.67, 46.93 | 0.70, 0.14 | 1.37, 0.70 | 41.33, 44.71 | 1.29, 0.00 | 2.39, 1.50 | 4.34, 5.00 | −0.85, −0.50 |
| SD | 11.38 | 0.92 | 1.42 | 8.23 | 1.81 | 2.29 | 2.28 | 1.79 |
| Inter-quartile Range | 16.14 | 1.39 | 2.14 | 12.36 | 2.00 | 4.00 | 3.00 | 2.49 |
| Range (Min-Max) | 21.14–72.79 | 0.00–3.00 | 0.00–4.86 | 21.14–50.00 | 0.00–6.00 | 0.00–7.00 | 0.00–7.00 | −4.89–3.45 |
| Skewness, Kurtosis | −0.17, −0.47 | 1.12, −0.12 | 0.32, −0.25 | −0.90, −0.41 | 1.23, 0.27 | 0.32, −0.97 | −0.43, −1.06 | −0.21, −0.39 |
| Cutoff scores | ||||||||
| 98th Percentile | 71.09 | 0.00 | 0.00 | 50.00 | 0.00 | 0.00 | 0.00 | 3.27 |
| 95th Percentile | 62.01 | 0.00 | 0.00 | 50.00 | 0.00 | 0.00 | 0.00 | 1.88 |
| 93rd Percentile | 60.44 | 0.00 | 0.00 | 50.00 | 0.00 | 0.00 | 0.00 | 1.59 |
| 91st Percentile | 58.95 | 0.00 | 0.04 | 49.70 | 0.00 | 0.00 | 1.00 | 1.38 |
| 84th Percentile | 55.13 | 0.00 | 0.14 | 48.57 | 0.00 | 0.00 | 2.00 | 0.79 |
| 75th Percentile | 53.00 | 0.00 | 0.29 | 47.68 | 0.00 | 0.00 | 3.00 | 0.43 |
| 25th Percentile | 36.86 | 1.39 | 2.43 | 35.32 | 2.00 | 4.00 | 6.00 | −2.06 |
| 16th Percentile | 30.35 | 1.86 | 3.21 | 30.32 | 4.00 | 5.00 | 7.00 | −3.07 |
| 9th Percentile | 28.66 | 2.29 | 3.86 | 28.66 | 4.00 | 6.00 | 7.00 | −3.34 |
| 7th Percentile | 25.84 | 2.57 | 3.93 | 25.84 | 5.00 | 6.01 | 7.00 | −3.74 |
| 5th Percentile | 23.79 | 2.61 | 4.35 | 23.79 | 5.15 | 7.00 | 7.00 | −4.09 |
| 2nd Percentile | 21.46 | 2.98 | 4.84 | 21.46 | 6.00 | 7.00 | 7.00 | −4.79 |
Note: ANAM = Automated Neuropsychological Assessment Metrics; MTBI = Mild Traumatic Brain Injury; NDS-W = Neuropsychological Deficit Score-Weighted.
aPercent scoring 50.
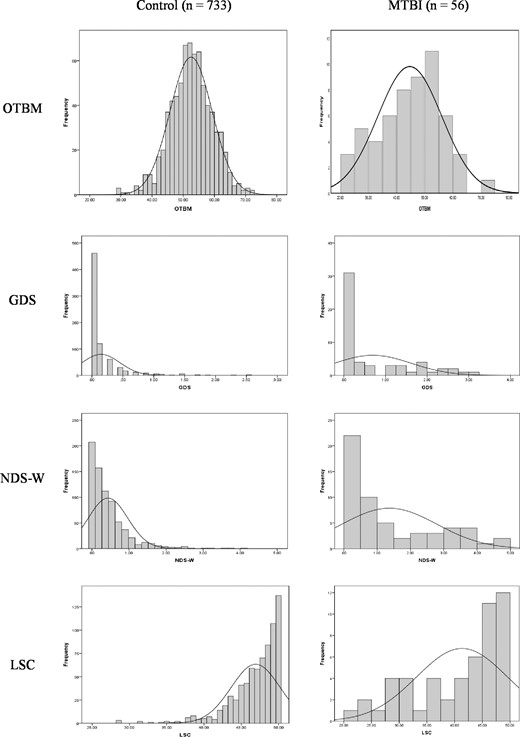
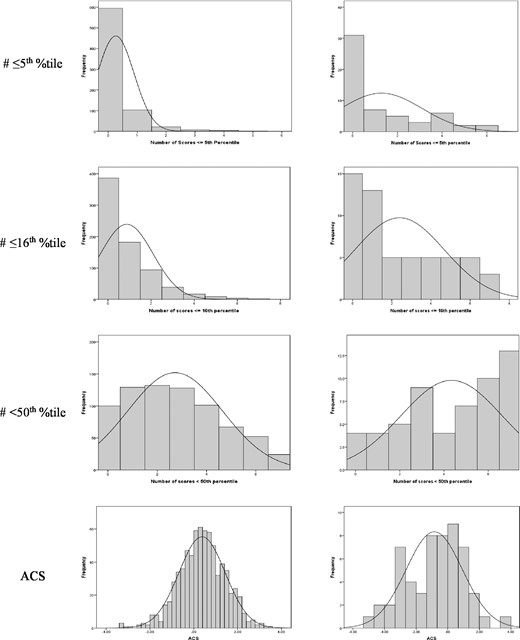
Histograms of ANAM4 TBI-MIL composite scores by group. ACS = Automated Neuropsychological Assessment Metrics (ANAM) Composite Score; GDS = Global Deficit Score; LSC = Low Score Composite; MTBI = Mild Traumatic Brain Injury; NDS-W = Neuropsychological Deficit Score-Weighted; OTBM = Overall Test Battery Mean.
Table 2 shows intercorrelations between the composites in the control group and the MTBI group. Generally, the correlations between the composites in both groups were very high (i.e., > 0.8). The weakest correlations were in the control group between the #≤5th %tile and #<16th %tile and the other five composites. This reflects, at least in part, the limited range of possible values for the #≤5th %tile and to a lesser extent the #<16th %tile. The correlations between these two composites and the other five composites were higher in the MTBI group because those service members in the MTBI group were more likely than service members in the control group to have low ANAM4 TBI-MIL scores. The correlations between self-reported neurobehavioral symptoms (NSI total score) and the composite scores were trivial to small in the control group. The correlations between the composites and the NSI cognitive score were also trivial to small in the control group. The correlations between the symptom total score and the composite scores were all statistically significant and medium in size in the MTBI group. The correlations between cognitive symptoms and the composite scores were all statistically significant and small to medium in size in the MTBI group.
Spearman intercorrelations between the composite scores and between the composites and NSI scores
| Group | OTBM | GDS | NDS-W | LSC | #≤5th %tile | #≤16th %tile | #<50th %ile | ACS |
|---|---|---|---|---|---|---|---|---|
| Control n = 733 | ||||||||
| GDS | −0.694** | |||||||
| NDS-W | −0.906** | 0.790** | ||||||
| LSC | 0.915** | −0.779** | −0.994** | |||||
| #≤5th %tile | −0.535** | 0.689** | 0.624** | −0.594** | ||||
| #≤16th %tile | −0.772** | 0.831** | −0.875** | −0.875** | 0.598** | |||
| #<50th %ile | −0.912** | 0.635** | 0.904** | −0.920** | 0.459** | 0.725** | ||
| ACS | 1.000** | −0.693** | −0.905** | 0.914** | −0.535** | −0.771** | −0.913** | |
| NSI-Cognition | −0.136** | 0.026 | 0.114** | −0.122** | 0.046 | 0.111** | 0.124** | −0.136** |
| NSI Total Score | −0.106** | 0.066 | 0.077* | 0.022 | 0.022 | 0.063 | 0.095** | −0.107** |
| MTBI n = 56 | ||||||||
| GDS | −0.938** | |||||||
| NDS-W | −0.949** | 0.935** | ||||||
| LSC | 0.957** | −0.931** | −0.995** | |||||
| #≤5th %tile | −0.836** | 0.873** | 0.857** | −0.840** | ||||
| #≤16th %tile | −0.900** | 0.917** | 0.958** | −0.952** | 0.850** | |||
| #<50th %ile | −0.914** | 0.838** | 0.912** | −0.927** | 0.712** | 0.858** | ||
| ACS | 0.999** | −0.938** | −0.948** | 0.957** | −0.833** | −0.898** | −0.917** | |
| NSI-Cognition | −0.331* | 0.293* | 0.263 | −0.261 | 0.389** | 0.295* | 0.170 | −0.329** |
| NSI Total Score | −0.476* | 0.411** | 0.431* | −0.431** | 0.497** | 0.417** | 0.333* | −0.475** |
Note: *p < .05; **p < .01. ACS = Automated Neuropsychological Assessment Metrics (ANAM) Composite Score; GDS = Global Deficit Score; LSC = Low Score Composite; MTBI = Mild Traumatic Brain Injury; NDS-W = Neuropsychological Deficit Score-Weighted; NSI = Neurobehavioral Symptom Inventory; OTBM = Overall Test Battery Mean.
Mean composite scores, the seven primary ANAM subtest scores, and the NSI total and cognitive scores for the control and MTBI groups are presented in Table 3. Mean group differences (using Cohen’s d effect size) between participants with versus without MTBI ranged from medium to large, with the exception of one subtest that had a d value that was very small (i.e., Mathematical Processing). On the composite scores, the MTBI group performed considerably worse on ANAM4 TBI-MIL than the control group. Effect sizes were generally larger for composite scores than for individual test scores (with the exception of Simple Reaction Time). For the composite scores, the mean differences were all large as indicated by Cohen’s d values greater than 0.80. Composites that emphasize or assign more weight to low scores, such as the GDS, NDS-W, LSC, and the #≤5th %tile, had larger effect sizes than composites that average all of the test scores (OTBM and ACS). The MTBI group also had significantly higher total and cognitive symptom scores than controls with large effect sizes. The group comparisons reported in Table 3 were re-run using unequal variance t-tests applied to ranked composite. This method is robust to differences in variances and sample sizes between groups and non-normal distributions (Ruxton, 2006). The findings were consistent with the original results despite one exception: Mathematical Processing was significantly different across groups (p = .025), although the magnitude of the difference was very small (d = 0.06).
Group comparisons of composite and subtest scores.
| Composites/Subtests/Symptoms | Control | MTBI | p | Cohen’s d | AUC |
|---|---|---|---|---|---|
| Composites | |||||
| OTBM: M (SD) | 52.53 (6.78) | 44.67 (11.38) | <.001 | 1.09 | 0.712** |
| GDS: M (SD) | 0.15 (0.31) | 0.70 (0.92) | <.001 | 1.43 | 0.675** |
| NDS-W: M (SD) | 0.43 (0.53) | 1.37 (1.42) | <.001 | 1.47 | 0.709** |
| LSC: M (SD) | 46.93 (3.30) | 41.33 (8.23) | <.001 | 1.45 | 0.713** |
| #≤5th %tile: M (SD) | 0.26 (0.64) | 1.29 (1.81) | <.001 | 1.32 | 0.653** |
| #≤16th %tile: M (SD) | 0.94 (1.25) | 2.52 (2.31) | <.001 | 1.17 | 0.708** |
| #<50th %ile | 2.72 (1.93) | 4.34 (2.28) | <.001 | 0.83 | 0.704** |
| ACS: M (SD) | 0.38 (1.06) | −0.85 (1.79) | <.001 | 1.09 | 0.711** |
| Subtests | |||||
| Simple Reaction Time | 249.67 (34.89) | 212.57 (57.04) | <.001 | 1.00 | 0.700** |
| Code Substitution-Learning | 54.69 (11.36) | 48.69 (12.64) | <.001 | 0.52 | 0.645** |
| Procedural Reaction Time | 105.00 (14.81) | 93.64 (20.40) | <.001 | 0.74 | 0.660** |
| Mathematical Processing | 22.20 (7.23) | 21.74 (15.82) | .829§ | 0.06 | 0.594* |
| Matching to Sample | 36.20 (11.17) | 30.21 (12.56) | <.001 | 0.53 | 0.672** |
| Code Substitution-Delayed | 45.16 (14.84) | 37.96 (15.28) | .001 | 0.48 | 0.633** |
| Simple Reaction Time (Repeated) | 250.51 (34.62) | 201.54 (64.47) | <.001 | 1.30 | 0.745** |
| Self-Reported Symptoms | |||||
| NSI-Cognition Subscale | 1.80 (2.49) | 5.38 (3.48) | <.001 | 1.40 | 0.815** |
| NSI Total Score | 8.32 (8.96) | 24.40 (13.06) | <.001 | 1.62 | 0.835** |
Note: *p < .05; **p < .01. §Unequal variance t-test of ranked score revealed a significant difference between groups (p = .025), but the magnitude of the difference is not practically or clinically meaningful. ACS = Automated Neuropsychological Assessment Metrics (ANAM) Composite Score; GDS = Global Deficit Score; LSC = Low Score Composite; MTBI = Mild Traumatic Brain Injury; NDS-W = Neuropsychological Deficit Score-Weighted; NSI = Neurobehavioral Symptom Inventory; OTBM = Overall Test Battery Mean.
The Cohen’s d effect sizes described above are somewhat biased by non-normal distributions, whereas the areas under the ROC curves (AUCs) do not have underlying normality assumptions. In general, those composite scores with the largest effect sizes achieved comparable or slightly lower classification accuracy (AUCs) in comparison to the OTBM. In other words, even though these composite scores had somewhat greater effect sizes, they did not identify a greater number of impaired individuals. They might have better captured the breadth and depth of cognitive deficits in impaired individuals, however. NSI symptom scores had somewhat better classification accuracy than either the composites or individual ANAM scores.
Discussion
The ANAM4 TBI-MIL is widely used in military research and in the clinical care of active duty service members and veterans. A major limitation of the ANAM4 TBI-MIL for these applications is the unavailability of a well-validated composite score, or summary measure, to capture performance on the battery as a whole. Composite scores are particularly important for clinical trials, which require specification of a single endpoint, as well as for observational studies that seek to manage the Type I error rate by limiting the number of statistical comparisons. Because many examinees obtain at least some low scores on a cognitive test battery, regardless of their health history (Binder, Iverson, & Brooks, 2009), deficit-based composite scores can also help clinicians integrate data from multiple tests and minimize diagnostic errors associated with over-interpreting one or more low scores (Brooks, Iverson, Feldman, & Holdnack, 2009a; Holdnack et al., 2017; Iverson, Brooks, Langenecker, & Young, 2011; Miller & Rohling, 2001).
There is no universally accepted method for deriving composite scores. The present study calculated several candidate composite scores for the ANAM4 TBI-MIL and contrasted their psychometric properties and diagnostic validity in a sample of active duty military personnel with and without a recent MTBI. It is important to appreciate that the OTBM and the ACS are identical—they are both mathematical averages of the subtest scores. This equivalency was not immediately apparent prior to conducting analyses for the current study; and considering the ACS has not been regularly used in previous ANAM research, both the ACS and OTBM were included in the tables for completeness for future researchers. Similarly, NDS-W and LSC were highly correlated and nearly redundant. Future research is needed to determine if they separate more in samples of people who have had severe TBIs and thus much greater cognitive impairment than was present in the current sample. In the MTBI group, the composite scores were significantly and generally moderately associated with subjectively-experienced cognitive deficits, as measured by the cognition subscale of the NSI. There were weak correlations between subjective cognitive symptoms and the composite scores in the control group. The composite scores were significantly associated with post-concussion symptoms in the MTBI group, and the strength of the association was medium. Most of the correlations revealed about 17%–25% overlapping variance between the cognition composite score and subjective symptom reporting (NSI total score).
In general, the OTBM and the ACS had distributional characteristics (Table 1 and Fig. 1) and effect sizes (Table 3) that might be considered favorable in research designs and clinical practice where detection of changes in cognitive functioning across the spectrum (e.g., moderately impaired to mildly impaired, average to high average) are desired. Although the OTBM and ACS are similar to traditional composite score methodologies (e.g., IQ and Index scores), they do not require co-norming of component subtests as the traditional composites do. Because it is simply a mathematical average of the scores, the OTBM is easily interpreted as an overall ability score with high scores representing above average ability and low scores indicating low ability. However, the OTBM might mask weaknesses/deficits within a cognitive profile given that lower scores are counteracted by scores above the 50th percentile, resulting in a smaller overall effect size between groups.
The GDS and “number of low scores” composites had marked ceiling effects, with more than half of control participants achieving the best possible score of zero. The NDS-W and LSC were calculated in an attempt to improve the GDS by raising the ceiling to potentially better detect impairment in people with mild problems and/or high premorbid intellectual ability. Unlike the OTBM, these scores reflect the distribution of deficit levels more exponentially rather than linearly, because the tail of the deficit-based score distribution decays exponentially. This property is evident from past studies of multivariate base rates (Binder et al., 2009; Brooks & Iverson, 2010; Brooks et al., 2011; Iverson, Brooks, & Young, 2009; Ivins et al., 2015). For example, in the GDS weighting system, obtaining two scores below one SD would be weighted by two points and obtaining two scores below two SDs would be weighted by six points (i.e., a GDS that is three times higher; see Table 1). However, the base rate of obtaining two scores below one SD for the ANAM4 TBI-MIL is 22% (Ivins et al., 2015), whereas the base rate of obtaining two scores below two SDs is 1.2% (i.e., a nearly 20-fold difference). Finally, we included the proportion of scores falling at or below a set cutoff (16th and 5th percentile), because these simple composite scores differentiated the same two groups of participants used in this study in a prior study (Ivins et al., 2015).
As noted above, the GDS and “number of low scores” composites were severely skewed (i.e., a large percentage of control subjects scored zero). These composites are less appropriate for measuring change across the spectrum of cognitive functioning, as may be of interest in some clinical trials. However, they performed comparably to the NDS and OTBM with respect to classification accuracy (AUCs; Table 3), suggesting that all of the candidate composites are similarly suited to identifying people in the MTBI group—at least in our sample. This is important for stratification or dichotomous endpoint analyses, and in clinical practice, where the goal is to identify people who have or do not have mild cognitive impairment. Despite being similarly able to distinguish between service members with and without MTBI (based on classification accuracy analyses), certain composites (GDS, NDS-W, and LSC) had greater mean group differences than others (e.g., OTBM, ACS, and number of scores <50th percentile), suggesting that they might more thoroughly capture the breadth and depth of impairment in cases with cognitive dysfunction.
When comparing the control and MTBI participant groups, the NSI-Cognition subscale had a larger AUC than any composite score, and the NSI-Total Score had a slightly larger AUC. This finding implies that service members with MTBI might be better differentiated from those without MTBI based on their self-report of neurobehavioral symptoms. The NSI-Cognition and Total scores had medium correlations with most composite scores, indicating a relationship between neurobehavioral symptoms and cognitive performances following MTBI. The NSI measures many symptoms of MTBI that have been related to cognitive functioning among military veterans, including affective distress, fatigue, and poor sleep quality (Rau et al., 2018; Verfaellie, Lafleche, Spiro, & Bousquet, 2014; Waldron-Perrine et al., 2012). Neurobehavioral symptoms co-occur with reductions in cognitive functioning following MTBI, and the affective and somatic experiences endorsed by service members may explain some of these cognitive impairments.
This study has several limitations that may have impacted the findings. First, the sample was not evaluated for PTSD or any preexisting mental health conditions (e.g., depression, anxiety) that could influence comparisons between participants with and without MTBI. The adverse cognitive effects of PTSD have been well documented (Scott et al., 2015), and previous research has illustrated a relationship between PTSD symptoms and cognitive performances among veterans (Storzbach et al., 2015; Verfaellie et al., 2014). However, only 12.5% of participants reported combat-related MTBI, and the majority of MTBIs reported by participants resulted from parachuting drills conducted within the United States. In turn, the psychological trauma associated with most MTBIs was limited, which may have made the small sample of participants with MTBI less generalizable to the population of service members who experience combat-related MTBI. Further, due to small sample sizes of eligible participants, women service members were excluded from the study, which limits the applicability of the findings to men.
Rather than the full spectrum of brain injury, the study focused exclusively on mild TBI occurring between 0 and 245 days prior to the assessment. An abundant number of published studies have examined the cognitive consequences of MTBI among athletes (Belanger & Vanderploeg, 2005), civilians (Belanger, Curtiss, Demery, Lebowitz, & Vanderploeg, 2005), and veterans (Karr, Areshenkoff, Duggan, & Garcia-Barrera, 2014a), and the cognitive effects of MTBI are often minimal beyond the first weeks to months following injury (Karr, Areshenkoff, & Garcia-Barrera, 2014b). The cognitive effects of moderate-to-severe TBI are more prominent than the effects associated with MTBI (Schretlen & Shapiro, 2003), and the composite scores may have had greater specificity and sensitivity differentiating control participants from participants with more severe TBIs.
The current study involved an assessment of multiple candidate composite scores for use as cognition endpoints in clinical trials. The primary focus of this study was psychometric and exploratory in nature; however, the comparisons between participants with and without MTBI and the preparation of normative data for the composite scores leads to greater clinical implications of the findings. Although the composite scores provided herein may be useful in clinical practice, especially when aggregating information from several different tests, they certainly cannot be considered a replacement for a process-oriented assessment of cognitive functioning. A neuropsychologist may be interested in understanding the cognitive strengths and weaknesses of a patient, in which case an omnibus score would have limited specificity. A neuropsychologist may also have hypotheses about specific cognitive abilities that may be impacted by a TBI or other condition. Specific deficits may be associated with TBI based on the severity and nature of the injury. A penetrative TBI may cause focal damage to a specific brain region, and a neuropsychologist would accurately suspect that damage to one region (e.g., right orbitofrontal lobe) would have a different impact on cognitive performance than damage to another region (e.g., left posterior temporal lobe). In contrast, when evaluating a patient with diffuse injury characteristics and general cognitive complaints, certain types of composite scores may be of greater value to understand the overall breadth and severity of cognitive impairment. Further, even in contexts of focal injuries, a neuropsychologist may have interest in summarizing the cognitive performances of a patient, for which a validated composite score would be of clinical utility.
The present study is part of a program of research designed to identify cognition endpoints for TBI clinical trials (Silverberg et al., 2017). The endpoint could be multidimensional in composition or it could be an endpoint for a single cognitive domain, such as memory. As such, the endpoint could be used in a clinical trial designed to quantify global and heterogeneous cognitive impairment, or a clinical trial that provides an intervention for a specific domain of impairment, such as memory impairment. This program of research is also applicable to the development of endpoints in other areas such as Alzheimer’s disease (Burnham et al., 2015; Donohue et al., 2017; Vellas et al., 2015), major depressive disorder (McIntyre, Lophaven, & Olsen, 2014), and neuro-oncology (Butowski & Chang, 2012). Our goal is to develop a reliable composite score of cognitive functioning that is useful for any test battery and any normative sample (e.g., different age, education, race/ethnicity, etc.). Ideally, this score should (a) be calculable from any number or combination of test scores, (b) produce a single score that is sensitive to acquired cognitive impairment, and (c) be meaningful as a clinical outcome in both research and practice. This study offers an early psychometric investigation into multiple candidate composite scores for the ANAM4 TBI-MIL that could eventually fulfill this purpose.
Funding
This work was funded by the U.S. Department of Defense as part of the TBI Endpoints Development Initiative with a grant entitled Development and Validation of a Cognition Endpoint for Traumatic Brain Injury Clinical Trials (subaward from W81XWH-14-2-0176). Noah Silverberg receives research salary support from a Health Professional Investigator Award from the Michael Smith Foundation for Health Research. Brian Ivins and Rael Lange receive research salary support from the Defense and Veterans Brain Injury Center through a contract with General Dynamics Information Technology (W91YTZ-13-C-0015).
Conflict of Interest
None declared.
Acknowledgements
Grant Iverson has received research support from test publishing companies in the past, including PAR, Inc., ImPACT Applications, Inc., and CNS Vital Signs. He receives royalties for one neuropsychological test (Wisconsin Card Sorting Test-64 Card Version). He acknowledges unrestricted philanthropic support from the Mooney-Reed Charitable Foundation, ImPACT Applications, Inc., and the Heinz Family Foundation.