


Abstract
Childhood trauma and adversity have been linked to chronic pain and pain sensitivity, particularly centralized pain. Yet, there remain numerous gaps in our understanding of this link.
We explored the association between nonviolent and violent childhood trauma and a component of centralized pain (i.e., generalized sensory sensitivity) and pain sensitivity using self-report measures of centralized pain and quantitative sensory testing (QST).
Patients scheduled for a total knee arthroplasty (n = 129) completed questionnaires and QST prior to surgery.
We found that self-report measures of centralized pain (i.e., widespread pain, somatic awareness, and sensory sensitivity) displayed a graded relationship across trauma groups, with patients with a history of violent trauma reporting the highest scores. Univariable multinomial logistic regression analyses showed that higher sensory sensitivity was associated with increased risk of being in the nonviolent trauma group compared to the no trauma group. Furthermore, higher widespread pain, higher somatic awareness, and higher sensory sensitivity distinguished the violent trauma group from the no trauma group. In multivariable analyses, sensory sensitivity is uniquely distinguished between the violent trauma group and the no trauma group. QST did not distinguish between groups.
The findings highlight the need for future research and interventions that reduce sensory sensitivity for chronic pain patients with a history of violent childhood trauma.
Childhood trauma and adversity have been linked to numerous negative health outcomes, including chronic pain and increased pain sensitivity [1–13]. In particular, childhood trauma is associated with indicators of centralized (or nociplastic [14]) pain, in which dysregulated central nervous system factors are believed to play a predominant role in the perceptual amplification of pain and its spatial spread [15]. The current study focuses on generalized sensory sensitivity, a symptom cluster of centralized pain, including widespread pain, heightened somatic awareness, and increased sensory sensitivity [16], to help elucidate the mechanisms conveying pain-related effects of childhood trauma.
Childhood trauma has been linked to components of the generalized sensory sensitivity construct. Lifetime history of trauma is associated with a higher number of painful body areas [17], as well as a proposed self-report measure of centralized pain [8] that includes items on pain distribution and symptoms such as depression and fatigue. Childhood abuse has also been linked to a higher prevalence of somatic symptoms [18–20]. Finally, the sequelae of trauma include heightened sensitivity to potential threats in the environment [21–23], including altered physiological reactivity to unexpected environmental stimuli [24].
The association between childhood trauma and centralized pain extends to the experimental induction of pain during quantitative sensory testing (QST). In clinical samples, individuals reporting a history of trauma exhibit lower pressure pain thresholds (PPTs) compared to those denying trauma [17, 25]. Lower PPTs are also observed in both pain-affected areas (e.g., the back for individuals with chronic low back pain) and pain-free areas among trauma victims, suggesting centralized pain mechanisms [17]. Childhood trauma was found to be associated with facilitated temporal summation of pain in college students [6]. Additionally, in pain-free men and women, a history of sexual assault was found to be associated with the facilitation of the nociceptive flexion reflex (i.e., a spinally mediated withdrawal reflex response) during a conditioned pain modulation (CPM) procedure, which typically induces pain inhibition [26]. Yet, some studies show no or reversed associations between a history of trauma and experimental pain sensitivity [20, 27–33]. Overall, variability in QST techniques and outcomes, as well as definitions of trauma, make it difficult to reach definitive conclusions regarding the association between trauma and experimental pain.
There remain numerous gaps in our understanding of the link between trauma, pain, and sensory sensitivity. Few studies have evaluated a comprehensive set of pain and sensitivity measures in relation to trauma history [17]. Furthermore, previous research suggests that violent trauma and those that involve a violation of trust between two individuals (e.g., interpersonal violence victimization) may be particularly detrimental to health [5, 34, 35]. Yet, to our knowledge, previous research has not considered these differences relative to pain. Thus, the present study took an exploratory approach to evaluate differences in indices of centralized pain (i.e., generalized sensory sensitivity) and QST by trauma history. These findings could be of critical importance to the treatment of chronic pain patients with a history of trauma by illuminating sensitivity pathways that potentially mediate the experience of chronic pain.
Materials and Methods
Participants and Procedure
The present study is a secondary analysis of patients scheduled for total knee arthroplasty (TKA) at the University of Michigan who were recruited from a knee surgery information workshop. Although the present research question is not specific to patients with knee osteoarthritis, this patient group is ideal because the pain phenotype is variable. Unlike centralized pain states (i.e., fibromyalgia [36]), there is a higher likelihood of variance in the presence of centralized pain among individuals with knee osteoarthritis. Previous research also suggests that adverse childhood experiences are common among patients with osteoarthritis [37]. The study was approved by the University of Michigan Institutional Review Board (Ann Arbor, MI). Patients were recruited between January 17, 2012, and August 25, 2016. The present sample is a subset of the parent Analgesic Outcomes Study; patients completed both a “light” phenotyping assessment as done for the parent study (i.e., self-reported measures acquired on the day of surgery), as well as a “deep” phenotyping assessment (i.e., additional questionnaires and QST within 1 month before surgery). All participants were required to be at least 18 years old and written informed consent was obtained prior to study participation. Additional exclusion criteria can be found in Neville et al. [38].
Survey Measures
Violent and nonviolent childhood trauma
Violent and nonviolent childhood trauma was assessed with the Childhood Traumatic Events Scale (CTES) [39]. The CTES asks participants to recall events experienced prior to the age of 17, including: death of a close friend or family member; major upheaval between parents (i.e., divorce or separation); a traumatic sexual experience (i.e., raped or molested); being the victim of violence (i.e., child abuse, mugged, or assaulted other than sexual); being extremely ill or injured; and any other major upheaval that shaped one’s life or personality significantly with an open-ended response option. For the present study, a multicategorical variable was created with three categories: any violent victimization (a traumatic sexual experience and/or being the victim of violence); nonviolent childhood trauma (death of a close friend or family member; major upheaval between parents; or being extremely ill or injured); and no trauma. Patients categorized as having experienced nonviolent trauma did not report any violent trauma. Open-ended responses to the “any other major upheaval” were categorized into violent (e.g., “molestation”) or nonviolent trauma (e.g., “father lost business”). Violent events that could not be categorized into one of the two violence victimization categories were retained in the nonviolent “other” category (e.g., “father beating mother”); this, however, described a minority of responses.
Characteristics of the traumatic event
The CTES also asks participants to indicate “How traumatic was this?” and “How much did you confide in others?” following each trauma item. Response options to the former trauma item range from 1 (not at all traumatic) to 7 (extremely traumatic). Response options to the latter disclosure item range from 1 (not at all) to 7 (a great deal). Participants’ scores on perceived trauma and disclosure were evaluated for descriptive purposes to characterize the traumatic event types.
Self-report measures of centralized pain
The Complex Medical Symptoms Inventory was used to measure somatic awareness and sensory sensitivity [16, 40]. For somatic awareness, patients were asked to indicate if they experienced any of 18 symptoms for at least 3 months in the past year, including, for example, muscle spasms, rapid heart rate, and dry mouth. Scores are summed and range from 0 to 18 (Cronbach’s α = 0.78). For sensory sensitivity, patients were asked to indicate if they had experienced sensitivity to certain chemicals, sound, odors, or bright lights for at least 3 months in the past year. Scores are summed, yielding a range from 0 to 4 (Cronbach’s α = 0.74). Widespread pain was assessed with the Michigan Body Map (MBM) [41]. The MBM is a one-sided figure of the human body with 35 potential pain locations. Participants are asked to indicate areas of chronic pain, defined as, “persistent or recurrent pain present for the last 3 months or longer (chronic pain).” A sum score is obtained, ranging from 0 to 35 (Cronbach’s α = 0.80).
Quantitative Sensory Testing
Four QST measures were used to assess mechanisms indicative of centralized pain, including alterations in pain sensitivity, temporal summation, and CPM [42]. Heightened pain sensitivity (i.e., hyperalgesia and allodynia) in asymptomatic body sites is a hallmark feature of the centralized pain phenotype [43]. Previous analyses of the current data suggest that a survey measure of centralized pain was associated with lower pain thresholds among women with knee osteoarthritis across multiple asymptomatic sites remote from the affected knees [38]. Temporal summation measures increases in pain perception caused by repetitive stimulation of C-fiber primary afferents, which results in increases in dorsal horn neuronal firing [44]. Previous research suggests that individuals with centralized pain conditions demonstrate facilitated temporal summation compared to healthy controls [45]. Finally, CPM measures reductions in pain caused by one stimulus by concurrent elicitation of pain from another stimulus. CPM is believed to reflect diffuse noxious inhibitory controls, whereby supraspinal structures trigger descending inhibitory projections due to the pain elicited from the secondary stimulus [44]. Previous research suggests that CPM is impaired in individuals with chronic pain [46]. Together, these QST measures evaluate various proposed mechanisms of centralized pain measured through peripheral means.
Pressure pain sensitivity
The Multimodal Automated Sensory Testing (MAST) system (Arbor Medical Innovations, Ann Arbor, MI) [38, 47] was used to deliver pressure pain to the dominant thumbnail using a 1 cm2 rubber-tipped probe. Pressure was computer driven and calibrated to deliver a series of pressures of 5 s duration in ascending order at 4 kgf/cm2/s, starting at 0.50 kgf/cm2 and increasing in 0.50 kgf/cm2 steps, with a 20 s interstimulus interval. Participants rated pain on a computer touchscreen using a 0 to 100 numerical rating scale (NRS; 0 = no pain to 100 = worst pain imaginable) following each stimulus. The test was terminated when: (a) the participant reached his or her pain tolerance; (b) the participant reported an intensity of ≥80/100; or (c) the maximum pressure of 10 kgf/cm2 was delivered. The present study utilizes two measures derived from this procedure: (a) PPT (the first pressure in a series of at least two pressures that evoke an NRS >0) and (b) pressure tolerance threshold (PTT; the last pressure collected).
Temporal summation
To measure temporal summation, 12 identical pressure stimuli of 1 s duration were delivered to the thumbnail at 1 s intervals using the MAST system [47]. Intensity was calibrated to be 20% above the participant’s thumbnail PPT. Participants rated their pain following each stimulus presentation on a digital 0 to 100 NRS. The pain rating of the first stimulus was subtracted from the final stimulus to calculate a temporal summation score. Larger scores indicate increased summation of pain.
Conditioned pain modulation
CPM was elicited by applying pressure to both thumbnails using the MAST system as previously described [47, 48]. The dominant thumb was treated as the test stimulus and the nondominant thumb was the conditioning stimulus. Individually calibrated pressure intensity was determined for each participant to elicit a moderate amount of pain (i.e., a pain rating between 30 and 50 on a 0 to 100 NRS). The test stimulus pressure was applied continuously to the dominant thumbnail for 30 s, and participants rated their level of evoked pain three times at 10, 20, and 30 s using a 0 to 100 NRS. A conditioning stimulus pressure was then applied continuously for 60 s to the nondominant thumbnail 10 to 15 min later. The same test stimulus pressure was reapplied to the dominant thumbnail concurrent with the last 30 s of conditioning stimulation. Again, participants rated test stimulus-evoked pain three times at 10, 20, and 30 s (corresponding to 40, 50, and 60 s of the conditioning stimulus). The magnitude of the CPM effect was calculated as the difference between the preconditioning test stimulus pain rating mean and the test stimulus pain rating mean during conditioning. Negative values suggest intact inhibitory CPM, whereas positive values suggest deficient CPM.
Data Analysis Plan
Descriptive statistics were obtained for study measures. Characteristics of the trauma groups were explored. Bivariate correlations among centralized pain measures were evaluated, with significance set at p < .05. Univariable and multivariable multinomial logistic regression analyses were assessed to determine variables associated with group status. Although we theoretically propose that trauma may lead to centralized pain, this method statistically treats centralized pain measures as the independent variable and trauma group status as the dependent variable. This statistical method has numerous advantages and is a powerful option to explore these cross-sectional associations [49]. Intercorrelations among self-report centralized pain measures ranged from r = 0.39 to r = 0.47. Intercorrelations among QST measures ranged from r = −0.02 to r = 0.56. Thus, intercorrelations were not a concern for multivariable models. We also assessed associations between the self-report measures of centralized pain and the QST measures with pain severity and pain interference. Overall, pain severity and pain interference were not significantly correlated with measures of centralized pain and, thus, were not included in the models. Bivariate correlations can be found in Supplementary Table 1. Multiple imputation with 25 imputations was used to handle missing data. Analyses were conducted in two sets: self-report measures of centralized pain and QST. Models were also assessed controlling for sex and age. Significance was determined using 95% confidence intervals (95% CIs) for the coefficient, with 95% CIs not including zero being considered statistically significant. The exponential function of the coefficient was obtained to determine the relative risk ratio.
Post hoc binomial logistic regression analyses were conducted to evaluate variables associated with each individual trauma experience. Multiple imputation scores were used for the individual predictors; however, scores on individual trauma experiences were not imputed. All models were adjusted for sex and age. Significance was determined using 95% CIs. Odds ratios were obtained by calculating the exponential function of the coefficient. Post hoc bivariate correlations are also provided for the association between how traumatic the event was (i.e., perceived trauma) and the level of disclosure for each individual trauma experience with self-report measures of centralized pain and QST measures. Although we evaluated significance based on α set at 0.05, sample sizes for each individual trauma experience varied. Thus, even large effect sizes (i.e., r > 0.50) were not necessarily statistically significant. StataIC version 15 was used for analyses.
Results
Sample Characteristics
One hundred twenty-nine participants were analyzed (Mage = 64.12, standard deviation [SD] = 8.64; 52.7% female). As seen in Table 1, the majority of participants (54.8%) experienced the death of a close friend or loved one during childhood. Approximately one out of three participants was extremely ill or injured during childhood. Similarly, one out of three reported another major traumatic event that shaped their personality or life. Sixteen percent reported a major upheaval between their parents, 13% experienced a traumatic sexual experience, and 10.6% experienced physical violence. When combined across categories, the majority of participants experienced nonviolent trauma (60.2%), whereas 18% reported violent trauma. Only 21.8% of the sample experienced no trauma during childhood.
Descriptive statistics for study variables
| n | n (%) | M (SD) | Range | |
|---|---|---|---|---|
| Age | 129 | 64.12 (8.64) | 41–86 | |
| Sex | 129 | |||
| Male | 61 (47.3%) | |||
| Female | 68 (52.7%) | |||
| Trauma history—individual categories | ||||
| Experienced death of close friend or family member | 124 | 68 (54.8%) | ||
| Major upheaval between parents | 124 | 20 (16.1%) | ||
| Traumatic sexual experience | 123 | 16 (13.0%) | ||
| Victim of violence (nonsexual) | 123 | 13 (10.6%) | ||
| Extremely ill or injured | 123 | 41 (33.3%) | ||
| Any other major upheaval that shaped life or personality | 121 | 34 (28.1%) | ||
| Trauma history—combined categories | 128 | |||
| No trauma | 28 (21.8%) | |||
| Nonviolent trauma | 77 (60.2%) | |||
| Violent trauma | 23 (18.0%) | |||
| Widespread pain (body areas) | 129 | 5.32 (3.86) | 1–18 | |
| Somatic awareness | 129 | 4.33 (3.19) | 0–15 | |
| Sensory sensitivity | 129 | 0.63 (1.09) | 0–4 | |
| Pressure pain threshold | 128 | 2.17 (1.17) | 0.5–6 | |
| Pressure tolerance threshold | 128 | 5.66 (1.79) | 2.5–10 | |
| Temporal summation | 122 | 1.95 (15.95) | −45–70 | |
| Conditioned pain modulation | 117 | 13.14 (16.05) | −28.33–66.67 |
SD standard deviation.
Sex was associated with trauma group (χ 2 = 7.72, p = .021). Half of the no trauma group (50%; 14/28) and 45.45% (35/77) of the nonviolent trauma group were female. Yet, 78.26% (18/23) were female in the violent trauma group. Trauma groups also marginally differed in age (Mno trauma = 65.71, SD = 8.90; Mnonviolent trauma = 64.44, SD = 8.41; Mviolent trauma = 60.61, SD = 8.32; F [2, 127] = 2.50, p = .086). As seen in Fig. 1, self-reported violent events (sexual trauma or physical violence) and other major upheavals that shaped one’s life or personality (nonviolent) had higher average scores on the level of trauma. Notably, sexual trauma was associated with the lowest rates of disclosure.
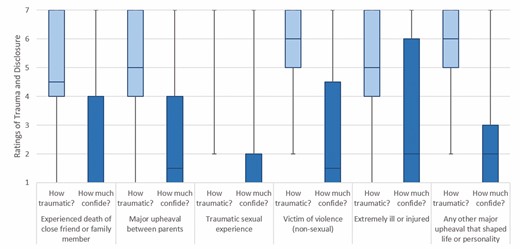
Boxplots for the level of trauma and disclosure by individual trauma experience. Whiskers show highest and lowest scores. Box shows interquartile range (Q1 and Q3). Line shows median rating. 1 = not at all traumatic/not at all (confide in others). 7 = extremely traumatic/a great deal (confide in others).
Widespread pain, somatic awareness, and sensory sensitivity were all significantly positively correlated. PPT and PTT were also significantly positively associated. Somatic awareness was marginally associated with lower PPT and PTT. Temporal summation was marginally associated with higher widespread pain. CPM was also marginally associated with higher PTT. See Table 2 for bivariate correlations for centralized pain measures.
Bivariate correlations for self-report measures of centralized pain and quantitative sensory testing
| 1 | 2 | 3 | 4 | 5 | 6 | |
|---|---|---|---|---|---|---|
| 1. Widespread pain (body areas) | – | |||||
| 2. Somatic awareness | 0.47*** | – | ||||
| 3. Sensory sensitivity | 0.39*** | 0.39*** | – | |||
| 4. Pressure pain threshold | −0.004 | −0.17ǂ | −0.14 | – | ||
| 5. Pressure tolerance threshold | −0.07 | −0.17ǂ | −0.08 | 0.56*** | – | |
| 6. Temporal summation | 0.17ǂ | 0.15 | 0.08 | −0.04 | −0.02 | – |
| 7. Conditioned pain modulation | 0.09 | 0.07 | 0.08 | 0.12 | 0.16ǂ | −0.07 |
ǂp < .10; *p < .05; **p < .01; ***p < .001.
Self-report measures of centralized pain displayed a graded relationship across trauma group such that individuals who experienced no trauma had the lowest scores and those who experienced violent trauma had the highest scores (see Fig. 2). A consistent pattern was not evident for QST.

Scores on measures of self-reported centralized pain and quantitative sensory testing by trauma group. Error bars display +1/−1 standard deviations. Body areas range from 1 to 18. Somatic awareness ranges from 0 to 15. Sensory sensitivity ranges from 0 to 4. PPT ranges from 0.5 to 6. PTT ranges from 2.5 to 10. TS ranges from −45 to 70. CPM ranges from −28.33 to 66.67. CPM conditioned pain modulation; PPT pressure pain threshold; PTT pressure tolerance threshold; TS temporal summation. For self-report measures of centralized pain, patients with a history of violent trauma were most sensitive.
Multinomial Logistic Regression Analyses
Univariable multinomial logistic regression analyses suggest that a 1 unit increase in self-reported sensory sensitivity was associated with four times the risk of being in the violent trauma group compared to the no trauma group and 2.5 times the risk of being in the nonviolent trauma group compared to the no trauma group (see Table 3). Additionally, a 1 unit increase in widespread pain and somatic awareness were both individually associated with 1.24 times the risk of being in the violent trauma group compared to the no trauma group. The self-report measures of centralized pain also distinguished between the nonviolent and violent trauma groups. A 1 unit increase in widespread pain was associated with 1.1 times the risk of being in the violent trauma group compared to the nonviolent trauma group, which was a marginal association. Additionally, a 1 unit increase in sensory sensitivity was associated with 1.62 times the risk of being in the violent trauma group compared to the nonviolent trauma group. These associations were consistent when controlling for sex and age, with the exception of widespread pain distinguishing violent from nonviolent trauma, which became nonsignificant, and sensory sensitivity distinguishing violent from nonviolent trauma, which became marginally significant.
Univariable multinomial logistic regression models for self-report measures of centralized pain
| Trauma group | Centralized pain measure | Model 1 | Model 2 | ||||||||
|---|---|---|---|---|---|---|---|---|---|---|---|
| Coeff. | RRR | SE | p | 95% CI | Coeff. | RRR | SE | p | 95% CI | ||
| Unadjusted models | |||||||||||
| No trauma | Reference | ||||||||||
| Nonviolent trauma | Widespread pain (body areas) | 0.11 | 1.12 | 0.08 | .134 | [−0.035, 0.262] | Reference | ||||
| Somatic awareness | 0.10 | 1.11 | 0.08 | .209 | [−0.057, 0.260] | ||||||
| Sensory sensitivity | 0.92 | 2.50 | 0.46 | .044 | [0.024, 1.809] | ||||||
| Violent trauma | Widespread pain (body areas) | 0.21 | 1.24 | 0.08 | .012 | [0.046, 0.378] | 0.10 | 1.10 | 0.06 | .073 | [−0.009, 0.206] |
| Somatic awareness | 0.21 | 1.24 | 0.09 | .024 | [0.029, 0.399] | 0.11 | 1.12 | 0.07 | .106 | [−0.024, 0.249] | |
| Sensory sensitivity | 1.40 | 4.04 | 0.47 | .003 | [0.466, 2.327] | 0.48 | 1.62 | 0.19 | .011 | [0.111, 0.849] | |
| Adjusted models for sex and age | |||||||||||
| No trauma | Reference | ||||||||||
| Nonviolent trauma | Widespread pain (body areas) | 0.13 | 1.14 | 0.08 | .091 | [−0.021, 0.288] | Reference | ||||
| Somatic awareness | 0.12 | 1.13 | 0.08 | .135 | [−0.039, 0.289] | ||||||
| Sensory sensitivity | 0.96 | 2.60 | 0.46 | .039 | [0.050, 1.860] | ||||||
| Violent trauma | Widespread pain (body areas) | 0.20 | 1.22 | 0.09 | .026 | [0.023, 0.374] | 0.07 | 1.07 | 0.06 | .264 | [−0.049, 0.180] |
| Somatic awareness | 0.21 | 1.23 | 0.10 | .039 | [0.011, 0.405] | 0.08 | 1.09 | 0.08 | .275 | [−0.066, 0.232] | |
| Sensory sensitivity | 1.32 | 3.75 | 0.48 | .006 | [0.375, 2.266] | 0.37 | 1.44 | 0.20 | .063 | [−0.019, 0.751] | |
Italicized values are significant at p < .10. Boldfaced values are significant at p < .05. Adjusted models included sex and age as covariates.
CI confidence interval; RRR relative risk ratio; SE standard error.
Multivariable multinomial logistic regression analyses suggest that self-reported sensory sensitivity is particularly important for distinguishing trauma groups (see Table 4). A 1 unit increase in sensory sensitivity was associated with 3.46 times the risk of being in the violent trauma group compared to the no trauma group and 2.33 times the risk of being in the nonviolent trauma group compared to the no trauma group. Sensory sensitivity also distinguished between the nonviolent and violent trauma groups, though this association was marginally significant. A 1 unit increase in sensory sensitivity was associated with 1.48 times the risk of being in the violent trauma group compared to the nonviolent trauma group. When controlling for sex and age, sensory sensitivity remained marginally significant in distinguishing nonviolent trauma from no trauma and significantly distinguished violent trauma from no trauma.
Multivariable multinomial logistic regression models for self-report measures of centralized pain
| Trauma group | Centralized pain measure | Model 1 | Model 2 | ||||||||
|---|---|---|---|---|---|---|---|---|---|---|---|
| Coeff. | RRR | SE | p | 95% CI | Coeff. | RRR | SE | p | 95% CI | ||
| Unadjusted models | |||||||||||
| No trauma | Reference | ||||||||||
| Nonviolent trauma | Widespread pain (body areas) | 0.08 | 1.09 | 0.09 | .336 | [−0.087, 0.255] | Reference | ||||
| Somatic awareness | −0.001 | 1.00 | 0.10 | .988 | [−0.189, 0.186] | ||||||
| Sensory sensitivity | 0.85 | 2.33 | 0.48 | .079 | [−0.097, 1.791] | ||||||
| Violent trauma | Widespread pain (body areas) | 0.12 | 1.13 | 0.10 | .222 | [−0.075, 0.321] | 0.04 | 1.04 | 0.07 | .550 | [−0.090, 0.168] |
| Somatic awareness | 0.03 | 1.03 | 0.12 | .777 | [−0.193, 0.259] | 0.03 | 1.03 | 0.08 | .681 | [−0.128, 0.196] | |
| Sensory sensitivity | 1.24 | 3.46 | 0.50 | .014 | [0.253, 2.231] | 0.39 | 1.48 | 0.21 | .060 | [−0.017, 0.806] | |
| Adjusted models for sex and age | |||||||||||
| No trauma | Reference | ||||||||||
| Nonviolent trauma | Widespread pain (body areas) | 0.09 | 1.10 | 0.09 | .297 | [−0.082, 0.270] | Reference | ||||
| Somatic awareness | 0.02 | 1.02 | 0.10 | .833 | [−0.171, 0.212] | ||||||
| Sensory sensitivity | 0.83 | 2.29 | 0.48 | .085 | [−0.115, 1.776] | ||||||
| Violent trauma | Widespread pain (body areas) | 0.11 | 1.11 | 0.11 | .314 | [−0.101, 0.314] | 0.01 | 1.01 | 0.07 | .854 | [−0.123, 0.148] |
| Somatic awareness | 0.05 | 1.05 | 0.12 | .664 | [−0.183, 0.288] | 0.03 | 1.03 | 0.09 | .721 | [−0.142, 0.205] | |
| Sensory sensitivity | 1.15 | 3.17 | 0.51 | .023 | [0.161, 2.147] | 0.32 | 1.38 | 0.22 | .136 | [−0.102, 0.750] | |
Italicized values are significant at p < .10. Boldfaced values are significant at p < .05. Adjusted models included sex and age as covariates.
CI confidence interval; RRR relative risk ratio; SE standard error.
Univariable multinomial logistic regression analyses evaluating the association of QST measures with group status are presented in Table 5. As can be seen, none of the measures significantly distinguished between the trauma groups, although the effect of PPT in distinguishing the nonviolent trauma group from the no trauma group was marginally significant when controlling for sex and age. Specifically, a 1 unit increase in PPT was associated with 0.71 times the risk of being in the nonviolent trauma group compared to the no trauma group. Because all findings were nonsignificant, however, multivariable analyses are not presented.
Univariable multinomial logistic regression models for quantitative sensory testing
| Trauma group | Centralized pain measure | Model 1 | Model 2 | ||||||||
|---|---|---|---|---|---|---|---|---|---|---|---|
| Coeff. | RRR | SE | p | 95% CI | Coeff. | RRR | SE | p | 95% CI | ||
| Unadjusted models | |||||||||||
| No trauma | Reference | ||||||||||
| Nonviolent trauma | Pressure pain threshold | −0.29 | 0.75 | 0.19 | .118 | [−0.655, 0.074] | Reference | ||||
| Pressure tolerance threshold | 0.05 | 1.05 | 0.13 | .698 | [−0.197, 0.294] | ||||||
| Temporal summation | 0.01 | 1.01 | 0.01 | .314 | [−0.014, 0.043] | ||||||
| Conditioned pain modulation | −0.01 | 0.99 | 0.01 | .512 | [−0.039, 0.019] | ||||||
| Violent trauma | Pressure pain threshold | −0.22 | 0.81 | 0.24 | .361 | [−0.681, 0.248] | 0.07 | 1.08 | 0.21 | .722 | [−0.335, 0.483] |
| Pressure tolerance threshold | −0.16 | 0.85 | 0.17 | .339 | [−0.495, 0.170] | −0.21 | 0.81 | 0.15 | .146 | [−0.495, 0.073] | |
| Temporal summation | 0.01 | 1.01 | 0.02 | .585 | [−0.026, 0.045] | −0.005 | 1.00 | 0.02 | .763 | [−0.034, 0.025] | |
| Conditioned pain modulation | 0.005 | 1.00 | 0.02 | .795 | [−0.032, 0.042] | 0.01 | 1.01 | 0.02 | .346 | [−0.016, 0.045] | |
| Adjusted models for sex and age | |||||||||||
| No trauma | Reference | ||||||||||
| Nonviolent trauma | Pressure pain threshold | −0.35 | 0.71 | 0.19 | .073 | [−0.726, 0.032] | Reference | ||||
| Pressure tolerance threshold | 0.01 | 1.01 | 0.13 | .918 | [−0.249, 0.277] | ||||||
| Temporal summation | 0.02 | 1.02 | 0.01 | .229 | [−0.011, 0.047] | ||||||
| Conditioned pain modulation | −0.01 | 0.99 | 0.01 | .542 | [−0.038, 0.020] | ||||||
| Violent trauma | Pressure pain threshold | −0.32 | 0.72 | 0.25 | .204 | [−0.819, 0.175] | 0.02 | 1.03 | 0.22 | .912 | [−0.415, 0.465] |
| Pressure tolerance threshold | −0.16 | 0.85 | 0.18 | .393 | [−0.517, 0.203] | −0.17 | 0.84 | 0.16 | .279 | [−0.479, 0.138] | |
| Temporal summation | 0.01 | 1.01 | 0.02 | .441 | [−0.022, 0.051] | −0.003 | 1.00 | 0.02 | .821 | [−0.034, 0.027] | |
| Conditioned pain modulation | 0.003 | 1.00 | 0.02 | .874 | [−0.034, 0.041] | 0.01 | 1.01 | 0.02 | .443 | [−0.019, 0.043] | |
Italicized values are significant at p < .10. Boldfaced values are significant at p < .05. Adjusted models included sex and age as covariates.
CI confidence interval; RRR relative risk ratio; SE standard error.
Post Hoc Analyses
To examine the association of self-report centralized pain measures and QST with specific experiences of trauma, binomial logistic regression analyses were performed. Results are reported in Table 6. Multivariable models are only presented for measure sets (i.e., self-report centralized pain or QST) where at least one variable in the set was statistically significant. Self-reported sensory sensitivity was associated with higher odds of having experienced sexual trauma; sensory sensitivity remained marginally significant in the context of other self-report measures of centralized pain. Widespread pain and sensory sensitivity were also associated with higher odds of having experienced nonsexual violence. Again, sensory sensitivity remained marginally significant when in the context of other self-report measures of centralized pain. Sensory sensitivity was also associated with higher odds of having been ill or injured during childhood, and this remained significant in the context of other variables. Finally, widespread pain was associated with higher odds of having experienced other major upheavals that shaped one’s life or personality. This remained marginally significant in the multivariable model.
Post hoc binomial logistic regression models for individual trauma experiences adjusted for age and sex
| Trauma type | Centralized pain measure | Univariable | Multivariable—self-report measures | ||||||||
|---|---|---|---|---|---|---|---|---|---|---|---|
| Coeff. | OR | SE | p | 95% CI | Coeff. | OR | SE | p | 95% CI | ||
| Experienced death of close friend or family member (n = 124) | Widespread pain (body areas) | 0.03 | 1.03 | 0.05 | .519 | [−0.063, 0.126] | |||||
| Somatic awareness | 0.07 | 1.07 | 0.06 | .273 | [−0.053, 0.186] | ||||||
| Sensory sensitivity | 0.24 | 1.27 | 0.18 | .180 | [−0.110, 0.583] | ||||||
| Pressure pain threshold | 0.09 | 1.10 | 0.16 | .561 | [−0.223, 0.411] | ||||||
| Pressure tolerance threshold | −0.02 | 0.98 | 0.11 | .867 | [−0.233, 0.197] | ||||||
| Temporal summation | −0.002 | 1.00 | 0.01 | .841 | [−0.026, 0.021] | ||||||
| Conditioned pain modulation | −0.01 | 0.99 | 0.01 | .293 | [−0.037, 0.011] | ||||||
| Major upheaval between parents (n = 124) | Widespread pain (body areas) | 0.11 | 1.11 | 0.06 | .070 | [−0.009, 0.221] | |||||
| Somatic awareness | 0.05 | 1.05 | 0.08 | .543 | [−0.103, 0.197] | ||||||
| Sensory sensitivity | 0.004 | 1.00 | 0.22 | .985 | [−0.436, 0.445] | ||||||
| Pressure pain threshold | −0.06 | 0.94 | 0.22 | .783 | [−0.495, 0.373] | ||||||
| Pressure tolerance threshold | −0.10 | 0.90 | 0.15 | .498 | [−0.403, 0.196] | ||||||
| Temporal summation | 0.01 | 1.01 | 0.02 | .585 | [−0.022, 0.040] | ||||||
| Conditioned pain modulation | 0.01 | 1.01 | 0.02 | .608 | [−0.022, 0.038] | ||||||
| Traumatic sexual experience (n = 64)a | Widespread pain (body areas) | 0.09 | 1.10 | 0.06 | .142 | [−0.031, 0.219] | 0.01 | 1.01 | 0.08 | .940 | [−0.152, 0.164] |
| Somatic awareness | 0.12 | 1.12 | 0.09 | .180 | [−0.054, 0.285] | 0.04 | 1.04 | 0.11 | .711 | [−0.167, 0.245] | |
| Sensory sensitivity | 0.55 | 1.74 | 0.23 | .018 | [0.096, 1.012] | 0.51 | 1.66 | 0.27 | .060 | [−0.022, 1.033] | |
| Pressure pain threshold | −0.15 | 0.86 | 0.28 | .592 | [−0.687, 0.392] | ||||||
| Pressure tolerance threshold | −0.16 | 0.85 | 0.19 | .400 | [−0.541, 0.216] | ||||||
| Temporal summation | −0.004 | 1.00 | 0.02 | .828 | [−0.040, 0.032] | ||||||
| Conditioned pain modulation | 0.01 | 1.01 | 0.02 | .593 | [−0.028, 0.050] | ||||||
| Victim of violence (nonsexual; n = 123) | Widespread pain (body areas) | 0.13 | 1.14 | 0.07 | .041 | [0.005, 0.263] | 0.10 | 1.10 | 0.08 | .229 | [−0.061, 0.255] |
| Somatic awareness | 0.07 | 1.08 | 0.09 | .394 | [−0.097, 0.247] | −0.05 | 0.95 | 0.11 | .648 | [−0.264, 0.164] | |
| Sensory sensitivity | 0.57 | 1.77 | 0.23 | .012 | [0.125, 1.018] | 0.49 | 1.63 | 0.25 | .054 | [−0.008, 0.985] | |
| Pressure pain threshold | 0.02 | 1.02 | 0.26 | .947 | [−0.494, 0.529] | ||||||
| Pressure tolerance threshold | −0.22 | 0.80 | 0.20 | .261 | [−0.606, 0.164] | ||||||
| Temporal summation | −0.002 | 1.00 | 0.02 | .908 | [−0.038, 0.034] | ||||||
| Conditioned pain modulation | 0.005 | 1.00 | 0.02 | .795 | [−0.033, 0.042] | ||||||
| Extremely ill or injured (n = 123) | Widespread pain (body areas) | 0.05 | 1.05 | 0.05 | .344 | [−0.051, 0.146] | 0.003 | 1.00 | 0.06 | .954 | [−0.114, 0.121] |
| Somatic awareness | 0.05 | 1.05 | 0.06 | .461 | [−0.076, 0.167] | −0.02 | 0.98 | 0.07 | .798 | [−0.161, 0.124] | |
| Sensory sensitivity | 0.48 | 1.61 | 0.18 | .009 | [0.120, 0.833] | 0.49 | 1.64 | 0.20 | .015 | [0.094, 0.890] | |
| Pressure pain threshold | −0.36 | 0.70 | 0.19 | .056 | [−0.733, 0.009] | ||||||
| Pressure tolerance threshold | −0.18 | 0.83 | 0.12 | .132 | [−0.425, 0.056] | ||||||
| Temporal summation | 0.01 | 1.01 | 0.01 | .284 | [−0.011, 0.039] | ||||||
| Conditioned pain modulation | −0.003 | 1.00 | 0.01 | .814 | [−0.028, 0.022] | ||||||
| Any other major upheaval that shaped life or personality (n = 121) | Widespread pain (body areas) | 0.13 | 1.13 | 0.05 | .018 | [0.022, 0.231] | 0.12 | 1.12 | 0.06 | .057 | [−0.004, 0.237] |
| Somatic awareness | 0.08 | 1.08 | 0.07 | .220 | [−0.048, 0.208] | 0.01 | 1.01 | 0.08 | .921 | [−0.144, 0.159] | |
| Sensory sensitivity | 0.23 | 1.25 | 0.18 | .216 | [−0.132, 0.582] | 0.06 | 1.07 | 0.21 | .761 | [−0.348, 0.475] | |
| Pressure pain threshold | −0.19 | 0.83 | 0.19 | .339 | [−0.565, 0.194] | ||||||
| Pressure tolerance threshold | 0.03 | 1.03 | 0.12 | .829 | [−0.217, 0.271] | ||||||
| Temporal summation | −0.01 | 0.99 | 0.01 | .348 | [−0.041, 0.015] | ||||||
| Conditioned pain modulation | −0.004 | 1.00 | 0.01 | .742 | [−0.030, 0.021] | ||||||
Italicized values are significant at p < .10. Boldfaced values are significant at p < .05. Models are adjusted for age and sex.
aAll sexual trauma victims were female. Therefore, these models included only females.
CI confidence interval; OR odds ratio; SE standard error.
Bivariate correlations were also assessed between perceived trauma and disclosure for individual trauma experiences with self-report measures of centralized pain and QST. Results are reported in Table 7. For individuals who experienced the death of a close friend or family member, higher perceived trauma was marginally associated with less widespread body pain and significantly associated with higher CPM. Higher levels of disclosure were significantly associated with lower sensory sensitivity. For individuals who experienced a major upheaval between parents, higher levels of disclosure were significantly associated with less widespread body pain and higher PTT. For individuals who experienced sexual trauma, higher levels of disclosure were significantly associated with more widespread pain and marginally associated with higher PPT. For victims of nonsexual violence, higher perceived trauma was significantly associated with higher sensory sensitivity, whereas higher levels of disclosure were marginally associated with lower PTT. For individuals who had been severely ill or injured, higher perceived trauma was significantly associated with more widespread pain and higher somatic awareness. It was also marginally associated with lower PTT. Finally, for individuals who experienced some other major upheaval that shaped one’s life or personality, higher perceived trauma was marginally associated with higher CPM.
Post hoc bivariate correlations between perceived trauma and disclosure for individual trauma experiences with self-report measures of centralized pain and quantitative sensory testing
| n | Widespread pain (body areas) | Somatic awareness | Sensory sensitivity | Pressure pain threshold | Pressure tolerance threshold | Temporal summation | Conditioned pain modulation | ||
|---|---|---|---|---|---|---|---|---|---|
| Death of close friend of family member | Traumatic | 66 | −0.21ǂ | 0.14 | −0.10 | 0.11 | 0.15 | −0.09 | 0.32* |
| Disclosure | 66 | −0.16 | −0.01 | −0.25* | 0.05 | 0.08 | −0.02 | 0.09 | |
| Major upheaval between parents | Traumatic | 19 | 0.09 | 0.17 | 0.29 | −0.02 | −0.02 | −0.01 | 0.07 |
| Disclosure | 18 | −0.52* | −0.34 | −0.25 | 0.16 | 0.54* | −0.32 | −0.19 | |
| Traumatic sexual experience | Traumatic | 15 | 0.16 | 0.39 | 0.42 | −0.29 | 0.05 | 0.03 | −0.35 |
| Disclosure | 14 | 0.55* | −0.06 | −0.21 | 0.50ǂ | 0.04 | 0.44 | 0.04 | |
| Victim of violence | Traumatic | 13 | 0.32 | 0.22 | 0.61* | 0.47 | −0.36 | −0.15 | 0.13 |
| Disclosure | 12 | 0.19 | 0.28 | −0.05 | −0.36 | −0.52ǂ | −0.08 | −0.06 | |
| Extremely ill or injured | Traumatic | 37 | 0.34* | 0.37* | 0.25 | 0.02 | −0.30ǂ | 0.13 | 0.06 |
| Disclosure | 37 | 0.22 | 0.10 | 0.07 | −0.25 | −0.15 | 0.11 | −0.01 | |
| Any other major upheaval | Traumatic | 33 | 0.12 | 0.03 | 0.16 | −0.13 | 0.08 | 0.21 | 0.31ǂ |
| Disclosure | 34 | −0.12 | −0.14 | −0.04 | −0.24 | −0.14 | −0.12 | 0.20 |
ǂp < .10; *p < .05; **p < .01; ***p < .001.
Discussion
The present study provides important insight into different components of pain and sensory sensitivity according to childhood trauma history. Despite our growing knowledge in regard to the multiple components and indicators of centralized pain, these domains have not been integrated into evaluations of the impact of childhood trauma. Studies evaluating individual components of centralized pain, such as widespread pain, somatic symptoms, heightened pain sensitivity, and common psychiatric comorbidity, support the association between childhood trauma and centralized pain. Additionally, to our knowledge, previous research has not considered differences in centralized pain according to whether the trauma included violence victimization or nonviolent trauma. This information can illuminate mechanisms of sensitivity and, ultimately, be used to tailor treatment for patients with chronic pain.
Childhood Traumatic Events Are Common and Differ in Important Ways
The majority of participants experienced nonviolent trauma, particularly the death of a close friend or family member during childhood (see Table 1). Overall, two out of three participants reported some nonviolent trauma during childhood. Thus, the experience of some form of traumatic event is common [3]. Experiences of sexual or physical violence were reported by about 1 out of 10 individuals in this sample of surgical patients undergoing TKA. This is similar to a previous study assessing childhood physical abuse prevalence in a population-based sample of individuals with osteoarthritis from the two Canadian provinces [37]. The rate of physical abuse is also similar to that reported by the Adverse Childhood Experiences (ACE) Study, which represented a sample of adult health maintenance organization enrollees at a large health center; the present rate of sexual trauma, however, is lower than the rate of childhood sexual abuse reported in the ACE study (22.0%) [10]. This may reflect the differences in prevalence rates depending on questionnaire wording and format [50].
Sexual and physical violence elicited high levels of perceived trauma among individuals in this study (see Fig. 1). Indeed, the lifetime prevalence of posttraumatic stress disorder is highest among victims of interpersonal violence [3, 35]. Traumatic events in which an important individual harms or violates the victim are also unique in that they may elicit both fear and a sense of betrayal (i.e., “betrayal trauma”) [34]. Previous research suggests that more exposure to trauma characterized by betrayal is associated with higher scores on negative indicators of health, including trauma symptoms, somatic symptoms, and dissociation [34]. We are, however, unable to truly characterize violent trauma in the current sample as betrayal trauma because we do not have enough information about the traumatic event (e.g., if the perpetrator was known to the victim). Sexual violence may be particularly impactful as the degree of perceived trauma was high and levels of disclosure following the event were low for victims in this study. Sexual violence during childhood can elicit a sense of extreme shame, thereby hindering the desire to confide in others [51]. This can be further exacerbated by negative responses and blame from confidants in response to the disclosure of sexual abuse experiences [51, 52].
Self-Reported Sensory Sensitivity is Particularly Important for Distinguishing Trauma Groups
Higher levels of self-reported sensory sensitivity were associated with the risk of being in any trauma group and, furthermore, experiencing violent trauma compared to nonviolent trauma (see Table 3). In the context of other variables, sensory sensitivity continued to be significantly associated with a heightened risk of being a victim of violent trauma compared to no trauma (see Table 4). Previous research suggests that childhood trauma, as well as insecure attachment style (a potential consequence of interpersonal trauma), is correlated with sensory sensitivity [22, 53]. Additionally, victims of childhood trauma have a heightened sensitivity for threat detection and increased vigilance for threat cues [21, 23, 54–57]. This information is conveyed by sensory experiences, which are important cues of safety and/or threat [55]. Importantly, the present findings suggest that this association is a graded relationship, with violent trauma victims experiencing the greatest association with sensory sensitivity. Our findings also suggest that this heightened sensitivity extends across numerous sensory domains, including sensitivity to chemicals, sound, odors, and lights.
This increased sensory sensitivity may represent differences in the way individuals experience and interpret their environment. Research suggests that childhood maltreatment is associated with experience-dependent alterations of sensory systems in the brain [56]. Victims of childhood maltreatment also show an increased amygdala response to threatening stimuli (e.g., emotional faces) [56]. Amygdala activity can be modulated by both conscious and nonconscious neural pathways [56], suggesting that victims may report a negative response to stimuli without attributing it directly to the perception of threat. Delineating these potential explanations for the present findings is an important area for future research.
QST Did Not Distinguish Trauma Groups
In concordance with some previous research [29–31, 33], the present study found no significant associations between QST measures and trauma group status (see Table 5). It is possible that, among adult surgical patients undergoing TKA, a history of childhood trauma is not associated with pain sensitivity, temporal summation, or CPM. Yet, a more nuanced evaluation of these findings is warranted. QST has a subjective component such that participants are required to rapidly evaluate and report when they experience acute pain or when the sensation changes. This is unlike self-report measures of centralized pain, which capture chronic pain or sensations felt over 3 months. Reporting chronic pain and sensitivity also requires reflection and awareness of sensations, and the survey format permits deliberation. It is possible that trauma victims have a more difficult time quickly distinguishing the sensation of pain due to impairments in interoception or awareness of body sensations [58]. Thus, delayed responding due to uncertainty about when to react would mirror delayed responding due to a true lack of pain or sensation. Victims may also cope with pain through psychological avoidance. For example, previous research suggests that body dissociation (i.e., avoidance of internal experiences) is higher among victims of trauma [59]. Victims of trauma may also be more reluctant to report pain and, instead, not disclose this for various reasons, including impression management, approval seeking, and/or distrust of others [60–62]. In each scenario, the response from victims of trauma may mimic an individual who has not experienced trauma. Future studies should evaluate cognitive processing of acute pain stimuli according to trauma history. We also did not evaluate QST measures of visual or auditory sensitivity, which may be more closely related to self-report measures of sensitivity. This, too, is an intriguing area for future research.
It is also important to note that trauma victims are a heterogeneous group. Some victims may experience psychological, social, and physical outcomes related to trauma. Others, however, may display resilience, particularly if the victim experiences a supportive environment and early intervention [63]. Similarly, the sequelae of trauma can differ, including physiological responses to threatening stimuli [55]. For example, research and theory suggest that some trauma victims respond with hypomobilization to threat rather than hypermobilization, and this may be linked to dissociative symptoms [55]. Experimental pain induction may function differently for individuals with these trauma sequelae. We did not have data in this study to tease apart these associations; therefore, future studies should consider potential mediators of this association.
Limitations
Several limitations are worth noting. The current study included a small sample; however, it was larger than most studies with extensive measures of trauma and centralized pain. It was also cross-sectional and, therefore, the direction of effects cannot be ascertained. The majority of the sample was older adults presenting for surgery; it is unclear if the present findings would apply to younger adults or other pain populations. The QST measures utilized only pressure pain. Future studies should explore other stimulus modalities. In particular, future research would benefit from an in-depth examination of other sensory QST modalities, such as light and sound [64]. The measure of trauma was also limited. Specifically, for violent trauma, participants were asked about serious incidents that may have required victims to acknowledge or label the experience as abuse or assault. Yet, many victims do not acknowledge or label abusive experiences as such [65]. The measure of trauma in the present study also failed to capture emotional abuse, emotional and physical neglect, and many of the other experiences commonly considered adverse childhood experiences (i.e., parental violence and drug use). Future research would benefit from the inclusion of more comprehensive measures.
Clinical Implications and Conclusion
Patients with a history of trauma, and violent trauma, in particular, may be unique in their response to external sensory stimuli. Heightened sensory sensitivity may impede normal functioning for victims of childhood trauma. Increased sensory sensitivity may be related to a heightened sense of threat, consciously or unconsciously, in the environment [55]. This could limit victims’ ability to engage productively with the environment and may directly or indirectly contribute to the experience of centralized pain [66]. These findings begin to illuminate mechanistic pathways leading to pain experiences among victims of violence and, consequently, unique intervention opportunities, thus necessitating future research. For example, interventions that focus on reducing sensory sensitivity or encouraging feelings of safety may contribute to symptom improvement and recovery after surgery [55].
Our findings suggest that childhood trauma is associated with characteristics of centralized pain, particularly sensory sensitivity. Violent trauma during childhood in particular may be linked to heightened sensory sensitivity in adulthood. Future research should investigate the direction of these effects, mechanisms of this association, and potential interventions to improve functioning among victims of trauma.
Acknowledgment
The authors thank Dr. Stephanie Moser for insightful discussions.
Funding: This research was supported by the Department of Anesthesiology at the University of Michigan. J.P. is supported by a Postdoctoral Translational Scholar Program training grant from the Michigan Institute for Clinical and Health Research (UL1TR002240; PI: George Mashour). C.M.B. is supported by the National Institutes of Health (grants NIDA-14-PAF07095 and NIAMS-16-PAF02746).
Disclosures A.L.H. is a consultant to Precision Health Economics and AbbVie Pharmaceuticals. S.E.H. reports grants and personal fees from Aptinyx, and grants, co-ownership, and licensing agreement with royalties for Arbor Medical Innovations, LLC. C.M.B. is supported by the National Institutes of Health (grants NIDA-14-PAF07095 and NIAMS-16-PAF02746). J.P., J.M., C.S., and A.S. have no disclosures.
Compliance with Ethical Standards
Authors’ Statement of Conflict of Interest and Adherence to Ethical Standards
Authors’ Contributions J.P. was responsible for the conception and design of the work; analysis and interpretation of the data; and drafting the manuscript. A.L.H. contributed to the interpretation of the data and critical revision of the manuscript. C.M.B. was responsible for study design; acquisition of the data; and critical revision of the manuscript. J.M. contributed to critical revision of the manuscript. C.S. contributed to critical revision of the manuscript. A.S. contributed to critical revision of the manuscript. S.E.H. was responsible for study design; acquisition and interpretation of the data; and critical revision of the manuscript.
Ethical Approval The study was approved by the University of Michigan Institutional Review Board.
Informed Consent All participants provided informed consent.
References
