


Abstract
Understanding determinants of metabolic risk has become a national priority given the increasingly high prevalence rate of this condition among U.S. adults.
This study’s aim was to assess the impact of gene-by-neighborhood social environment interactions on waist circumference (WC) as a primary marker of metabolic risk in underserved African-American adults. Based on a dual-risk model, it was hypothesized that those with the highest genetic risk and who experienced negative neighborhood environment conditions would demonstrate higher WC than those with fewer risk factors.
This study utilized a subsample of participants from the Positive Action for Today’s Health environmental intervention to improve access and safety for walking in higher-crime neighborhoods, who were willing to provide buccal swab samples for genotyping stress-related genetic pathways. Assessments were conducted with 228 African-American adults at baseline, 12, 18, and 24 months.
Analyses indicated three significant gene-by-environment interactions on WC outcomes within the sympathetic nervous system (SNS) genetic pathway. Two interactions supported the dual-risk hypotheses, including the SNS genetic risk-by-neighborhood social life interaction (b = −0.11, t(618) = −2.02, p = .04), and SNS genetic risk-by-informal social control interaction (b = −0.51, t(618) = −1.95, p = .05) on WC outcomes. These interactions indicated that higher genetic risk and lower social-environmental supports were associated with higher WC. There was also one significant SNS genetic risk-by-neighborhood satisfaction interaction (b = 1.48, t(618) = 2.23, p = .02) on WC that was inconsistent with the dual-risk pattern.
Findings indicate that neighborhood and genetic factors dually influence metabolic risk and that these relations may be complex and warrant further study.
NCT01025726.
Introduction
Obesity has become a global problem and it is estimated that approximately 500 million adults are obese, with nearly 1.5 billion identified as either overweight or obese worldwide [1]. Limited research has focused specifically on ethnic minority populations and the social-environmental contexts that increase vulnerability to stress and obesity, despite longstanding obesity-related health inequities. In the USA, over three fourths of all African-American adults are classified as overweight or obese (76.2%, including 69% of men and 82% of women) [2] in comparison to Caucasian adults (67.2%). Goals of the “Healthy People 2020” initiative [3], organized by the Department of Health and Human Services includes achieving health equity for all racial groups in the USA and understanding the influence of neighborhood and genetic factors on obesity, especially for high-risk populations. Thus, the present study examined the interaction of neighborhood and genetic risk influences in a longitudinal study on waist circumference (WC) in African-American adults.
Research that specifically investigates the role of the gene-by-environment interactions in adults has been limited. Most likely, this is because obesity is a complex chronic illness for which the etiology is only partially understood. Previous genetic research has had a strong emphasis on genome-wide association studies (GWAS) and limited gene–environment research has explored the role of neighborhood factors. Bioecological and stress and coping theories [4–7] are useful to apply when exploring potential causal pathways for gene and environmental interactions that influence obesity. Historically, African-American adults have been more likely to live in high-stress environments (e.g., higher rates of poverty or crime) and also may be more likely to carry genetic profiles that increase obesity-related vulnerability in response to chronic stress [8]. It is through assessing multiple systemic levels of an individual’s environment that the current study expands on past research to advance our understanding of the development of obesity.
Neighborhood environmental factors are important to consider when examining stress and obesity outcomes in African-American adults, especially often-overlooked social factors, such as collective efficacy, neighborhood social interaction, and neighborhood satisfaction [9]. Collective efficacy is conceptualized as the perceived overall ability of a community to instill trust and willingness to help or be helped by others within their neighborhood when help is needed. Cohen et al. [6] found that neighborhoods with low subjective ratings of collective efficacy were almost three times more likely to be at risk for overweight compared to neighborhoods with high levels of collective efficacy. Bjornstrom [10] found that higher collective efficacy was a protective factor for obesity. Importantly, the connection between collective efficacy and being less socially isolated, as well as living in neighborhoods with lower rates of crime is especially relevant for the current study [10]. Furthermore, based on their 12 month follow-up longitudinal study, Brown et al. [11] postulated that individuals with a net of support and opportunity for neighborhood social interactions had a more positive perception of their neighborhood, thus leading to more physical activity and better weight status. Phongsavan et al. [12] also highlighted that those who higher perceived levels of trust in their neighborhood had lower levels of stress.
Some previous research supports the associations between neighborhood social factors and weight-related outcomes. Interestingly, McDaniel et al. [13] found that neighborhood social life significantly predicted body mass index (BMI) such that a more positive neighborhood social life was associated with a healthier BMI. While not specifically social interaction, Christakis and Fowler [14] also found that an individual’s chances of developing obesity increased by 57% if they had a friend who also developed obesity recently and, ultimately, concluded that obesity seemed to “spread” via social relationships. However, to date, there is limited research that utilizes neighborhood social interaction, and even less for understanding obesity-related outcomes. Additionally, there is little research investigating the impact that neighborhood satisfaction has on weight-related outcomes. To date, studies have primarily examined neighborhood influences in relation to physical activity and cardiovascular outcomes. In a study by Siceloff et al. [15], it was shown that infrastructure for walking significantly predicted BMI but only when mediated by moderate-to-vigorous physical activity. These studies have identified collective efficacy, neighborhood social interaction, and neighborhood satisfaction as being important predictors of weight status, as well as highlighting the potential for stress to facilitate negative weight-related outcomes. The current study expands on previous research by assessing gene-by-neighborhood social environment interactions on weight-related outcomes in underserved African-American adults.
Adiposity is thought to be partially heritable as a complex, polygenic disorder, and previous research suggests that adiposity may be influenced by neighborhood environmental stressors, as well as neuroendocrine processes and genetic risk [16]. While BMI has been estimated to be 40%–70% heritable [17–19], WC may be even more heritable for African Americans, with genetic effects accounting for 76% and 77% of the variability in WC in men and women, respectively [20]. Given evidence that ethnic minority groups may be more likely to experience chronic social-environmental stress [21], genetic pathways that link to the stress response are relevant to understanding metabolic risk. During times of stress, physiologic mechanisms are initiated within the sympathetic nervous system (SNS). The SNS has many specific roles to play in regulating reactions to stress but, with regard to obesity, one of the most important is the regulation of energy expenditure. As energy expenditure is decreased coupled with resting metabolic rate, weight gain can occur [22, 23]. In an effort to identify mechanisms of stress that contribute to weight-related outcomes, understanding genetic variation in the form of single-nucleotide polymorphisms (SNPs) within the SNS pathway may be promising. Recent research has pointed to B-adrenergic receptor SNPs that may adversely affect energy expenditure leading to obesity and, thus, in an effort to better understand the pathophysiology of obesity, this study focused on the B1-adrenoceptor SNP Arg389Gly (rs1801253) and the B2-adrenoceptor Arg16Gly (rs1042713), which have been associated with obesity [24, 25], elevated blood pressure, and diabetes mellitus [26, 27].
Gene-by-environment interactions can be defined as genetic variants that only show their effect in the presence of an environment catalyst [28]. The impact of gene-by-environment interactions can be conceptualized within an additive risk model such that a particular genetic variant is viewed as a health-risk factor, with its presence predicting poorer outcomes when combined with environmental risk. Gene-by-environment interactions can also be conceptualized based on a differential susceptibility model such that a particular genetic variant is viewed as a sensitivity factor rather than a risk factor, with its presence predicting poorer outcomes with more negative environments but better outcomes with more positive environments [29]. With this in mind, the larger gene-by-environment interaction framework is appropriate as it will model how genetic factors interact with environmental factors that influence perceived stress, physiological processes, and subsequent weight-related outcomes.
There are relatively few studies that have examined cross-sectional gene-by-environment interactions, and even fewer have examined longitudinal patterns. While much of the past literature defines the “environment” in gene-by-environment as lifestyle factors, such as diet [30] and physical activity [30–33], there is little research in which the “environment” is measured as neighborhood social factors [34–37]. The current study expands on past research by examining how stress-related gene-by-environment interactions predict WC over 2 years in African-American adults. This study also focuses specifically on a high-risk population of African-American adults living in low-income communities. It was hypothesized that those carrying genetic variants associated with risk (i.e., high SNS SNP risk scores) and reporting high environmental stress (i.e., low neighborhood satisfaction, low neighborhood social life, low collective efficacy, and high perception of crime) would be associated with a larger WC over time.
Methods
Participants
Study participants were African-American adults who were recruited from the Positive Action for Today’s Health (PATH) trial [38]. The PATH trial aimed to investigate the effects of a 24 month environmental intervention to improve access and safety for walking in three low-income communities in the Southeastern USA that were matched by rates of crime, physical activity, proportion of ethnic minority residents, and annual income level using census data [38]. Data were collected at baseline, 12, 18, and 24 months. At the final data collection period (24 months), all participants in the PATH trial were given the opportunity to participate in a secondary study that involved a one-time additional assessment for the collection of buccal swab samples for measuring genetic risk and other subjective and objective measures related to chronic stress. Of the total 24 month sample (N = 318), 228 participants (72%) agreed to participate in the secondary study.
Inclusion criteria were: (a) African American (three of four grandparents of African heritage); (b) age 18 years or older; (c) no plans to move for the 2 year duration of the trial; (d) no medical condition that would limit participation in moderate-intensity physical activity, including life-threatening illness; (e) residing in the census area of the target community; (f) availability to participate in the evaluations and intervention over the duration of the larger trial; (g) controlled blood pressure (SBP/DBP <180/<110) and blood sugar levels (<300 nonfasting).
Procedures
All measures were obtained by trained and certified staff, and masters-level project leaders completed informed consent procedures with each participant. Study participants completed psychosocial questionnaires and anthropometric assessments at baseline, 12, 18, and 24 month time points. Participants who consented to participate in the secondary study provided buccal swabs for assessment of genetic risk and saliva samples for the measurement of basal cortisol and also completed additional surveys during a one-time assessment period. Participants were compensated for the additional time by receiving a gift bag with items valuing less than $10. Protections related to the handling and use of genetic samples were discussed with participants in detail prior to their provision of the samples. Specifically, it was explained that data would be de-identified and linked to other study data using numbers and not names, that only the study investigators have access to raw data, and that the information would be used only for the purposes specified in the consent form for the secondary study.
Measures
Demographics
Participants completed a demographic questionnaire that inquired about self-identified sex, age, highest education level, income, and marital status.
Neighborhood satisfaction
Participants answered questions to assess their satisfaction with their neighborhood using a subscale of the Neighborhood Environmental Walkability Scale (NEWS) [39]. Participants answered 17 questions on a four-point Likert scale, where higher scores indicated higher satisfaction with their neighborhood. The scale includes questions such as, “How satisfied are you with highway access from your home?” and “How satisfied are you with noise from traffic in your neighborhood?” Previous studies have shown this scale to have high internal consistency (α = .86) [40], and the current study demonstrated adequate internal consistency (α = .82). Factorial and criterion validity for this scale has also been established [41]. All items were averaged to create a neighborhood satisfaction score.
Neighborhood social life
Neighborhood social life was assessed using a nine-item self-report measure adapted from Parker et al.’s community social interaction scale [42]. Participants estimated how many days they participated in a certain activity in the past month in their neighborhood. This measure assessed the frequency of activities like “wave to a neighbor” and “sought advice from a neighbor.” All items were averaged to create a neighborhood social life score. Parker et al. [42] established construct validity for this scale within a sample comprised of 97% African-American women [42]. The social life measure in this study demonstrated adequate internal consistency (α = .84).
Collective efficacy
The Collective Efficacy Scale evaluates individuals’ perceptions of trust and willingness to help others for the overall good within their neighborhood [43]. This scale has two separate subscales, informal social control, and social cohesion and trust, consisting of five items each. An example question from the informal social control subscale was “what is the likelihood that your neighbors could be counted on to intervene in various ways if children were skipping school and hanging out on a street corner?” An example question from the social cohesion and trust subscale was “people around here are willing to help their neighbors?” Previous research has reported that these scales have strong construct validity, as well as high internal consistency [43, 44]. This study found adequate internal consistency for the informal social control subscale (α = .84) and for the social cohesion and trust subscale (α = .68).
Perception of safety from crime
There were six items taken from a subscale of the NEWS to assess participants’ perceptions of neighborhood safety [39]. Items included, “there is a high crime rate in my neighborhood” and “my neighborhood streets have good lighting at night.” Responses were given on a four-point Likert scale. After reverse-scoring some items, higher scores indicated greater perceptions of neighborhood safety. Saelens et al. [39] found this subscale to have strong construct validity. This scale showed adequate internal consistency (α = .65) in this sample.
Waist circumference
Trained and certified staff assessed WC on the “natural waist” line [45]. Measurements were collected in centimeters with a nontension tape measure. Participants stood erect with feet together, abdomen relaxed, and with arms to the side. Two measurements were taken per participant, with an additional measurement taken if values differed more than 1.0 cm. To ensure accuracy, measurement staff monitored the tape measure for horizontal alignment by working in pairs.
Genetic risk
Genetic buccal swab samples were collected by rubbing the inside of the cheek with a swab and then storing the swab at −80°C until samples were analyzed. Genetic samples received identification codes that were distinct from all other study identification codes. These separate codes were only available to the study Principal Investigator and Laboratory Director. DNA samples were genotyped in a university laboratory facility. Risk was quantified in a single variable by indexing the presence of nucleotides from the targeted SNPs that are linked to increased risk of negative cardiovascular and weight-related outcomes.
Each SNP was issued a score depending on whether the individual exhibited a genotype of homozygous (Table 2) for low-risk allele (score = 0), heterozygous (score = 1), or homozygous for high-risk allele (score = 2). This was conducted by averaging the two risk alleles that created a risk score for each participant. Participants were included in the analyses if they had genotype data for at least one of the two SNPs for each pathway. Participants who did not have one or more SNP for the SNS pathway model were excluded from that respective analysis (Table 2). Correlational analyses showed no significant correlation between the SNS SNPs (rs1801253, rs1042713; r = .01; p = .73).
Genotypes by single-nucleotide polymorphism (SNP) for the study sample
| SNP | Genotypes | n (%) |
|---|---|---|
| Arg16Gly (rs1042713) | GG | 48 (24%) |
| GA | 97 (48.5)) | |
| AA | 55 (27.5%) | |
| Total | 200 | |
| Arg389Gly (rs1801253) | CC | 64 (33.5%) |
| CG | 100 (52.4%) | |
| GG | 27 (14.1%) | |
| Total | 191 |
| SNP | Genotypes | n (%) |
|---|---|---|
| Arg16Gly (rs1042713) | GG | 48 (24%) |
| GA | 97 (48.5)) | |
| AA | 55 (27.5%) | |
| Total | 200 | |
| Arg389Gly (rs1801253) | CC | 64 (33.5%) |
| CG | 100 (52.4%) | |
| GG | 27 (14.1%) | |
| Total | 191 |
Bold represents the presence of genetic risk alleles in the medium and high risk groups.
Data Analytic Plan
The current study used one randomly selected imputation from 20 multiple imputations [46] to address missing data for anthropometric and survey measures, consistent with previous national trials, in this subsample of those who provided genetic data [47]. The MICE package [48] implemented within R (R Foundation, 2008) was used to generate 20 imputations. Of the 228 participants, only 28 (12%) were missing data. All predictor variables, except for genetic variables, were imputed in this study.
A growth curve analysis was used to allow for the estimation of effects occurring at multiple time points within an individual. Models were developed with the R statistical software package, version 3.1.2 (R Development Core Team), using a stepped approach. Given the longitudinal study design, random intercepts and random slopes for time were included in each model based upon recommendations by Raudenbush and Bryk [49].
We used an extensive model building process to determine a baseline model that involved examining fixed and random effects for a nonlinear trend over time. This first model building procedure involved testing a series of models with increasing complexity to predict WC. To determine which model best fit the data, a series of chi-square difference tests were conducted. When a more complex model fit the data better than a more parsimonious model, as indicated by a significant chi-square test statistic, the more complex model was retained. The model retained as the best fitting model, to be used as the baseline model for subsequent modeling, was a linear growth model (i.e., a model that did not include time2) that incorporated random intercepts and random slopes for time on the outcome. Time was centered around the 12 month time point. The final model allowed people to differ from each other for mean WC and changes in WC over the 2 year timeframe through the inclusion of random effects.
Tests for violations of regression and multilevel modeling assumptions were conducted and variable distributions indicated adequate variability with no significant skew or kurtosis. The WC outcome was normally distributed. Independent variables were heteroscedastic and multicollinearity was not found among model variables. Case diagnostics identified five WC outliers (4 standard deviations [SDs] outside the mean), and they were removed from the final data set.
Results
Demographic and Descriptive Data
Study sample
Demographic, psychosocial, environmental, and health outcome data are depicted in detail in Table 1 for the final sample in this study compared to the overall PATH trial study sample. Overall, the demographic data and key constructs were similar across the two samples. The final sample for the present study included 223 participants who were predominantly female (60%), with an average age of 53 years (SD = 15) and with an average BMI of 31 (SD = 7.4).
Descriptive data for model variables
| Characteristic | Study subsample | Total PATH sample |
|---|---|---|
| Sample size, no. (%) | 223 | 417 |
| Age (years) | 53.62 (15.6) | 51.65 (15.46) |
| Sex, no. (%) | ||
| Male | 91 (40.8%) | 153 (36.7%) |
| Female | 132 (59.2%) | 264 (63.3%) |
| Annual income, no. (%) | ||
| <$10,000 | 68 (30.5%) | 130 (31.2%) |
| $10,000–24,000 | 77 (34.5%) | 141 (33.8%) |
| >$25,000 | 78 (35.0%) | 146 (35.0%) |
| Education, no. (%) | ||
| <12th grade | 62 (27.8%) | 114 (27.3%) |
| GED/high school | 90 (40.4%) | 172 (41.2%) |
| Graduate | ||
| Attended college | 71 (31.8%) | 131 (31.5%) |
| BMI (kg/m2) | 31.15 (7.41) | 31.18 (8.41) |
| Waist circumference (cm) | 98.91 (16.7) | 97.01 (17.5) |
| MVPA baseline (min/day) | 33.53 (42.97) | 30.93 (39.92) |
| Blood pressure | ||
| Systolic | 119.99 (27.82) | 132.80 (17.85) |
| Diastolic | 79.59 (11.20) | 81.36 (10.93) |
| Perception of safety | 2.68 (0.61) | 2.72 (0.62) |
| Neighborhood satisfaction | 3.63 (0.66) | 3.64 (0.67) |
| Neighborhood social life | 10.47 (6.82) | 9.23 (5.82) |
| Collective efficacy— informal social control | 3.55 (1.19) | 3.56 (1.16) |
| Collective efficacy— social cohesion and trust | 3.54 (0.78) | 3.56 (0.81) |
Value are expressed as means (standard deviations) unless otherwise denoted as percentages.
BMI body mass index; DBP diastolic blood pressure; GED graduate education degree; MVPA moderate-to-vigorous physical activity; PATH Positive Action for Today’s Health. SBP systolic blood pressure.
Genetic data
Study genotype frequencies are provided in Table 2. The current study’s allele frequency distribution for Arg16Gly (rs1042713) and Arg389Gly (rs1801253) were consistent with literature cited in the National Center for Biotechnology Information SNP database [50], which looked at African-American adult populations.
Correlations
Bivariate correlations were conducted and indicated that WC was positively associated with age (r = .17, p < .01) and inversely associated with neighborhood social life (r = −.14, p < .01). Age was positively associated with perceived neighborhood safety (r = .11, p < .01), informal social control (r = .11, p < .01), social cohesion and trust (r = .19, p < .01), and neighborhood satisfaction (r = .14, p < .01), and negatively associated with neighborhood social life (r = −.11, p < .01) and SNS genetic risk score (GRS; r = −.11, [bolding represents the presence of the risk allele] p < .01).
SNS Genetic Risk-by-Neighborhood Social Environment Interactions
Results indicated that there were no significant two-way interactions with neighborhood environment variables and time, nor was there an SNS GRS by time interaction (Table 3). The model did not significantly predict WC change over time. However, there were three significant gene-by-neighborhood interactions. Simple slopes analysis (Fig. 1) was used to plot the three significant genetic interactions. Slopes were plotted for low genetic risk (no risk alleles), medium genetic risk (one risk allele), and high genetic risk (two risk alleles) groups. For the neighborhood variables, slopes were plotted at 1 SD above the mean for high neighborhood factors and 1 SD below the mean for low neighborhood factors. Specifically, a gene-by-neighborhood social life pattern (see Fig. 1) indicated that, as hypothesized, individuals with high genetic risk and poorer perceived neighborhood social life had the largest average WCs (103.2 cm) compared to medium (101.3 cm) and low (99.5 cm) GRS groups, b = −0.11, t(618) = −2.02, p < .05. However, those who perceived a more positive neighborhood social life exhibited similar WC measurements across GRS groups (low = 98.9, medium = 99.3, and high = 99.6). There was also a significant SNS-by-informal social control (collective efficacy) interaction (see Fig. 1), b = −0.51, t(618) = −1.95, p = .05, whereby individuals with high genetic risk and lower perceptions of neighborhood social control had the largest average WCs (102.7 cm) relative to medium (101.0 cm) and low (99.3 cm) genetic risk groups. However, adults across all three risk groups had similar WC measurements with high perceived informal social control (low = 99.1 cm, medium = 99.5 cm, and high = 100 cm). Furthermore, the model showed a significant SNS-by-neighborhood satisfaction interaction, b = 1.48, t(618) = 2.23, p < .05. This interaction plot (see Fig. 1) indicated that individuals with low neighborhood satisfaction, regardless of their genetic risk (low = 99.0 cm, medium = 99.0 cm, and high = 99.1 cm) exhibited nearly identical average levels of WC. However, unexpectedly and counter to our hypothesis, it was identified that those who perceived high neighborhood satisfaction and also had high genetic risk had the largest average WCs (103.7 cm) compared to medium-risk (101.5 cm) and low-risk (99.4 cm) groups. There was no significant interaction for SNS GRS across perceived social cohesion and trust or neighborhood safety. Finally, there was a main effect of time on WC, b = 0.60, t(618) = 2.87, p < .01, indicating that, on average (based on mean centering), participants had an increase of 0.60 cm in WC from the 12 to 24 month time points.
Outcome analyses for waist circumference
| Estimate | SE | Est/SE | p-value | |
|---|---|---|---|---|
| Intercept | 99.209 | 1.143 | 86.780 | .00*** |
| Time point | 0.604 | 0.210 | 2.870 | .00*** |
| Tx-Walking | −0.890 | 1.614 | −0.551 | .58 |
| Tx-Full | −0.471 | 1.700 | −0.277 | .78 |
| Age | 0.031 | 0.025 | 1.233 | .22 |
| Sex | 3.568 | 2.327 | 1.533 | .13 |
| N Soc Life | −0.039 | 0.029 | −1.354 | .18 |
| CE-ISC | −0.112 | 0.140 | −0.800 | .42 |
| CE-SCT | 0.199 | 0.263 | 0.757 | .45 |
| Safety | 0.026 | 0.324 | 0.079 | .94 |
| Nsat | 0.250 | 0.353 | 0.708 | .48 |
| SNS GRS | 1.086 | 2.131 | 0.509 | .61 |
| SNS GRS × Time | 0.142 | 0.386 | 0.369 | .71 |
| N Soc Life × SNS GRS | −0.108 | 0.054 | −2.018 | .04* |
| N Soc Life × Time | 0.002 | 0.032 | 0.049 | .96 |
| CE-ISC × SNS GRS | −0.510 | 0.262 | −1.950 | .05* |
| CE-ISC × Time | −0.050 | 0.189 | −0.267 | .79 |
| CE-SCT × SNS GRS | −0.339 | 0.450 | −0.754 | .45 |
| CE-SCT × Time | −0.026 | 0.296 | −0.089 | .93 |
| Safety × SNS GRS | −0.385 | 0.624 | −0.617 | .54 |
| Safety × Time | 0.319 | 0.387 | 0.824 | .41 |
| NSat × SNS GRS | 1.482 | 0.664 | 2.233 | .02* |
| NSat × Time | 0.043 | 0.392 | 0.110 | .91 |
CE-ISC collective efficacy—informal social control; CE-SCT collective efficacy—social cohesion and trust; N Soc Life neighborhood social life; NSat neighborhood satisfaction; Safety perceived safety from crime; SNS GRS sympathetic nervous system genetic risk score; Tx treatment.
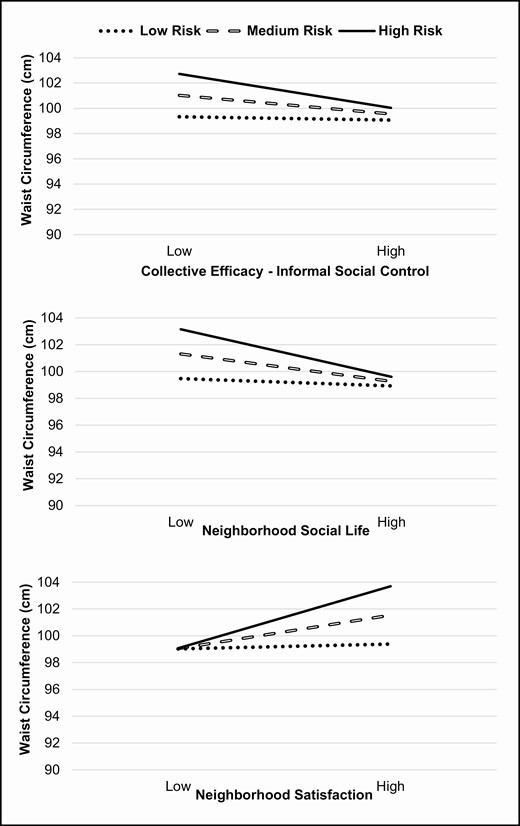
Genetic risk-by-collective efficacy, neighborhood social life, and neighborhood satisfaction interaction in predicting waist circumference.
Suppressor Analyses
It is possible that the unexpected interaction between genetic risk and neighborhood satisfaction could be due to having a complex model with multiple neighborhood factors, and their interactions being correlated, causing a suppression effect. Our analytic plan avoided dropping and adding terms during model building to reduce the chances of finding a spurious effect. Additional analyses were conducted in which all the neighborhood factors other than neighborhood satisfaction and the interaction with SNS genetic risk were dropped. The interaction effect was somewhat reduced from 1.48 to 1.07, with the p-value going from .03 to .08 but, overall, the result is substantively the same and the effect size remained in the moderate range.
Power Analyses
Power analyses were conducted to determine the size of the interactions that we had power to detect in this study. For these analyses, we used the estimated standard errors for the interactions reported in Table 3 and then multiplied these by the critical T-value for a 95% CI plus the T-value for a probability of .2 to estimate the detectable effect size with 80% power [51]. To quantify the size of these effects, we calculated the simple slopes for when the GRS score is at its minimum (0) and at its maximum (2). From these simple slopes, we then calculated the difference in WC (cm) between someone who was 1 SD below the mean on the neighborhood variable versus someone who was 1 SD above the mean on the variable. These detectable differences were 4.92 cm for neighborhood satisfaction, 4.13 cm for neighborhood social life, 3.50 cm for informal social control, 3.94 cm for social cohesion and trust, and 4.27 cm for perceived neighborhood safety. These are symmetrical around zero such that we also had 80% power to find an interaction of −4.13 cm or less (e.g., for neighborhood social life). The literature of effects on WC suggests that an impact on WC of 3–4 cm [52, 53] is a medium effect size and an effect of 5 cm [54] or greater is a large effect size. Thus, in this study, we had the power to detect a medium-to-large effect size for the five interactions studied.
Discussion
The primary aim of this study was to assess the interacting impact of genetic risk (SNS risk scores) and the perceived neighborhood social environment (neighborhood satisfaction, neighborhood social life, collective efficacy, and safety from crime) on WC over time in African-American adults. It was hypothesized that those who experienced high genetic risk and more negative neighborhood perceptions would have the largest WCs over time, consistent with stress-related increased cardiometabolic risk. The model evaluating the SNS pathway indicated multiple significant gene-by-environment interactions. Specifically, SNS genetic risk moderated the relation between two neighborhood variables (perceived social life and informal social control) and WC such that respondents with less positive perceptions and greater genetic risk had greater WCs. The significant moderating effect of SNS genetic risk on the relation of a third variable (perceived neighborhood satisfaction) with WC occurred in the opposite direction; as neighborhood satisfaction increased, so did participants’ WC for those with higher genetic risk. Also, of note, all models indicated a main effect of time such that, on average, an individual’s WC increased over time. Finally, in all three significant interactions, WC in participants in the lowest-risk genetic group was unaffected by the environmental factors, regardless of the direction of the result for the high genetic risk group.
Conceptually, for the most part, the patterns found were consistent with a dual-risk interaction model; those with the highest genetic risk who also endorsed negative neighborhood perceptions experienced the most deleterious outcomes in terms of WC in a stepwise pattern based on the three levels of genetic risk. In other words, individuals with high genetic risk may be most vulnerable to adverse weight-related outcomes in the context of poor neighborhood supports, whereas more positive neighborhood perceptions may be protective.
The pattern of interaction between SNS and informal social control showed, as hypothesized, that individuals with high genetic risk and low perceptions of neighborhood social control had the largest WCs relative to the other two risk groups at the low informal social control level. Interestingly, when the environment was more positive, the high genetic risk group had a similar WC as the other two lower genetic risk groups. In other words, having a high perception of neighborhood informal social control showed a buffering pattern of protection against high WC in the most genetically vulnerable individuals. This finding is novel as there is no known research assessing the impact of informal social control and genetic risk on WC, even when considering literature focused on the larger collective efficacy construct in general. Cohen et al. [6] found that individuals living in neighborhoods with low collective efficacy (including social control) were almost three times more likely to be overweight than those residing in neighborhoods with high collective efficacy. Bjornstrom [10] also identified higher collective efficacy as a protective factor for obesity. Our findings are consistent with these previous studies but expand on past research by focusing solely on African-American adults and assessing the moderating effects of genetic risk.
As hypothesized, individuals with high genetic risk and low neighborhood social life had the largest WC outcomes compared to the other two risk groups (i.e., low and medium genetic risk) at the low neighborhood social life level. This is indicative of the dual-risk model as those with the highest genetic risk and with high perceptions of negative environment presented the most deleterious outcome, which, in this case, is the largest WC. However, once the environment was perceived as more supportive, the high genetic risk group had a WC similar to the other two lower-risk groups. Conceptualized otherwise, individuals in the high genetic risk group were the most vulnerable for negative obesogenic outcomes and, in addition, a more positive neighborhood social life environment was more protective for them than for those individuals at less genetic risk. This is a novel finding as there is no identified research that assesses the impact of gene- by-environment interactions on WC, especially when looking at neighborhood social life as a moderator. There is minimal research on neighborhood social environments and obesity-related outcomes and relatively few studies that incorporate genetic risk as a moderator. Two recent review papers on neighborhood social environment and obesity identified that there is limited research on leveraging the neighborhood social environment to promote healthy behaviors [9, 55]. Research that has focused on the neighborhood social environment as a point of intervention has demonstrated success in promoting healthy behaviors, such as fruit vegetable intake and increased physical activity [56]. However, in the aforementioned reviews, they did not find any studies that assessed obesity outcomes, such as BMI or WC. While previous studies have examined health-related behaviors (i.e., fruit and vegetable intake and physical activity), this may not directly translate to a decreased rate of obesity or weight status. This study begins to connect this critical gap. There continues to be limited neighborhood social life research; however, the current findings add further support for the importance of the interaction between neighborhood social environment and genetic risk on weight-related outcomes in African-American adults.
The significant SNS-by-neighborhood satisfaction interaction showed unexpectedly that more positive perceptions of neighborhood satisfaction were associated with greater WCs, with the increase in WC most prominent in the highest genetic risk group. Additional analyses of potential suppressor effects were conducted but overall did not explain this unexpected finding. This unexpected pattern perhaps indicates that assumptions about what constitutes neighborhood “risk” may be incorrect or may oversimplify relations among neighborhood variables and health outcomes, such as WC. Although some studies have supported the association between neighborhood satisfaction and more positive health outcomes, including BMI [57, 58], several other large-scale studies have shown an unexpected direction for neighborhood factors on weight-related outcomes in African-American populations [59, 60]. These studies demonstrate that, rather than being uniformly protective, positive neighborhood factors are sometimes associated with increased weight-related outcomes, such as BMI. Gary-Webb et al. [59] showed that, in two predominately African-American communities, associations between changes in neighborhood perceptions and weight-related outcomes over 3 years varied across neighborhood constructs. For example, improvements in perceptions of safety or neighborhood quality were associated with higher BMI compared to those who perceived no change or deterioration in neighborhood safety. Additionally, Waldstein et al. [60] provide further support for the notion that the influence of neighborhood perceptions on weight-related outcomes is more complex than what is often hypothesized. For example, in their study, they showed that BMI and WC for white adults living in poverty were higher, while, for African-American adults living in poverty, BMI and WC were lower. The authors suggest a number of explanations that could account for this difference, including the scaling of socioeconomic variables for African-American communities, the possibility that a healthy-weight status represents food insecurity or intermittent access to food, dysfunctional gene–environmental interactions, and basic biological differences of disadvantaged and ethnic minorities. In short, this unexpected finding in the present study may be a result of more complex patterns of gene–environmental factors especially relevant for underserved African Americans. A greater understanding of neighborhood satisfaction in the context of poverty and ethnic minorities is needed.
Several limitations of this study should be noted. One limitation of this study was that we evaluated the impact of only two SNPs within the SNS pathway. As genome-wide association studies continue to identify additional SNPs that may play a role in cardiometabolic risk, future research could include a more robust set of genetic markers. The impact of self-reported perceptions may be qualitatively different than that of objectively measured neighborhood attributes. Census-tract data, for example, could provide an important, alternative perspective on the impact of community-level variables. The relatively small sample size of the current study is also a limitation and, although the power calculation indicated that some of the effect sizes associated with the change of 3–4 cm in WC were consistent with past research, further research is needed with larger sample sizes to demonstrate the reliability of these interactions. Some investigators [61] have, however, argued that more precise measurement and use of repeated-measures designs can cut down on the necessity of a large sample size, specifically for continuous environmental variables and genetic factors on a continuous outcome. Finally, this study only looked at WC, which did fill a gap in the current literature; however, continuing to assess other types of adiposity and stress measures may be important as well.
Findings of the current study supported hypotheses that positive neighborhood social perceptions buffer the effect of high genetic risk on WC in African-American adults. However, because the neighborhood social context, and the influence it carries, is likely more complex than being simply positive or negative, these findings add to a body of literature with mixed results. It is, therefore, important that future efforts expand this research by evaluating specific social support constructs [62] (e.g., social contagion, social capital, and social selection). Obesity is and continues to be a complex, multifactorial disorder that increasingly impacts African-American adults. Further research on neighborhood and genetic risk factors is needed to better understand its development in at-risk populations and subsequent community-based interventions for those at particularly high risk.
Acknowledgments
This article was supported by a grant (R01 DK067615) funded by the National Institute of Diabetes and Digestive and Kidney Diseases to D.K.W.
Compliance with Ethical Standards
This study adhered to appropriate ethical standards and the Helsinki Declaration.
Authors’ Statement of Conflict of Interest and Adherence to Ethical Standards
The authors declare that they have no conflict of interest.
Authors’ Contributions
D.K.W. is the principal investigator of the PATH trial and provided oversight on all aspects of the project including the theoretical framework, analyses, reporting of results, and writing of the manuscript. T.M. assisted in conceptualizing the current study and was involved in all aspects of the project including analyses, reporting of results and writing of the manuscript. M.S.C. was involved in the collection of data, the conceptualizing of the project, and with data analyses related to the genetic risk scores, as well as the writing of the manuscript. A.M.S. Sweeney assisted with the modeling and reporting of results as well as writing of the manuscript. M.L.V.H. provided statistical oversight as a co-investigator of the PATH trial and lead statistician on the project as well as assisted with the conceptualizing and writing of the manuscript.
Ethical Approval
This study was approved by the University of South Carolina Institutional Review Board.
Informed Consent
This study followed appropriate informed consent procedures and was approved by the University of South Carolina Institutional Review Board.
