


Abstract
African American women participate in less physical activity (PA), have higher rates of chronic disease, and report higher perceived stress relative to other race and sex demographic groups.
Based on the stress-buffering hypothesis, this study tested the hypothesis that social support would buffer the negative effects of perceived stress on moderate-to-vigorous PA (MVPA) under high, but not low, perceived stress.
Participants were 143 African American women (mean [M] age = 43.94, standard deviation [SD] = 8.62; M body mass index = 37.94, SD = 8.11) enrolled in the Families Improving Together (FIT) for Weight Loss Trial. Average daily minutes of MVPA were obtained via 7 day accelerometer estimates at baseline and 8 and 16 weeks.
A multilevel growth model demonstrated a significant three-way interaction between stress, social support, and time (B = −0.31, standard error [SE] = 0.14, p = .03). Simple slopes analyses revealed that, at baseline, among participants with high social support (+1 SD), stress was positively associated with greater MVPA (B = 0.49, SE = 0.18, p = .008), whereas among participants with low social support (−1 SD), stress was not significantly associated with MVPA (B = −0.04, SE = 0.14, p = .81). However, at 8 and 16 weeks, stress was not significantly associated with MVPA for either high or low support groups.
Findings highlight the importance of integrating constructs of stress and social support into future physical activity intervention programs for African American women and the need to evaluate changes in stress and social support longitudinally.
Introduction
Physical activity (PA) is a protective health behavior that has been associated with decreased risks of cancer [1], type 2 diabetes [2], cardiovascular disease, and all-cause mortality [3]. Robust literature documents the various physical, social, and cognitive benefits of engaging in regular PA; however, only 49% of American adults achieve national PA recommendations [4]. PA levels among African American women are even lower with only 35% meeting the recommended guidelines, making theirs the lowest prevalence of any race and sex group [4].
Adherence to a PA routine can be impeded by a variety of factors, including perceived stress [5, 6]. Perceived stress refers to demands that threaten to exceed an individual’s perceived resources [7], with particular emphasis on the individual’s evaluation and perception of stressors and resources [8, 9]. African American women in particular have reported higher levels of perceived stress compared to white adults [10, 11], yet few past studies have focused on African American women in understanding stress-buffering effects. Previous studies have shown [12] that stress, socioeconomic adversity, marginalization, and stigma result in negative health outcomes for ethnic and racial minorities [13, 14]. Many of these negative outcomes, including stress, can be managed or attenuated by engaging in regular PA [4, 6]. Thus, further research is needed to better understand the impact of stress on PA in African American women.
In addition to stress, perceived social support is an important determinant of PA [15–18]. There are two theories about how social support may increase the engagement or maintenance of PA. The main effects hypothesis posits that social support should have a beneficial effect on PA regardless of one’s level of stress [19]. Thus, based on this hypothesis, one would expect perceptions of social support to be positively related to PA over time under both high- and low-stress conditions. Alternatively, the stress-buffering hypothesis posits that perceptions of social support buffer the negative effects of stress on PA but only under conditions of high perceived stress [19]. Thus, based on the stress-buffering hypothesis, one might expect that greater perceptions of social support would lead to greater PA for those under conditions of high stress, whereas social support should not differentially impact PA among individuals with low perceptions of stress. Notably, the stress-buffering hypothesis [19] has traditionally been applied to understanding negative health outcomes, such as cardiovascular disease [20] and mental health outcomes [21]. These deficit-based models typically hypothesize that those under high support will be buffered from stress and will maintain their current health status. Conversely, the current study assesses stress-buffering effects on PA, which is a protective health behavior. Thus, unlike traditional buffering studies, one might expect an increase in PA under conditions of high support during high stress as some individuals cope with stress by engaging in PA.
Few studies have examined stress-buffering effects on PA or evaluated the longitudinal impact of these effects. One study investigated the cumulative impact of neighborhood greenspace, stress, and social support on PA engagement [22]. The investigators found that access to park spaces (green spaces, public recreation, and socialization opportunities) directly increased engagement in PA and indirectly reduced stress through increased opportunities for social support. Other studies have only evaluated main effect associations with stress and social factors on PA. For example, one study assessed associations between PA and a number of variables, including stress and social support among women and found that both stress and social support were associated with PA; however, an interaction effect of stress and support was not evaluated [18]. Thus, our study expands on past research by evaluating stress-buffering effects on PA over time in African American women.
Given that African American women have higher rates of chronic disease and perceived stress and lower rates of PA than other race/sex groups [4, 10–13], the current study examines whether perceived social support moderates the relationship between perceived stress on PA in African American women using a longitudinal design. We hypothesized that, only under high levels of social support, high levels of perceived stress would be significantly associated with PA and that these effects would be maintained overtime.
Methods
Study Design
Baseline data were collected from women who participated in the Families Improving Together (FIT) for Weight Loss Trial [23] (clinicaltrials.gov, #NCT01796067) and a supplementary study known as HEART. The aim of Project FIT was to evaluate the efficacy of a motivational plus family-based weight-loss intervention versus a comprehensive health education program on reducing body mass index (BMI) in overweight or obese African American adolescents and their caregivers [23].
Participants
Data were collected from 143 African American female caregivers who were recruited through local events, radio advertisements, and partnerships with the parks and recreation department and pediatric clinics. Eligibility was based on the following criteria: (a) African American adolescent aged of 11–16 years, (b) primary caregiver willing to participate, (c) adolescent with a BMI ≥85th percentile, and (d) access to internet. Families were ineligible if either the participating caregiver or the adolescent were enrolled in another weight-loss program or if the adolescents had a medical condition or were on medications that could affect diet or ability to participate in PA. Prior to enrollment in the study, participants signed an informed consent approved by the University of South Carolina Institutional Review Board. Dyads were compensated $100 for their time and participation in providing measures at baseline and 8 and 16 weeks. A total of 11 observations were excluded due to missing baseline surveys (n = 2), demographics (n = 1), BMI data (n = 3), or PA data at all time points (n = 5), yielding a final sample size of 132.
Measures
Demographics
Demographic data were collected at baseline, including the caregiver’s age, education, marital status, and annual household income.
Perceived Stress Scale
The 10-item Perceived Stress Scale (PSS) was used to evaluate perceived stress [24]. Items ranged from “never” to “very often” on a five-point scale. A sample item was “In the last month, how often have you felt you were unable to control the important things in your life?” This scale has an internal consistency of .91 in national samples [25], has demonstrated convergent and divergent validity with other stress measures [7, 26], and has been used in African American samples [27]. The Cronbach’s alpha was .85 in the present sample.
Multidimensional Scale of Perceived Social Support
The Multidimensional Scale of Perceived Social Support (MSPSS) [28] evaluates an individual’s perception of the adequacy of their social relationships. This general measure of support was used to allow for a broader or more comprehensive assessment of social support. Given that perceived stress is a general measure of stress across life domains, we selected a more general measure of social support to better understanding stress-buffering effects. The measure specifically evaluates three facets of social support: perceived support from friends, family, and significant others. The scale consists of 12 items on a 7-point scale, and an individual’s score is calculated by averaging across all items. A sample item was “I get the emotional help and support I need from my family.” The MSPSS measure has good psychometric properties, including construct validity and has been used with African American adults [29–31]. In the present study the Cronbach’s alpha was .94.
Moderate-to-vigorous physical activity
A daily average of moderate-to-vigorous physical activity (MVPA) was assessed via Actical omni-directional accelerometers for seven consecutive days (Mini Mitter, Bend, OR) at baseline and 8 and 16 weeks. PA minutes were measured using Actical accelerometry estimates cut points that have been validated among African American adults [32]. Acticals have adequate test retest reliability coefficients for MVPA ranging from .85 to .90. Sixty consecutive zero counts were coded as time of nonwear based on past studies [33]. Daily activity was evaluated using specific time intervals (6:00 am to 12:00 pm, 12:00 pm to 4:00 pm, 4:00 pm to 8:00 pm, and 8:00 pm to 12:00 am), which were combined as a total MVPA score for each day.
Analysis Plan
To account for missing accelerometry wear time, the present study used a weighted mixed-model approach with variance weighting by the inverse of daily wear time proportions. This approach results in cases with a higher proportion of missing wear time being down weighed compared to cases with less missingness, which has been shown to improve precision in estimating accelerometry-estimated PA beyond traditional approaches [34]. In the present study, a valid day was defined as 10 hr of wear time, but no limits were set on the number of required days. At baseline, participants averaged 5.8 days of wear (standard deviation [SD] = 3.3), with wear time declining slightly over time at 8 weeks (M = 3.5 days, SD = 2.6) and 16 weeks (M = 2.4 days, SD = 2.9). Little’s test of missing completely at random was conducted using the primary predictors, outcome variable, and covariates (age, income, BMI, and season) and revealed that the data were not missing completely at random (χ2[1, N = 60] = 1,214.61, p < .01). These findings suggest that the covariates significantly predicted the pattern of missingness and are, therefore, important to include to provide an unbiased model that assumes missing at random. Additionally, MVPA was positively skewed and was normalized using a square root transformation [23, 35]. Scores for social support and stress were calculated by norming each item before summation to allow each item to contribute equally to the overall scale score. Summed scale scores were transformed to z scores to aid in analysis and interpretation of statistical models.
Multilevel growth modeling was used to account for the hierarchical structure of the data using the nlme package in R. Assumptions for multilevel modeling were evaluated, including the presence of influential cases, normality, and heteroscedasticity. One influential case was identified. However, removal of the observation did not alter the significance of the model parameters. Time was centered such that baseline = 0, 8 weeks = 0.5, and 16 weeks = 1. The model tested for interactions between time, perceived stress, and social support. A significant three-way interaction would indicate the moderating role of social support on stress in predicting MVPA across time. The model included both random intercepts and random slopes for time on MVPA. Age, income (1 = greater than $40k), and BMI were included as covariates due to their known associations with MVPA. Dummy codes were created for winter seasonal effects at each time point. Additionally, separate dummy codes were created for group and online treatment to account for intervention effects from the larger trial. Grand-mean centering was applied to all continuous covariates.
Results
Descriptive Statistics
The mean age of the sample was 44.02 years (SD = 8.68), and the average BMI was 37.83 (SD = 8.28). A total of 35.2% of the women were married (see Supplementary Material for full demographics). A total of 84.7% of participants had completed at least 1 year of college. For annual household income, 15.4% of participants reported incomes less than $10,000, 18.2% reported $10,000–$24,000, 27.3% reported $25,000–$39,000, 14.0% reported $40,000–$54,000, 9.1% reported 55,000–69,000, while 4.2% reported greater than $70,000. Average MVPA was 8.59 min per day (SD = 13.7). Average perceived stress on a five-point scale was 2.52 (SD = 0.67) and average perceived social support on a seven-point scale was 5.25 (SD = 1.34).
Bivariate Correlation Analyses
Bivariate correlations were performed for the covariates, predictors, and outcome variables. Perceived stress and social support were correlated in the expected direction (r = −.26, p < .01). Income was correlated with both perceived stress (r = −.23, p < .01) and perceived social support (r = .29, p < .01).
Stress, Social Support, and MVPA
A multilevel growth model was conducted to assess whether social support at baseline moderated the effects of stress at baseline on MVPA across 16 weeks while controlling for demographic factors (Table 1). There was a significant stress-by-social support interaction (B = 0.26, SE = 0.09, p = .004), indicating that, at baseline, stress moderated the effects of social support. Importantly, there was also a significant three-way interaction between stress, social support, and time (B = −0.31, SE = 0.14, p = .032), indicating that this moderated effect decreased over 16 weeks. To further evaluate the interaction between perceived stress and social support at baseline on MVPA across time, simple slopes were computed for the interaction between baseline stress and social support on MVPA over each of the three time points (baseline, 8 weeks, and 16 weeks) as shown in Fig. 1. At baseline, among participants with high social support (+1 SD) stress was positively associated with greater MVPA (B = 0.49, SE = 0.18, p = .008), whereas among participants with low social support (−1 SD), stress was not significantly associated with MVPA (B = −0.04, SE = 0.14, p = .81). However, at 8 weeks, stress was no longer significantly associated with MVPA for those with high social support (B = 0.22, SE = 0.19, p = .25) or those with low social support (B = −0.01, SE = 0.15, p = .96). Similarly, at 16 weeks, stress was not significantly associated with MVPA for those with high social support (B = −0.05, SE = 0.26, p = .86) or those with low social support (B = 0.05, SE = 0.22, p = .82). We note that, while the graph appears to show the main effects of social support increasing over time, we are not interpreting this as it is not strongly supported by the results in Table 1, which show a marginal main effect of social support at baseline and no significant interaction over time.
Multilevel growth model predicting moderate-to-vigorous physical activity across 16 weeks
| B | SE | p | Lower 95% CI | Upper 95% CI | |
|---|---|---|---|---|---|
| Fixed effects | |||||
| Intercept | 2.20 | 0.23 | <.001 | 1.75 | 2.65 |
| Age (mean centered) | −0.03 | 0.01 | .075 | −0.05 | 0.00 |
| Income | 0.50 | 0.25 | .050 | 0.00 | 1.01 |
| Winter (Baseline) | 0.56 | 0.32 | .076 | −0.06 | 1.18 |
| Winter (8 weeks) | −0.21 | 0.22 | .320 | −0.64 | 0.21 |
| Winter (16 weeks) | 0.53 | 0.30 | .079 | −0.06 | 1.13 |
| Group treatment | – | – | >.05 | – | – |
| Online treatment | – | – | > .05 | – | – |
| BMI (mean centered) | 0.00 | 0.01 | .818 | −0.03 | 0.03 |
| Time | −0.08 | 0.17 | .651 | −0.41 | 0.26 |
| Perceived stress (z score) | 0.23 | 0.14 | .102 | −0.05 | 0.50 |
| Social support (z score) | 0.22 | 0.13 | .084 | −0.03 | 0.48 |
| Time × Perceived stress | −0.22 | 0.17 | .185 | −0.56 | 0.11 |
| Time × Social support | 0.10 | 0.17 | .545 | −0.23 | 0.44 |
| Perceived stress × Social support | 0.26 | 0.09 | .004 | 0.09 | 0.44 |
| Time × Perceived stress × Social support | −0.31 | 0.14 | .032 | −0.59 | −0.03 |
| Random effects | |||||
| Intercept | 1.08 | ||||
| Time | 0.85 | ||||
| Residual | 1.31 |
Estimates for group and online treatment are redacted as the outcome paper for the larger Families Improving Together trial is still in preparation.
BMI body mass index; CI confidence interval; SE standard error.
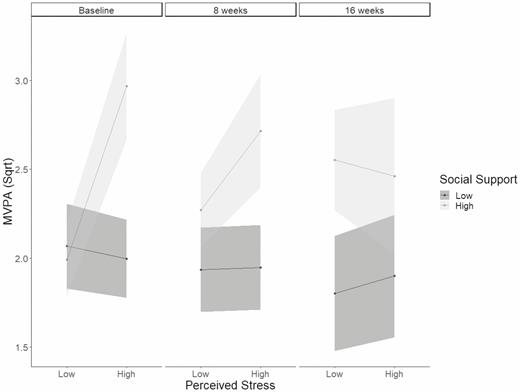
Interaction between perceived stress and social support on moderate-to-vigorous physical activity (Sqrt) at baseline, 8 weeks, and 16 weeks.
The overall model was also evaluated without covariates and the two-way interaction remained significant (B = 0.22, SE = 0.09, p = .012), while the three-way interaction was only marginally significant (B = −0.27, SE = 0.14, p = .061). The model was also evaluated with depression as a covariate, and it was not a significant covariate. The two-way (B = 0.37, SE = 0.11, p < .001) and three-way interactions remained significant (B = −0.32, SE = 0.15, p = .036).
Discussion
The present study revealed that, at baseline, there was a moderating effect of social support on the relationship between perceived stress and MVPA such that, under high levels of social support, perceived stress was positively associated with MVPA, whereas, under low levels of social support, perceived stress was not significantly associated with MVPA. These results suggest that, at baseline, high levels of social support and high levels of stress were associated with increases in MVPA. However, further analyses revealed that, at the later time points, the interaction between baseline levels of perceived social support and stress showed a leveling off in predicting PA at 8 and 16 weeks. Although we hypothesized maintenance, the study design limited our ability to provide a strong test of this since stress and social support were measured at a single time point. Future studies should obtain repeated measures of stress and support measures to adequately assess stress-buffering effects overtime on PA.
The current study lends support to the stress-buffering hypothesis on PA at baseline. Furthermore, we found no significant main effect of perceived stress or social support on PA over time. This is the first study to our knowledge to assess stress-buffering effects on PA longitudinally among African American women and expands on past studies that have reported associations between stress, social support, and PA [15–18]. Specifically, these studies showed that social support and stress were positively related to PA; our study expands on these findings to suggest that social support was positively associated with PA among African American women who perceived high levels of stress. These findings highlight the importance of integrating constructs of stress and social support into future PA intervention programs.
Interestingly, among those with high social support, stress was positively associated with greater levels of MVPA at baseline. Greater PA under conditions of high stress might be expected as PA may be a coping strategy for some individuals. This finding expands on current literature, which suggests that integrating social support resources for health promotions may be important for preventing lapses in PA among women who perceive high levels of stress [17, 36]. Further studies are needed to elucidate how support is functioning and what sources and types of support are most useful for increasing PA among women who are highly stressed.
There were several limitations of this study. First, the effect sizes found were small; thus, further studies are warranted to determine the clinical significance of these findings. Second, the sample size utilized was relatively small. Lastly, although there were strong correlations between income and a variety of variables, no measure of financial stress was included in participants’ assessments [7]. This may account for some of the unexplained variance in the model and should be considered in future studies.
In conclusion, the findings from this study are among the first to highlight the importance of integrating constructs of stress and social support into future PA intervention programs for African American women and the need to evaluate changes in stress and social support longitudinally.
Acknowledgments
This research was supported by a grant (R01 HD072153) funded by the National Institute of Child Health and Human Development to D.K.W., ClinicalTrials.gov, #NCT01796067, and by a grant from the National Institute of General Medical Sciences (T32GM081740), Advanced Support Program for Integration of Research Excellence-II grant to A.B.
Compliance with Ethical Standards
Authors’ Statement of Conflict of Interest and Adherence to Ethical Standards The authors report no conflict of interest.
Authors’ Contributions D.K.W. is the principal investigator of the FIT trial and provided oversight on all aspects of the project including the theoretical framework, analyses, reporting of results, and writing of the manuscript. A.B. assisted in conceptualizing the current study and was involved in all aspects of the project including analyses, reporting of results and writing of the manuscript. A.M.S. and M.L.V.H. assisted with statistical oversight and with the analyses, reporting of results and writing of the manuscript.
Ethical Approval This study adhered to appropriate ethical standards and the Helsinki Declaration. This study was approved by the University of South Carolina Institutional Review Board.
Informed Consent This study followed appropriate informed consent procedures and was approved by the University of South Carolina Institutional Review Board.
